Verify Installation
-
Check the logs for errors
Scroll down to the bottom of the log to see the outcome. If there was an error during installation, details will be included at the end of the log. The most common errors are due to insufficient quota for some resource. If you get an error about insufficient quota, you may need to clean up unused resources or request a quota increase for the affected resource. Once you have done that, navigate back to the stack details (for example, using the breadcrumbs) and click on the Apply to try again.
When the installation completes normally, the end of the log should look something like this:
Apply complete! Resources: 77 added, 0 changed, 0 destroyed.

Outputs:
adb_ip = "Secured Access"
adb_name = "KATYDIDDB"
apisix_admin_password = <sensitive>
grafana_admin_password = <sensitive>
kubeconfig_cmd = "oci ce cluster create-kubeconfig --cluster-id ocid1.cluster.oc1... --region us-ashburn-1 --token-version 2.0.0 --kube-endpoint PUBLIC_ENDPOINT --file $HOME/.kube/config"
oractl_admin_password = <sensitive>
oractl_user_password = <sensitive>
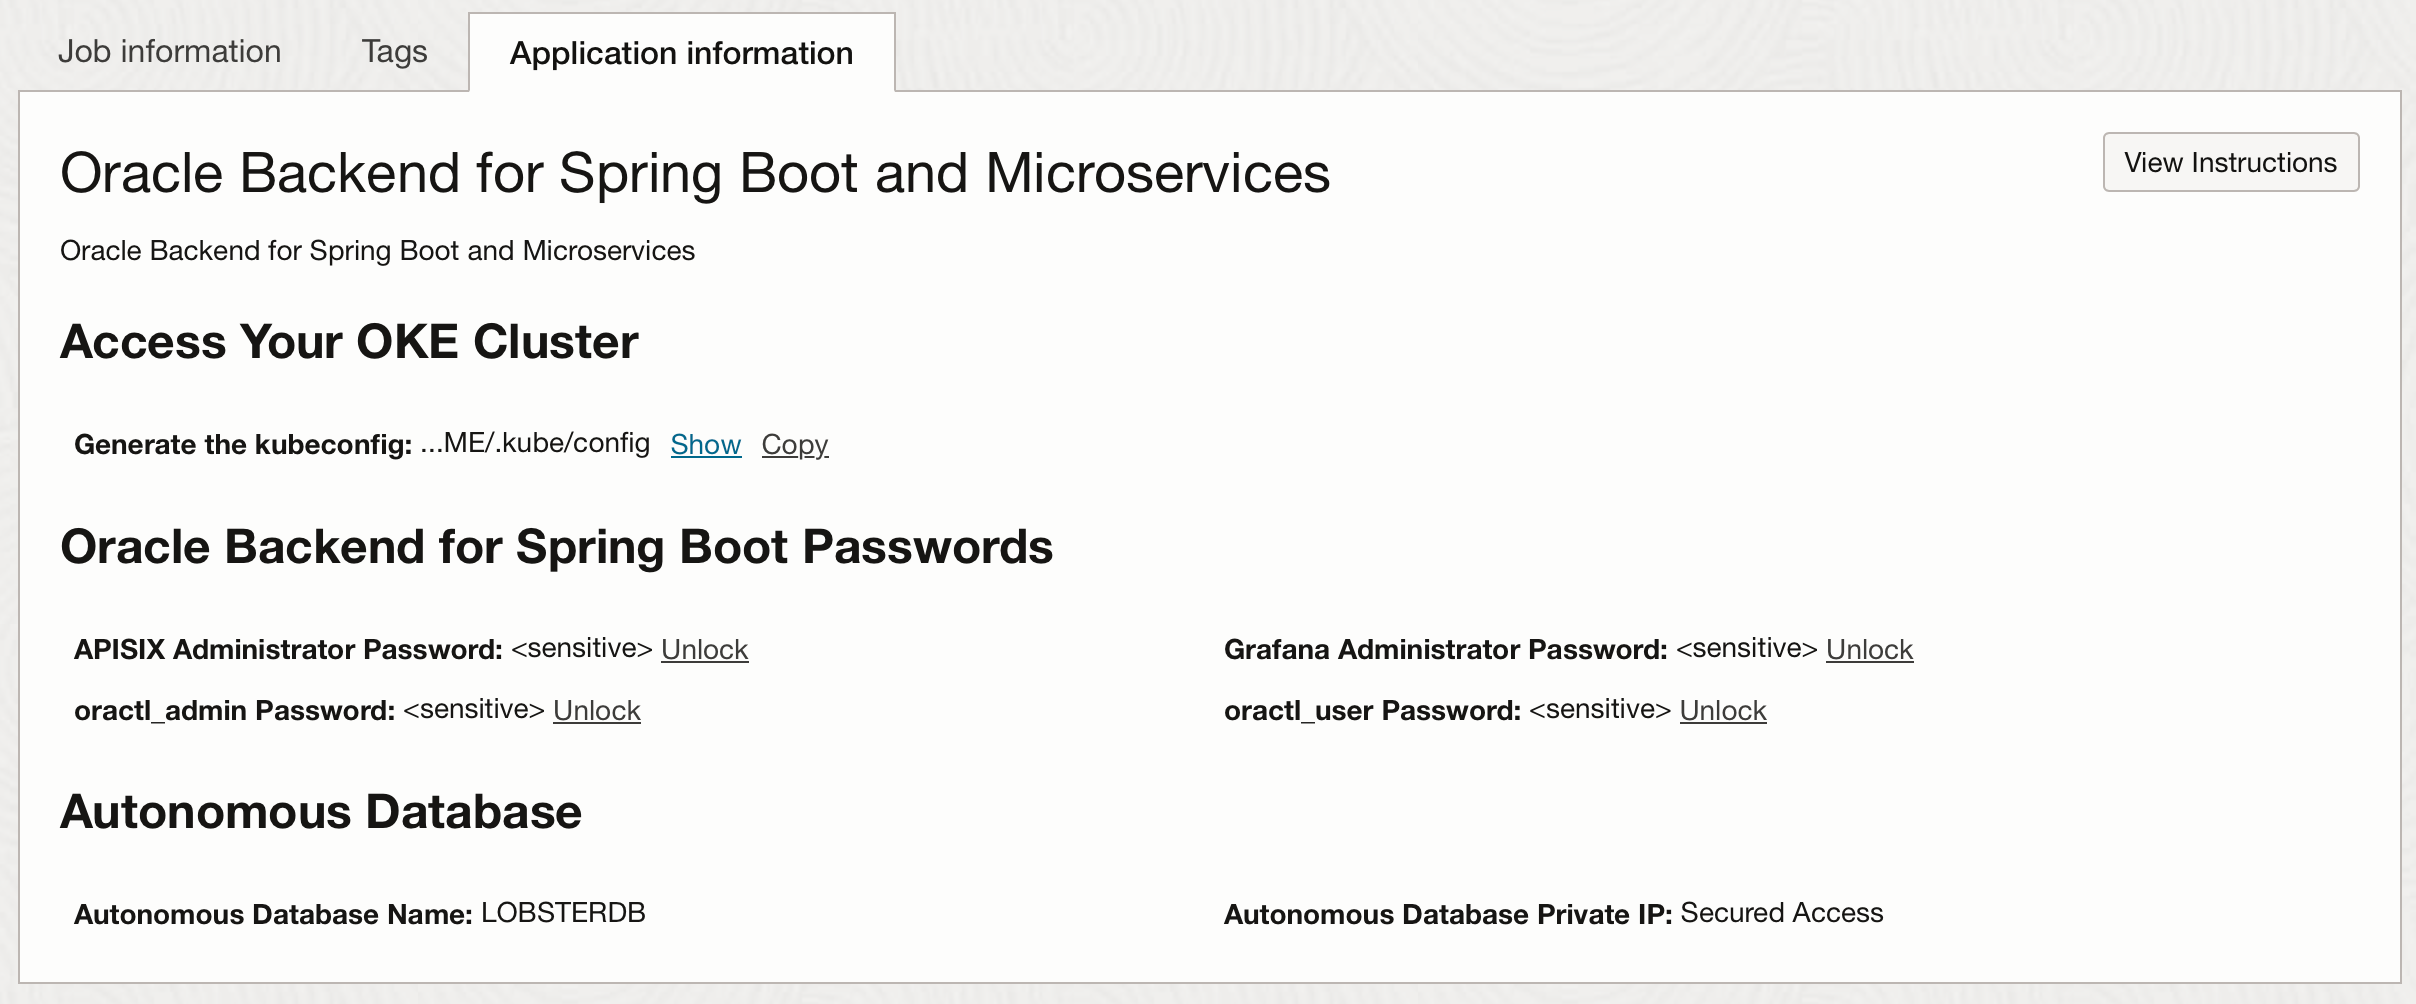
To get the sensitive information you need to click on the Application Information tab, and click on unlock or show to display the values:
Note: Keep a copy of the values, you will need these in later labs.
-
Verify you can access the Kubernetes cluster
In later labs, you will look at various resources in Kubernetes. You will need a Kubernetes configuration file to access the cluster. For now, accessing the cluster from OCI Cloud Shell will be sufficient to verify the installation.
Open the OCI Cloud Shell by clicking on the icon next to the region in the top right corner of the console and then clicking on Cloud Shell.
Run the command provided at the end of your installation log or the information from the Application Information tab,to obtain the Kubernetes configuration file. The command will be similar to this:
oci ce cluster create-kubeconfig --cluster-id ocid1.cluster.oc1.i..... --region us-ashburn-1 --token-version 2.0.0 --kube-endpoint PUBLIC_ENDPOINT --file $HOME/.kube/configCheck that you can access the cluster using this command:
$ kubectl get pods -n obaas-admin
NAME                                READY   STATUS             RESTARTS   AGE
graalvm-compiler-79988b886c-hgw68   1/1     Running            0          10m
obaas-admin-66599b65-vb662          1/1     Running            0          10m
soc-ui-5dbd6f9cb4-kjdj8             0/1     Running            0          10m
Your output will be slightly different, but you should see one pod listed in the output. This is enough to confirm that you have correctly configured access to the Kubernetes cluster.
-
Verify you can connect to the APISIX API Gateway
You will need to provide the correct IP address for the API Gateway in your backend environment. You can find the IP address using this command, you need the one listed in the
EXTERNAL-IPcolumn:$ kubectl -n ingress-nginx get service ingress-nginx-controller NAME TYPE CLUSTER-IP EXTERNAL-IP PORT(S) AGE ingress-nginx-controller LoadBalancer 10.123.10.127 EXTERNAL-IP 80:30389/TCP,443:30458/TCP 13dNow use this command (with your IP address in the column EXTERNAL-IP) to make a request to the API Gateway. You should receive a response with an HTTP Status Code 404 (Not Found) and an error message in JSON format as shown below. Don’t worry about the 404, you will deploy some services soon, but this test is enough to know the API Gateway started up successfully:
$ curl -i http://<EXTERNAL-IP>>
HTTP/1.1 404
Date: Wed, 01 Mar 2023 19:21:08 GMT
Content-Type: application/json
Transfer-Encoding: chunked
Connection: keep-alive
Vary: Origin
Vary: Access-Control-Request-Method
Vary: Access-Control-Request-Headers

{"timestamp":"2023-03-01T19:21:08.031+00:00","status":404,"error":"Not Found","path":"/"}

