Explore Jaeger
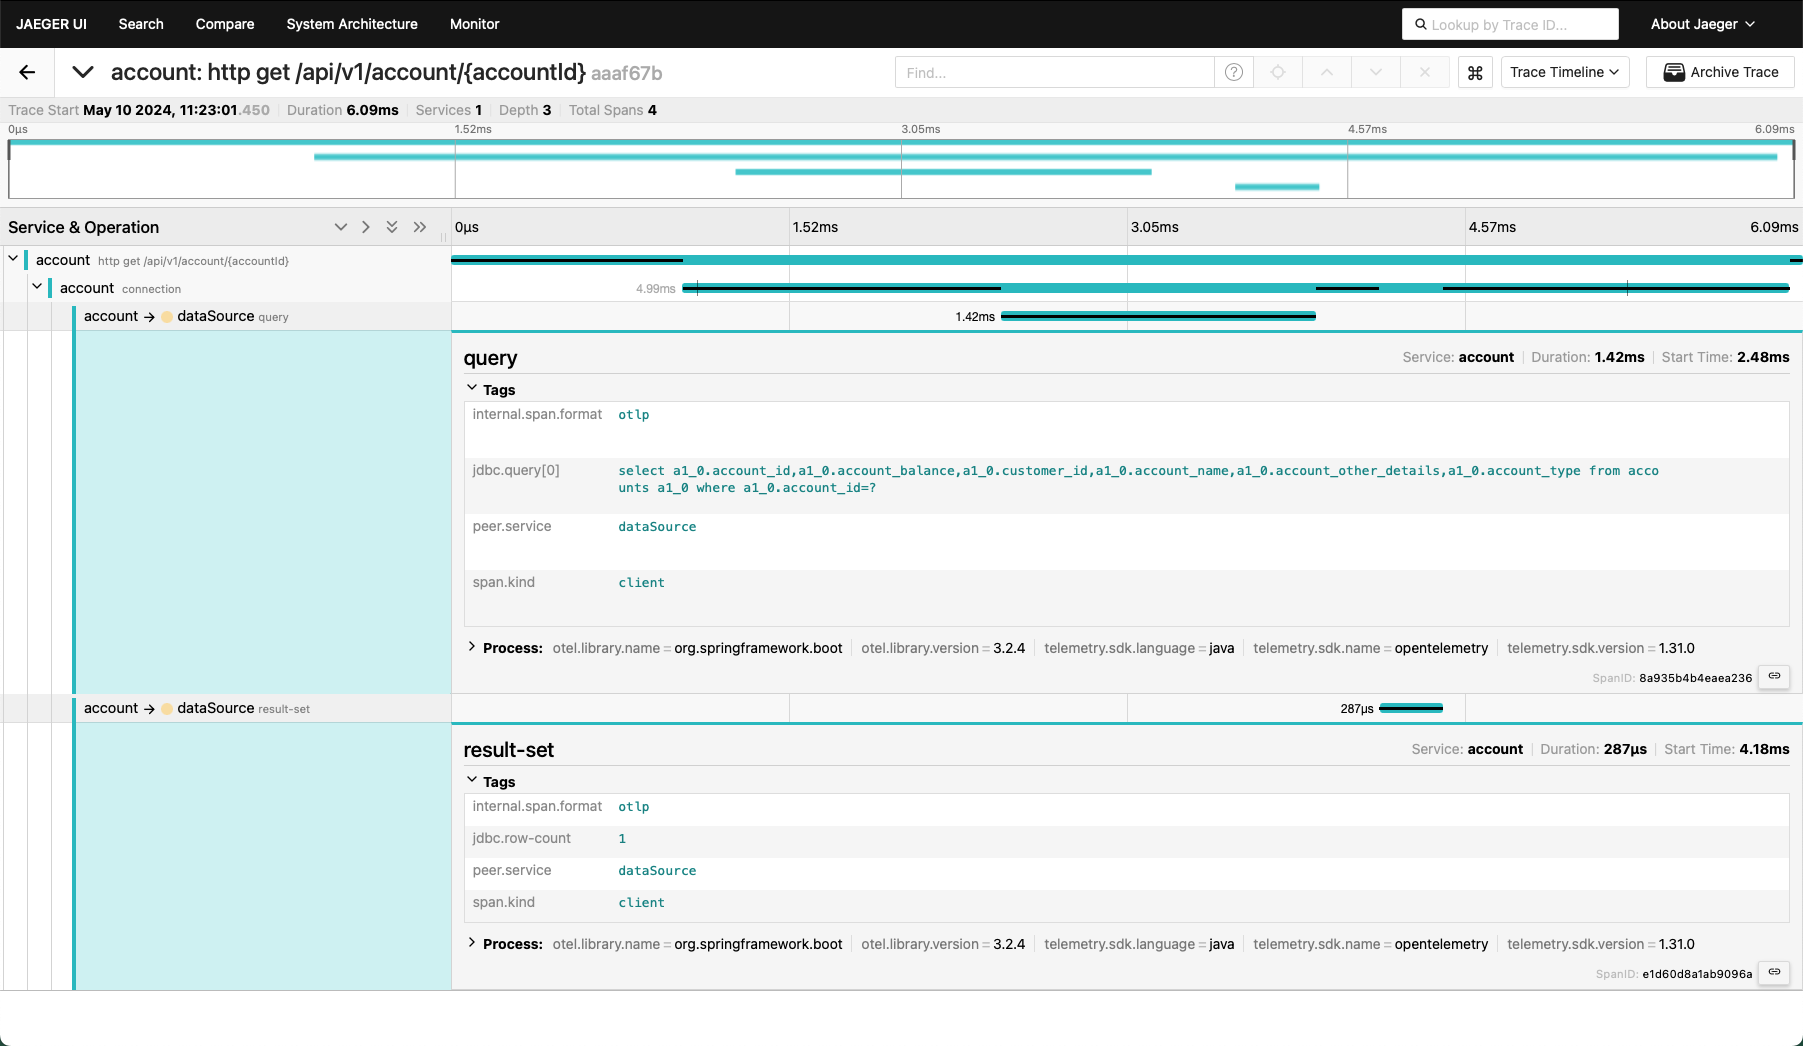
Jaeger provides a way to view the distributed tracing information that is automatically collected by the backend. This allows you to follow requests from the entry point of the platform (the API Gateway) through any number of microservices, including database and messaging operations those services may perform.
-
View a trace
Start the tunnel using this command. You can run this in the background if you prefer.
$ kubectl -n observability port-forward svc/jaegertracing-query 16686Open a web browser to http://localhost:16686 to view the Jaeger web user interface. It will appear similar to the image below.
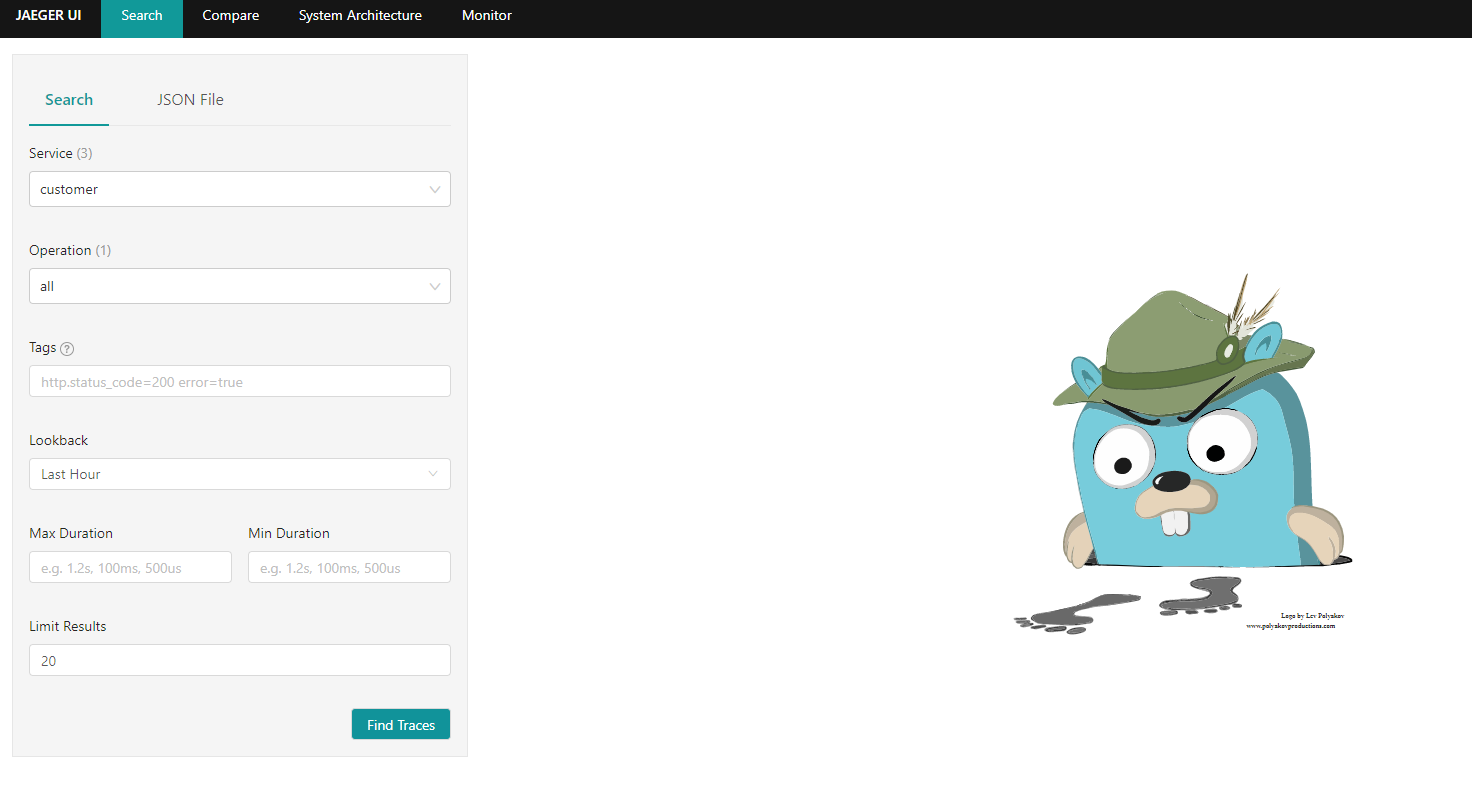
Select one of the Cloudbank services for example
accountand an operation for examplehttp get /api/v1/account/{account}. Click on the Find traces button to find a trace, open any one and explore the details.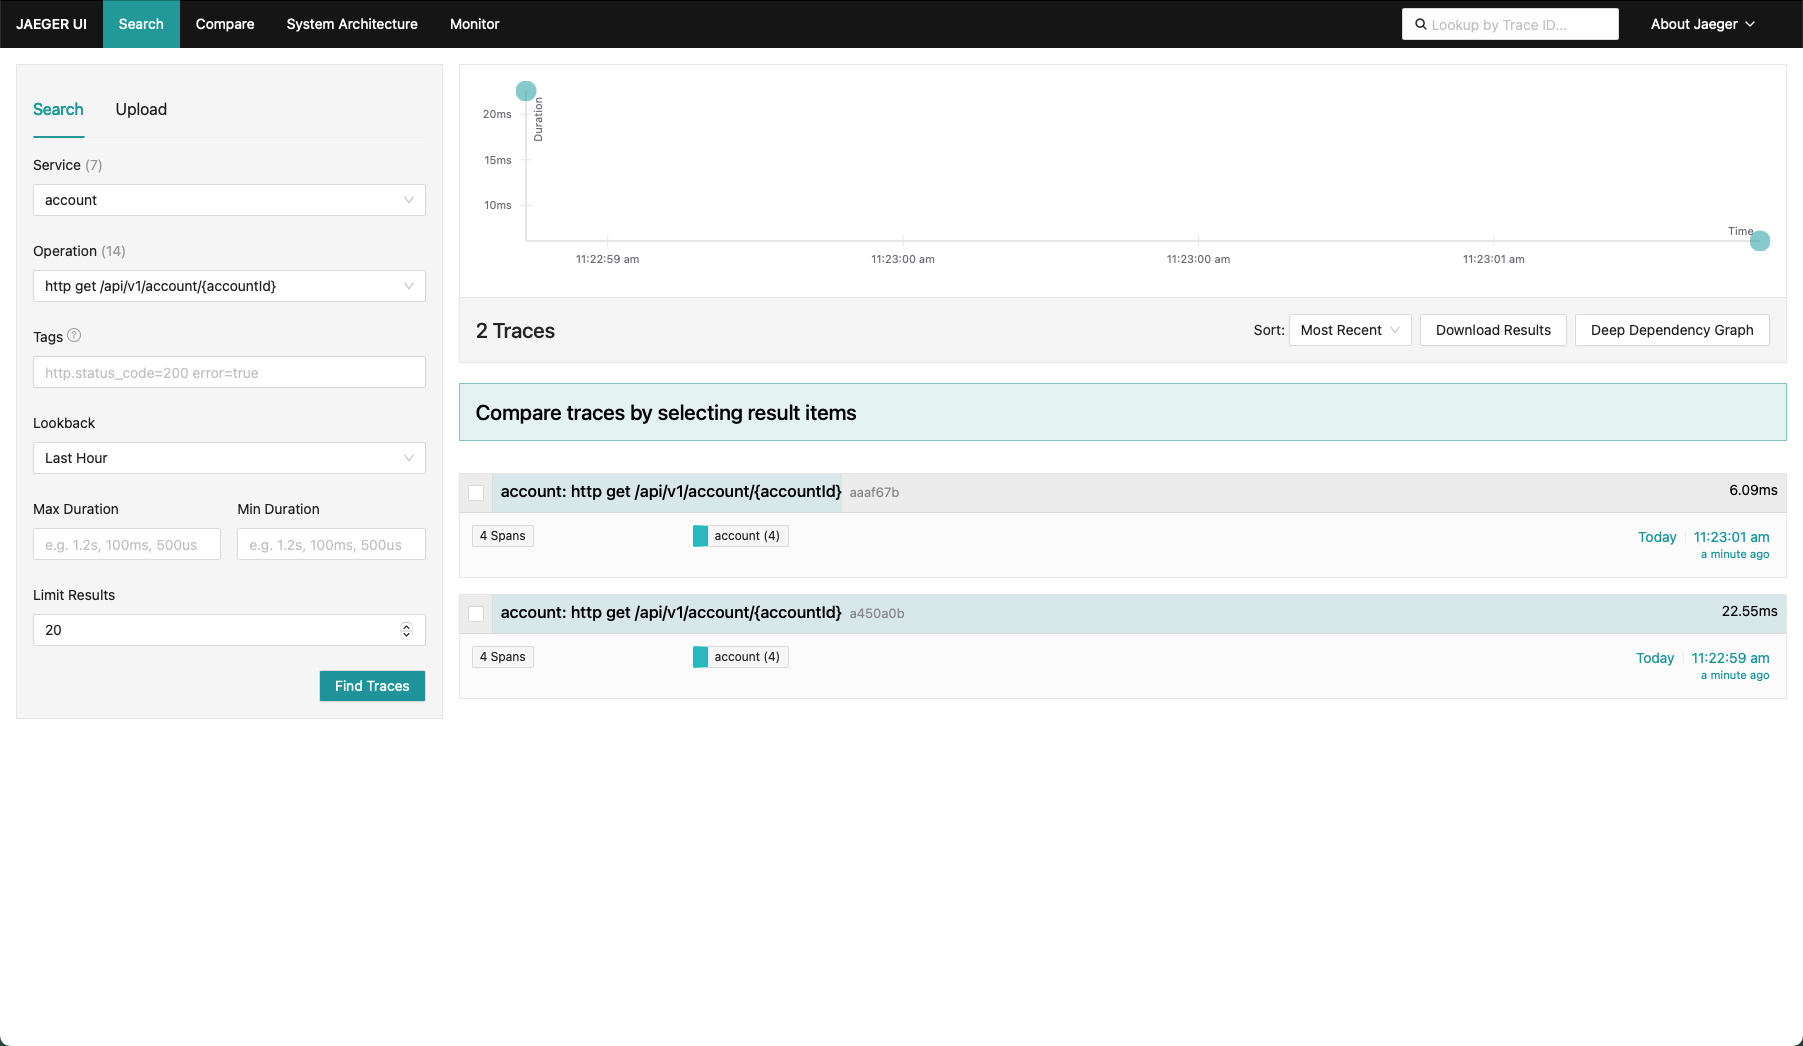
Click on one of the traces to explore the trace.