Elasticsearch integration for logs
1. Integrate Elasticsearch to WebLogic Kubernetes Operator
For reference information, see Elasticsearch integration for the WebLogic Kubernetes Operator.
To enable elasticsearch integration, you must edit file kubernetes/charts/weblogic-operator/values.yaml before deploying the WebLogic Kubernetes Operator.
# elkIntegrationEnabled specifies whether or not ELK integration is enabled.
elkIntegrationEnabled: true

# logStashImage specifies the Docker image containing logstash.
# This parameter is ignored if 'elkIntegrationEnabled' is false.
logStashImage: "logstash:6.6.0"

# elasticSearchHost specifies the hostname of where Elasticsearch is running.
# This parameter is ignored if 'elkIntegrationEnabled' is false.
elasticSearchHost: "elasticsearch.default.svc.cluster.local"

# elasticSearchPort specifies the port number of where Elasticsearch is running.
# This parameter is ignored if 'elkIntegrationEnabled' is false.
elasticSearchPort: 9200
After you’ve deployed WebLogic Kubernetes Operator and made the above changes, the weblogic-operator pod will have additional Logstash container. The Logstash container will push the weblogic-operator logs to the configured Elasticsearch server.
2. Publish WebLogic Server and WebCenter Sites Logs using Logstash Pod
You can publish the WebLogic Server logs to Elasticsearch Server using Logstash pod. This Logstash pod must have access to the
shared domain home. For the WebCenter Sites wcsitesinfra, you can use the persistent volume of the domain home in the Logstash pod.
The steps to create the Logstash pod are as follows:
Sample Logstash configuration file is located at kubernetes/create-wcsites-domain/utils/logstash/logstash.conf
$ vi kubernetes/create-wcsites-domain/utils/logstash/logstash.conf
input {
  file {
    path => "/u01/oracle/user_projects/logs/wcsitesinfra/adminserver.log"
    start_position => beginning
  }
  file {
    path => "/u01/oracle/user_projects/logs/wcsitesinfra/wcsites-server*.log"
    start_position => beginning
  }
  file {
    path => "/u01/oracle/user_projects/logs/wcsitesinfra/adminserver.out"
    start_position => beginning
  }
  file {
    path => "/u01/oracle/user_projects/logs/wcsitesinfra/wcsites-server*.out"
    start_position => beginning
  }
 file {
    path => "/u01/oracle/user_projects/domains/wcsitesinfra/servers/**/logs/sites.log"
    start_position => beginning
  }
 file {
    path => "/u01/oracle/user_projects/domains/wcsitesinfra/servers/**/logs/cas.log"
    start_position => beginning
  }
}
filter {
  grok {
    match => [ "message", "<%{DATA:log_timestamp}> <%{WORD:log_level}> <%{WORD:thread}> <%{HOSTNAME:hostname}> <%{HOSTNAME:servername}> <%{DATA:timer}> <<%{DATA:kernel}>> <> <%{DATA:uuid}> <%{NUMBER:timestamp}> <%{DATA:misc}> <%{DATA:log_number}> <%{DATA:log_message}>" ]
  }
}
output {
  elasticsearch {
    hosts => ["elasticsearch.default.svc.cluster.local:9200"]
  }
}
Here ** means that all sites.log and cas.log from any servers under wcsitesinfra will be pushed to Logstash.
$ kubectl cp kubernetes/create-wcsites-domain/utils/logstash/logstash.conf wcsites-ns/wcsitesinfra-adminserver:/u01/oracle/user_projects/logs/logstash.conf
Get the persistent volume details of the domain home of the WebLogic Server(s). The following command will list the persistent volume details in the namespace - “wcsites-ns”:
$ kubectl get pv -n wcsites-ns
NAME                    CAPACITY   ACCESS MODES   RECLAIM POLICY   STATUS   CLAIM                               STORAGECLASS                       REASON   AGE
wcsitesinfra-domain-pv   10Gi       RWX            Retain           Bound    wcsites-ns/wcsitesinfra-domain-pvc   wcsitesinfra-domain-storage-class            5d21h
Sample Logstash deployment is located at kubernetes/create-wcsites-domain/utils/logstash/logstash.yaml for Logstash pod. The mounted persistent volume of the domain home will provide access to the WebLogic Server logs to Logstash pod.
apiVersion: apps/v1beta1
kind: Deployment
metadata:
  name: logstash-wls
  namespace: wcsites-ns
spec:
  template: # create pods using pod definition in this template
    metadata:
      labels:
        k8s-app: logstash-wls
    spec:
      volumes:
      - name: weblogic-domain-storage-volume
        persistentVolumeClaim:
          claimName: wcsitesinfra-domain-pvc
      - name: shared-logs
        emptyDir: {}
      containers:
      - name: logstash
        image: logstash:6.6.0
        command: ["/bin/sh"]
        args: ["/usr/share/logstash/bin/logstash", "-f", "/u01/oracle/user_projects/logs/logstash.conf"]
        imagePullPolicy: IfNotPresent
        volumeMounts:
        - mountPath: /u01/oracle/user_projects
          name: weblogic-domain-storage-volume
        - name: shared-logs
          mountPath: /shared-logs
        ports:
        - containerPort: 5044
          name: logstash
After you have created the Logstash deployment yaml and Logstash configuration file, deploy Logstash using following command:
$ kubectl create -f kubernetes/create-wcsites-domain/utils/logstash/logstash.yaml
3. Test the Deployment of Elasticsearch and Kibana
The WebLogic Operator also provides a sample deployment of Elasticsearch and Kibana for testing purpose. You can deploy Elasticsearch and Kibana on the Kubernetes cluster as shown below:
$ kubectl create -f kubernetes/elasticsearch-and-kibana/elasticsearch_and_kibana.yaml
Get the Kibana dashboard port information as shown below:
Wait for pods to start:
-bash-4.2$ kubectl get pods -w
NAME                            READY   STATUS    RESTARTS   AGE
elasticsearch-8bdb7cf54-mjs6s   1/1     Running   0          4m3s
kibana-dbf8964b6-n8rcj          1/1     Running   0          4m3s
-bash-4.2$ kubectl get svc
NAME            TYPE        CLUSTER-IP      EXTERNAL-IP   PORT(S)             AGE
elasticsearch   ClusterIP   10.100.11.154   <none>        9200/TCP,9300/TCP   4m32s
kibana          NodePort    10.97.205.0     <none>        5601:31884/TCP      4m32s
kubernetes      ClusterIP   10.96.0.1       <none>        443/TCP             71d
You can access the Kibana dashboard at http://mycompany.com:kibana-nodeport/. In our example, the node port would be 31884.
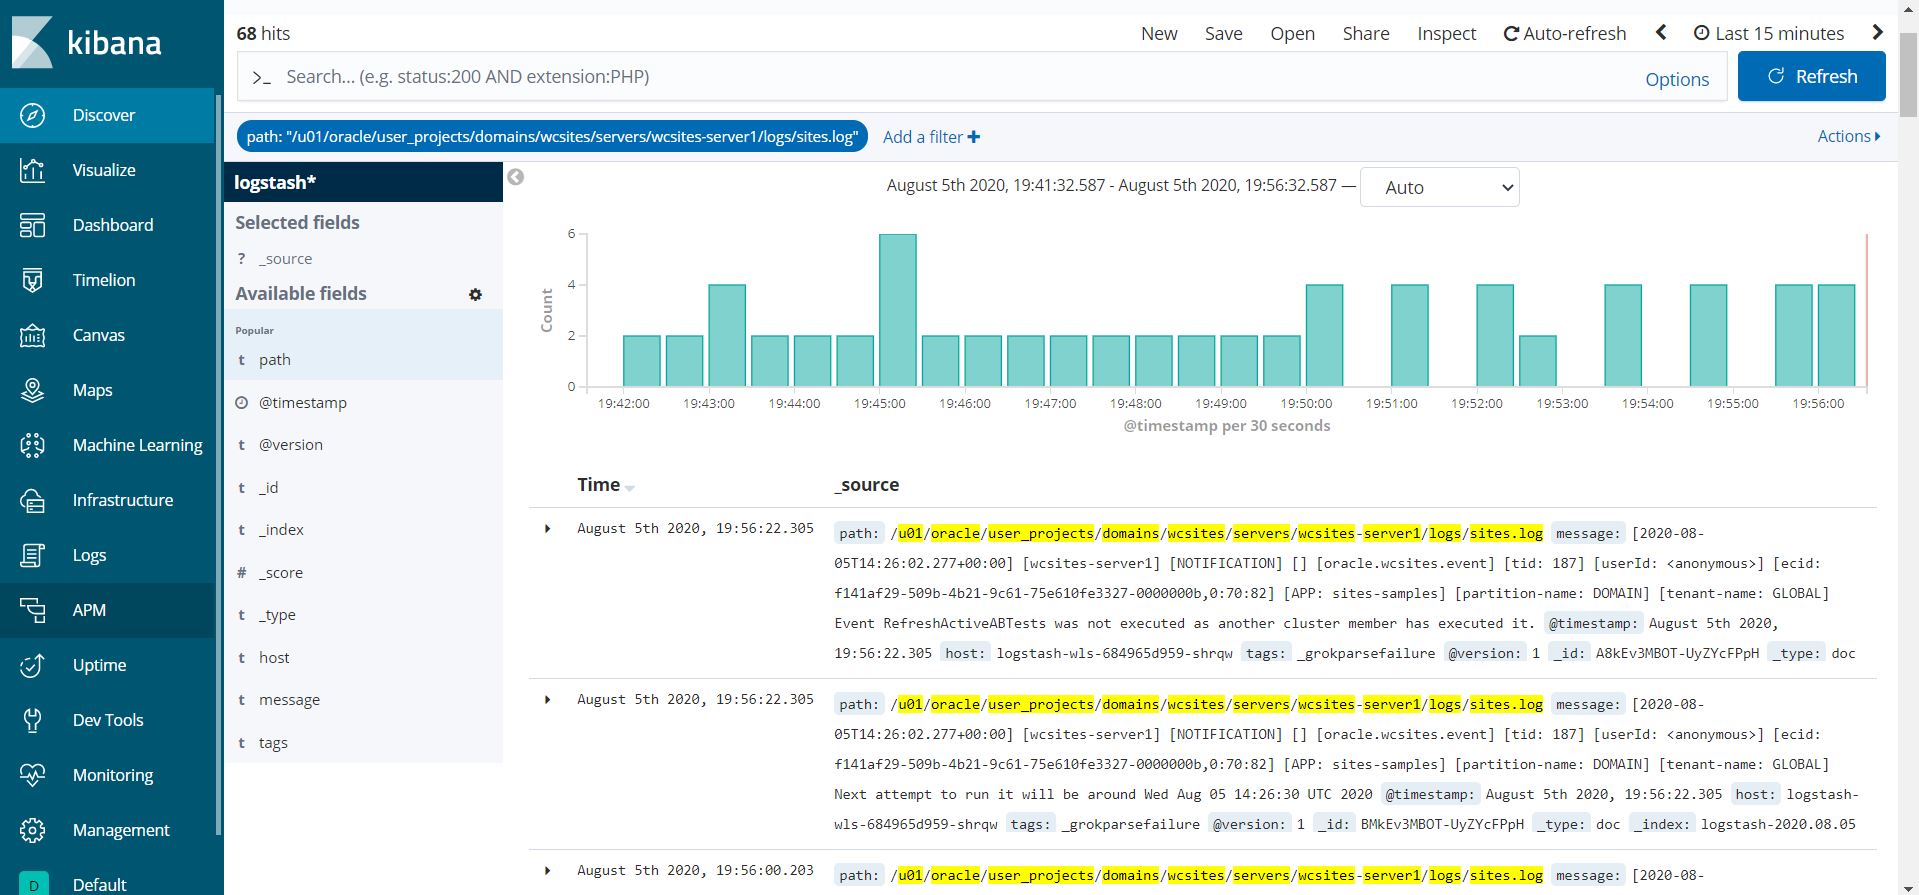
Create an Index Pattern in Kibana
Create an index pattern logstash* in Kibana > Management. After the servers are started, you will see the log data in the Kibana dashboard: