Monitor a WebCenter Portal domain
You can monitor a WebCenter Portal domain using Prometheus and Grafana by exporting the metrics from the domain instance using the WebLogic Monitoring Exporter. This sample shows you how to set up the WebLogic Monitoring Exporter to push the data to Prometheus.
Prerequisites
This document assumes that the Prometheus Operator is deployed on the Kubernetes cluster. If it is not already deployed, follow the steps below for deploying the Prometheus Operator.
Prepare to use the setup monitoring script
The sample scripts for setup monitoring for OracleWebCenterPortal domain are available at ${WORKDIR}/monitoring-service.
You must edit monitoring-inputs.yaml(or a copy of it) to provide the details of your domain. Refer to the configuration parameters below to understand the information that you must provide in this file.
Configuration parameters
The following parameters can be provided in the inputs file.
| Parameter | Description | Default |
|---|---|---|
domainUID |
domainUID of the OracleWebCenterPortal domain. | wcp-domain |
domainNamespace |
Kubernetes namespace of the OracleWebCenterPortal domain. | wcpns |
setupKubePrometheusStack |
Boolean value indicating whether kube-prometheus-stack (Prometheus, Grafana and Alertmanager) to be installed | true |
additionalParamForKubePrometheusStack |
The script install’s kube-prometheus-stack with service.type as NodePort and values for service.nodePort as per the parameters defined in monitoring-inputs.yaml. Use additionalParamForKubePrometheusStack parameter to further configure with additional parameters as per values.yaml. Sample value to disable NodeExporter, Prometheus-Operator TLS support and Admission webhook support for PrometheusRules resources is --set nodeExporter.enabled=false --set prometheusOperator.tls.enabled=false --set prometheusOperator.admissionWebhooks.enabled=false |
|
monitoringNamespace |
Kubernetes namespace for monitoring setup. | monitoring |
adminServerName |
Name of the Administration Server. | AdminServer |
adminServerPort |
Port number for the Administration Server inside the Kubernetes cluster. | 7001 |
wcpClusterName |
Name of the wcpCluster. | wcp_cluster |
wcpManagedServerPort |
Port number of the managed servers in the wcpCluster. | 8888 |
wlsMonitoringExporterTowcpCluster |
Boolean value indicating whether to deploy WebLogic Monitoring Exporter to wcpCluster. | false |
wcpPortletClusterName |
Name of the wcpPortletCluster. | wcportlet-cluster |
wcpManagedServerPort |
Port number of the Portlet managed servers in the wcpPortletCluster. | 8889 |
wlsMonitoringExporterTowcpPortletCluster |
Boolean value indicating whether to deploy WebLogic Monitoring Exporter to wcpPortletCluster. | false |
exposeMonitoringNodePort |
Boolean value indicating if the Monitoring Services (Prometheus, Grafana and Alertmanager) is exposed outside of the Kubernetes cluster. | false |
prometheusNodePort |
Port number of the Prometheus outside the Kubernetes cluster. | 32101 |
grafanaNodePort |
Port number of the Grafana outside the Kubernetes cluster. | 32100 |
alertmanagerNodePort |
Port number of the Alertmanager outside the Kubernetes cluster. | 32102 |
weblogicCredentialsSecretName |
Name of the Kubernetes secret which has Administration Server’s user name and password. | wcp-domain-domain-credentials |
Note that the values specified in the monitoring-inputs.yaml file will be used to install kube-prometheus-stack (Prometheus, Grafana and Alertmanager) and deploying WebLogic Monitoring Exporter into the OracleWebCenterPortal domain. Hence make the domain specific values to be same as that used during domain creation.
Run the setup monitoring script
Update the values in monitoring-inputs.yaml as per your requirement and run the setup-monitoring.sh script, specifying your inputs file:
$ cd ${WORKDIR}/monitoring-service
$ ./setup-monitoring.sh \
  -i monitoring-inputs.yaml
The script will perform the following steps:
- Helm install
prometheus-community/kube-prometheus-stackof version “16.5.0” ifsetupKubePrometheusStackis set totrue. - Deploys WebLogic Monitoring Exporter to Administration Server.
- Deploys WebLogic Monitoring Exporter to
wcpClusterifwlsMonitoringExporterTowcpClusteris set totrue. - Deploys WebLogic Monitoring Exporter to
wcpPortletClusterifwlsMonitoringExporterTowcpPortletClusteris set totrue. - Exposes the Monitoring Services (Prometheus at
32101, Grafana at32100and Alertmanager at32102) outside of the Kubernetes cluster ifexposeMonitoringNodePortis set totrue. - Imports the WebLogic Server Grafana Dashboard if
setupKubePrometheusStackis set totrue.
Verify the results
The setup monitoring script will report failure if there was any error. However, verify that required resources were created by the script.
Verify the kube-prometheus-stack
To confirm that prometheus-community/kube-prometheus-stack was installed when setupKubePrometheusStack is set to true, run the following command:
$ helm ls -n monitoring
Sample output:
$ helm ls -n monitoring
NAME            NAMESPACE       REVISION        UPDATED                                 STATUS          CHART                           APP VERSION
monitoring      monitoring      1               2021-06-18 12:58:35.177221969 +0000 UTC deployed        kube-prometheus-stack-16.5.0    0.48.0
$
Verify the Prometheus, Grafana and Alertmanager setup
When exposeMonitoringNodePort was set to true, verify that monitoring services are accessible outside of the Kubernetes cluster:
32100is the external port for Grafana and with credentialsadmin:admin32101is the external port for Prometheus32102is the external port for Alertmanager
Verify the service discovery of WebLogic Monitoring Exporter
Verify whether prometheus is able to discover wls-exporter and collect the metrics:
-
Access the Prometheus dashboard at http://mycompany.com:32101/
-
Navigate to Status to see the Service Discovery details.
-
Verify that wls-exporter is listed in the discovered services.
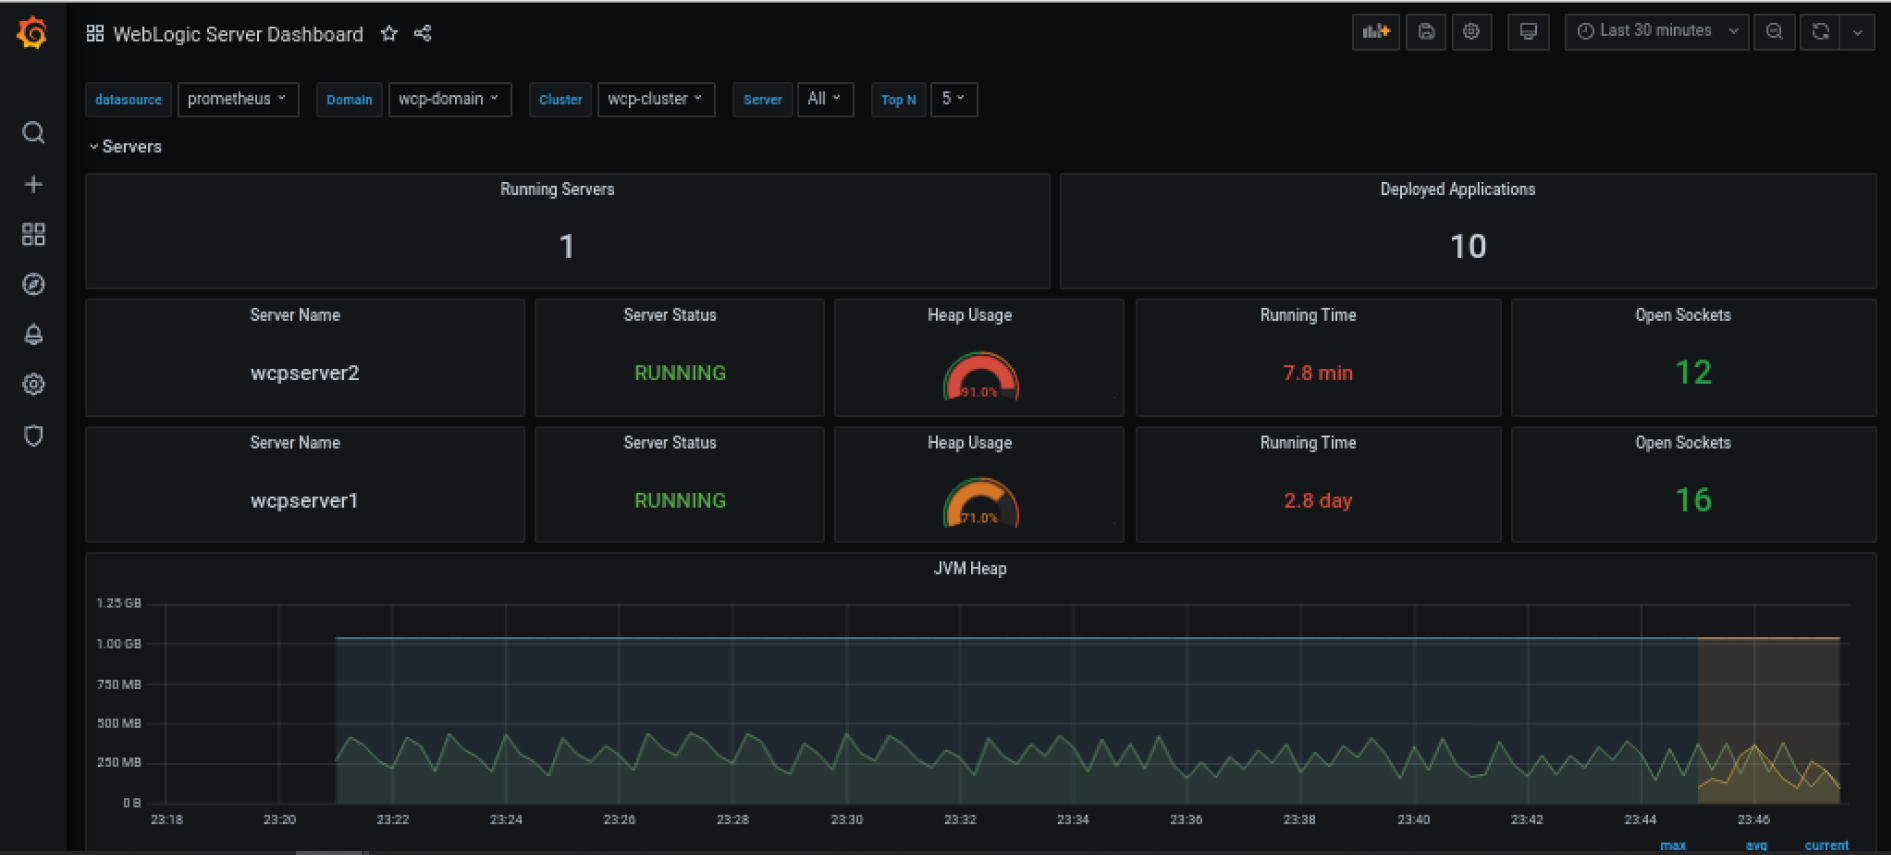
Verify the WebLogic Server dashoard
You can access the Grafana dashboard at http://mycompany.com:32100/.
-
Log in to Grafana dashboard with username:
adminand password:admin. -
Navigate to “WebLogic Server Dashboard” under General and verify.
This displays the WebLogic Server Dashboard.
Delete the monitoring setup
To delete the monitoring setup created by Run the setup monitoring script, run the below command:
$ cd ${WORKDIR}/monitoring-service
$ ./delete-monitoring.sh \
  -i monitoring-inputs.yaml