Publish logs to Elasticsearch
The WebLogic Logging Exporter adds a log event handler to WebLogic Server. WebLogic Server logs can be pushed to Elasticsearch in Kubernetes directly by using the Elasticsearch REST API. For more details, see to the WebLogic Logging Exporter project.
This sample shows you how to publish WebLogic Server logs to Elasticsearch and view them in Kibana. For publishing WebLogic Kubernetes Operator logs, see this sample.
Prerequisites
This document assumes that you have already set up Elasticsearch and Kibana for logs collection. If you have not, please see this document.
Download the WebLogic Logging Exporter binaries
The pre-built binaries are available on the WebLogic Logging Exporter Releases page.
Download:
- weblogic-logging-exporter-1.0.1.jar from the Releases page.
- snakeyaml-1.27.jar from Maven Central.
$ wget https://github.com/oracle/weblogic-logging-exporter/releases/download/v1.0.1/weblogic-logging-exporter.jar
$ wget -O snakeyaml-1.27.jar https://search.maven.org/remotecontent?filepath=org/yaml/snakeyaml/1.27/snakeyaml-1.27.jar
These identifiers are used in the sample commands in this document.
wccns: WebCenter Content domain namespacewccinfra:domainUIDwccinfra-adminserver: Administration Server pod name
Copy the JAR Files to the WebLogic Domain Home
Copy the weblogic-logging-exporter.jar and snakeyaml-1.27.jar files to the domain home directory in the Administration Server pod.
$ kubectl cp <file-to-copy> <namespace>/<administration-server-pod>:<domainhome>
$ kubectl cp weblogic-logging-exporter.jar wccns/wccinfra-adminserver:/u01/oracle/user_projects/domains/wccinfra/

$ kubectl cp snakeyaml-1.27.jar wccns/wccinfra-adminserver:/u01/oracle/user_projects/domains/wccinfra/
Add a Startup Class to the Domain Configuration
In this step, we configure weblogic-logging-exporter JAR as a startup class in the WebLogic servers where we intend to collect the logs.
-
In the WebLogic Server Administration Console, in the left navigation pane, expand Environment, and then select Startup and Shutdown Classes.
-
Add a new startup class. You may choose any descriptive name, however, the class name must be
weblogic.logging.exporter.Startup.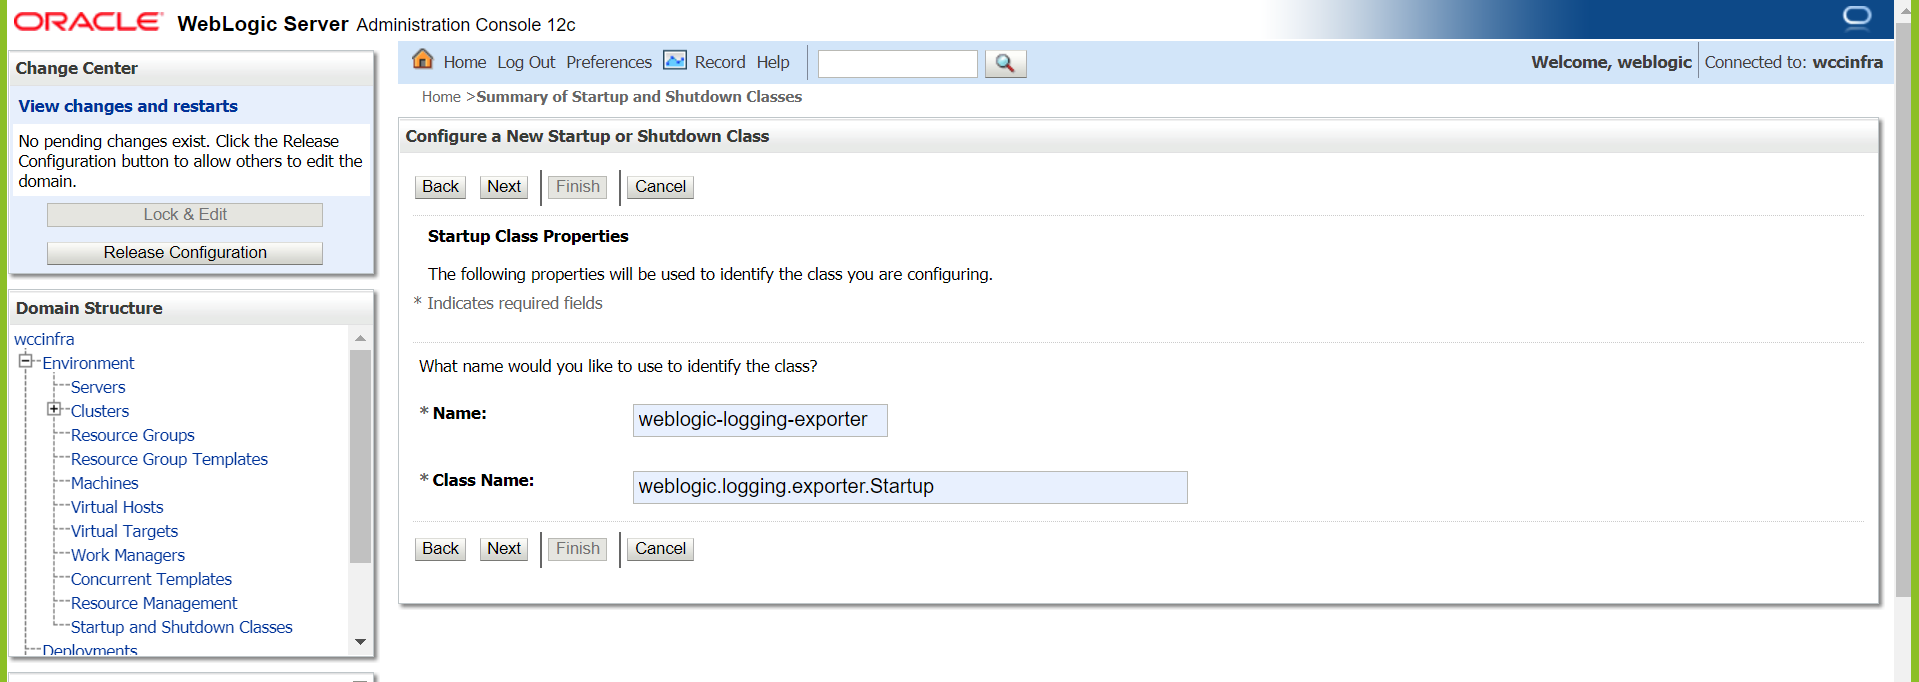
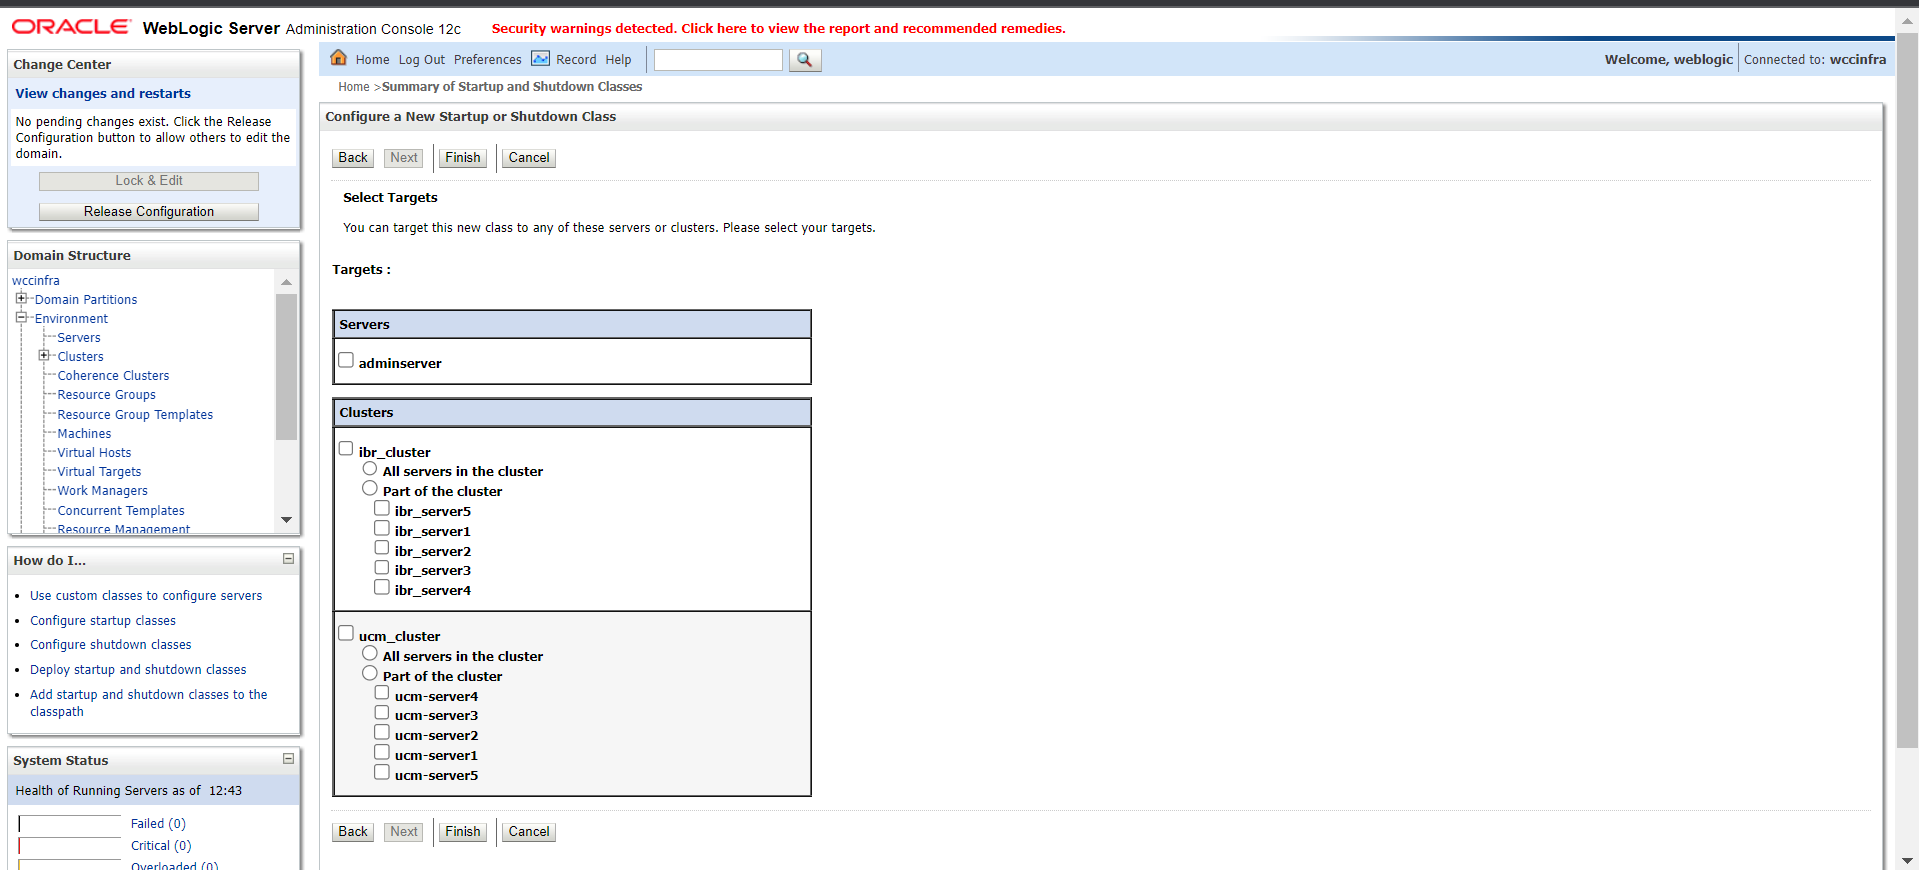
-
Target the startup class to each server from which you want to export logs.
-
You can verify this by checking for the update in your config.xml file(
/u01/oracle/user_projects/domains/wccinfra/config/config.xml) which should be similar to this example:$ kubectl exec -n wccns -it wccinfra-adminserver cat /u01/oracle/user_projects/domains/wccinfra/config/config.xml<startup-class> <name>weblogic-logging-exporter</name> <target>adminServer,ucm_cluster,ibr_cluster,ipm_cluster,capture_cluster,wccadf_cluster</target> <class-name>weblogic.logging.exporter.Startup</class-name> </startup-class>
Update the WebLogic Server CLASSPATH
-
Copy the
setDomainEnv.shfile from the pod to a local folder:$ kubectl cp wccns/wccinfra-adminserver:/u01/oracle/user_projects/domains/wccinfra/bin/setDomainEnv.sh $PWD/setDomainEnv.shIgnore exception:
tar: Removing leading '/' from member names -
Modify
setDomainEnv.shto update the Server Class path, add below code at the end of file:CLASSPATH=/u01/oracle/user_projects/domains/wccinfra/weblogic-logging-exporter.jar:/u01/oracle/user_projects/domains/wccinfra/snakeyaml-1.27.jar:${CLASSPATH} export CLASSPATH -
Copy back the modified
setDomainEnv.shfile to the pod:$ kubectl cp setDomainEnv.sh wccns/wccinfra-adminserver:/u01/oracle/user_projects/domains/wccinfra/bin/setDomainEnv.sh``
Create a Configuration File for the WebLogic Logging Exporter
In this step, we will be creating the configuration file for weblogic-logging-exporter.
-
Specify the Elasticsearch server host and port number in file
$WORKDIR/logging-services/weblogic-logging-exporter/WebLogicLoggingExporter.yaml:Sample:
weblogicLoggingIndexName: wls publishHost: elasticsearch.default.svc.cluster.local publishPort: 9200 domainUID: wccinfra weblogicLoggingExporterEnabled: true weblogicLoggingExporterSeverity: Notice weblogicLoggingExporterBulkSize: 1 weblogicLoggingExporterFilters: - FilterExpression: NOT(MSGID = 'BEA-000449') -
Copy the
WebLogicLoggingExporter.yamlfile to the domain home directory in the WebLogic Administration Server pod:$ kubectl cp ${WORKDIR}/logging-services/weblogic-logging-exporter/WebLogicLoggingExporter.yaml wccns/wccinfra-adminserver:/u01/oracle/user_projects/domains/wccinfra/config/
Restart All the Servers in the Domain
To restart the servers, stop and then start them using the following commands:
To STOP the servers:
$ kubectl patch domain wccinfra -n wccns --type='json' -p='[{"op": "replace", "path": "/spec/serverStartPolicy", "value": "NEVER" }]'
To START the servers:
$ kubectl patch domain wccinfra -n wccns --type='json' -p='[{"op": "replace", "path": "/spec/serverStartPolicy", "value": "IF_NEEDED" }]'
After all the servers are restarted, see their server logs to check that the weblogic-logging-exporter class is called, as shown below:
======================= Weblogic Logging Exporter Startup class called
================== Reading configuration from file name: /u01/oracle/user_projects/domains/wccinfra/config/WebLogicLoggingExporter.yaml

Config{weblogicLoggingIndexName='wls', publishHost='elasticsearch.default.svc.cluster.local', publishPort=9200, weblogicLoggingExporterSeverity='Notice', weblogicLoggingExporterBulkSize='1', enabled=true, weblogicLoggingExporterFilters=[
FilterConfig{expression='NOT(MSGID = 'BEA-000449')', servers=[]}], domainUID='wccinfra'}
====================== WebLogic Logging Exporter is ebled
================= publishHost in initialize: elasticsearch.default.svc.cluster.local
================= publishPort in initialize: 9200
================= url in executePutOrPostOnUrl: http://elasticsearch.default.svc.cluster.local:9200/wls
Create an Index Pattern in Kibana
Create an appropriate index pattern in Kibana > Management. After the servers are started, you will see the log data in the Kibana dashboard.