Apache APISIX Gateway
Apache APISIX is an open source cloud native API platform that supports the full lifecycle of API management including publishing, traffic management, deployment strategies, and circuit breakers.
Oracle Backend for Microservices and AI deploys Apache APISIX Gateway and Dashboard in the apisix namespace. The gateway is exposed through the external load balancer and ingress controller. To access the Apache APISIX Dashboard, you must use the kubectl port-forward command to create a secure channel to service/apisix-dashboard. Process the following steps:
-
To expose the Apache APISIX Dashboard using this command:
kubectl port-forward -n apisix svc/apisix-dashboard 8080:80 -
Open the Apache APISIX Dashboard URL: http://localhost:8080
- username:
admin - Password is retrieved using the following command:
kubectl get secret -n apisix apisix-dashboard -o jsonpath='{.data.conf\.yaml}' | base64 -d | grep 'password:'; echoNOTE: Oracle recommends that you change the default password when you log in the first time. Even though the dashboard is not accessible externally, Oracle still recommends using strong passwords to maximize security.
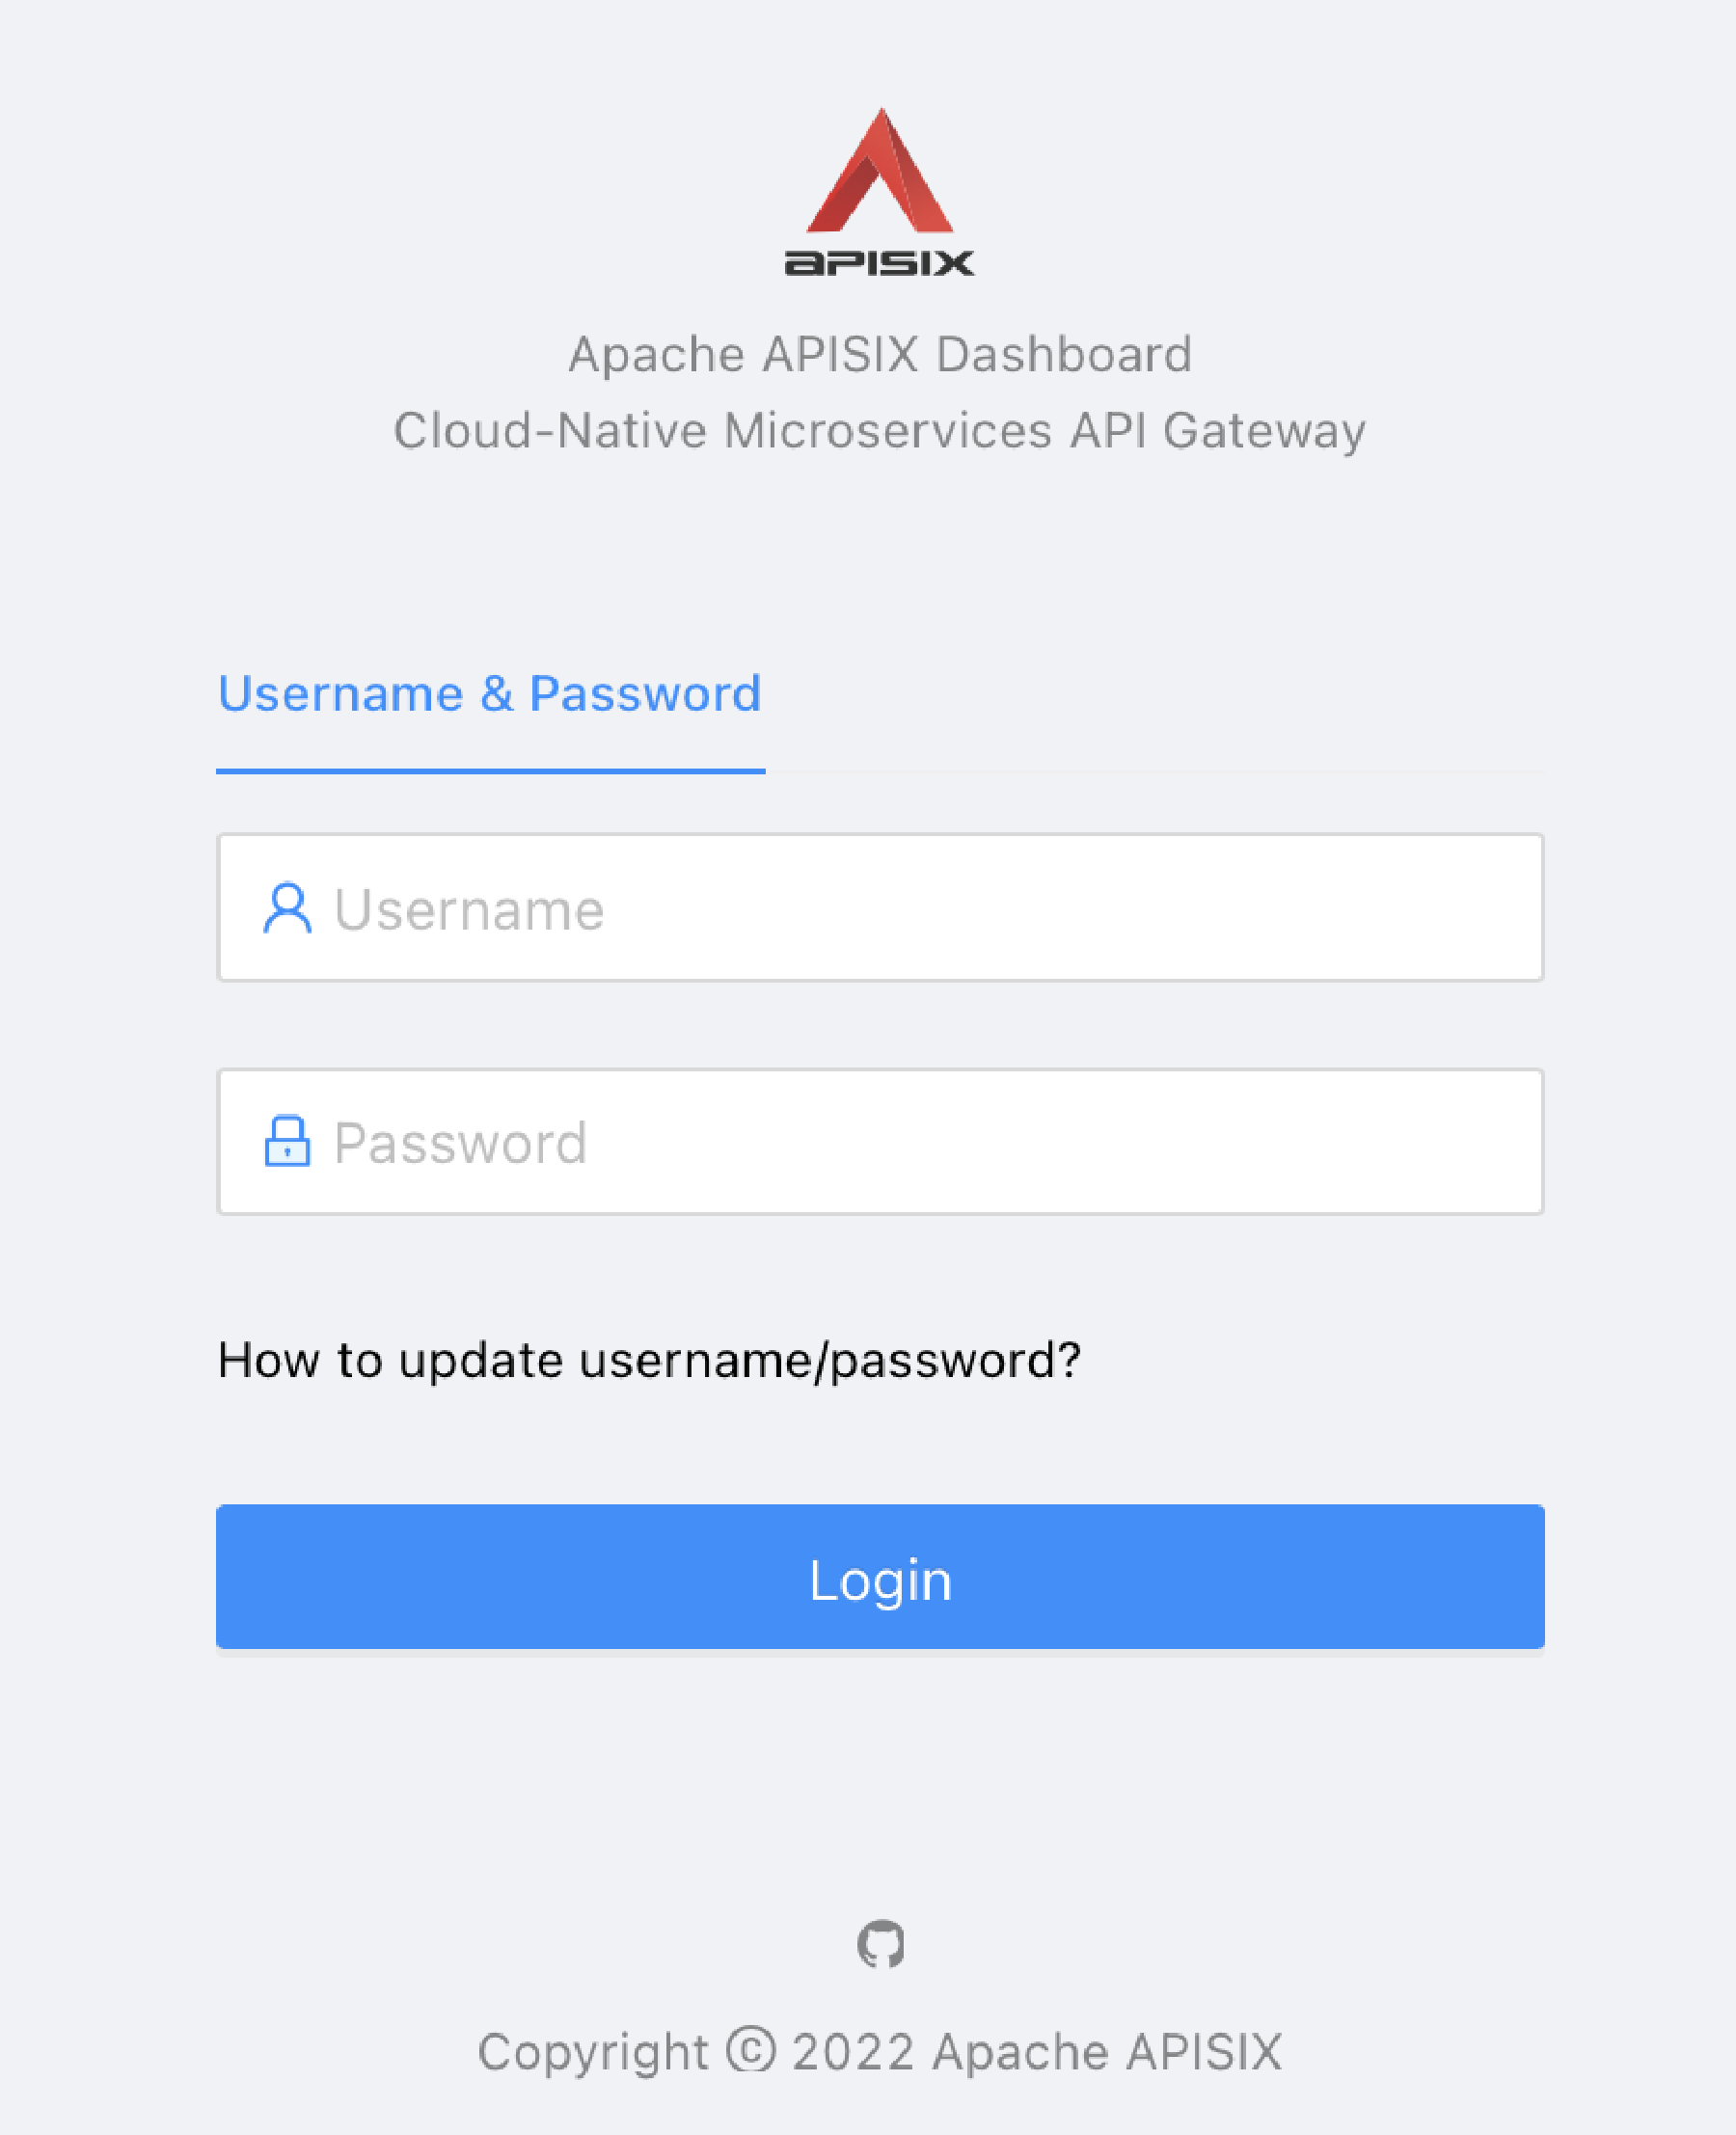
APISIX Login - username:

The OpenTelemetry plugin is enabled by default in APISIX. To enable tracing for your routes add the following to the route configuration:
"plugins": {
    "opentelemetry": {
        "sampler": {
            "name": "always_on"
        }
    }
}
For more configuration option for the OpenTelemetry plugin; APISIX Documentation
Once you have your application deployed and running, you may want to expose it to the outside world. Some applications may not need to be exposed if they are only called by other applications in the platform. To expose your application, create a “route” in the Apache APISIX API Gateway by processing these steps:
-
Create a route to the service. For example:
- In the Apache APISIX Dashboard, click Routes in the menu on the left side.
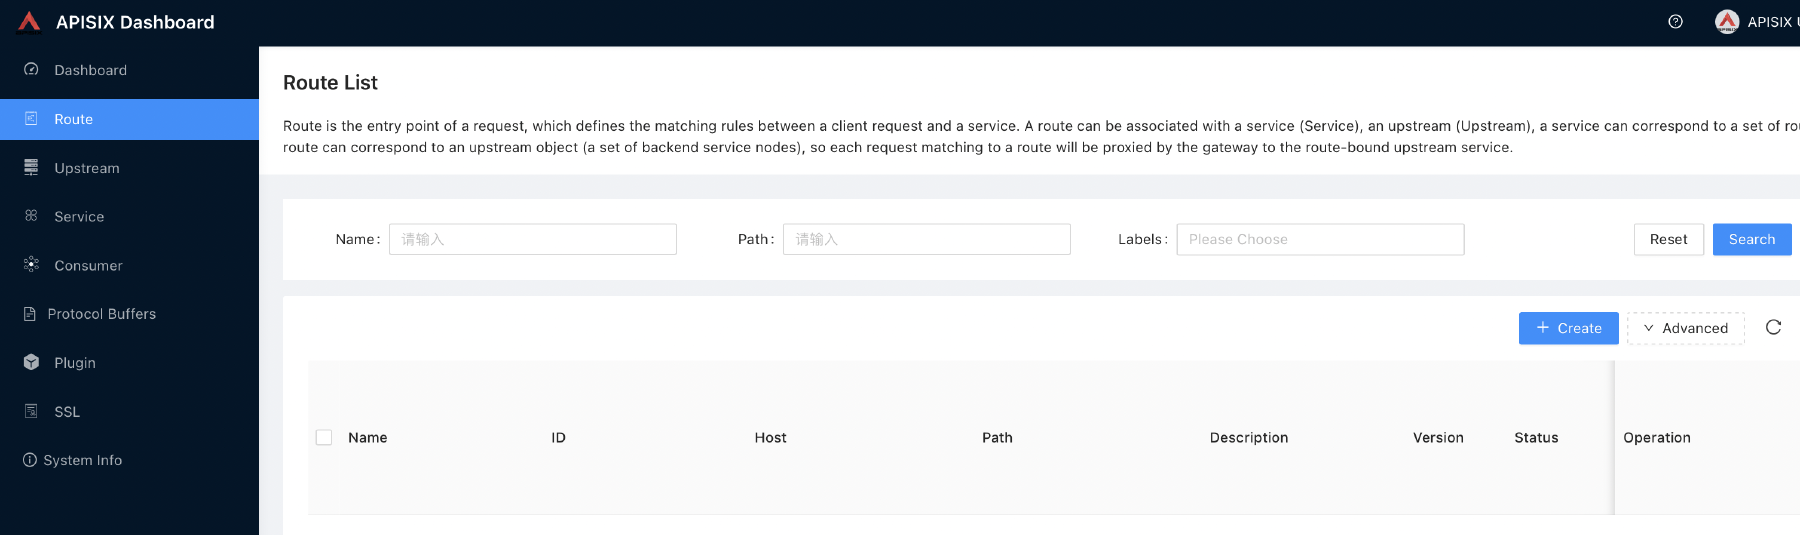
APISIX Routes -
Click Create to create a new route.
-
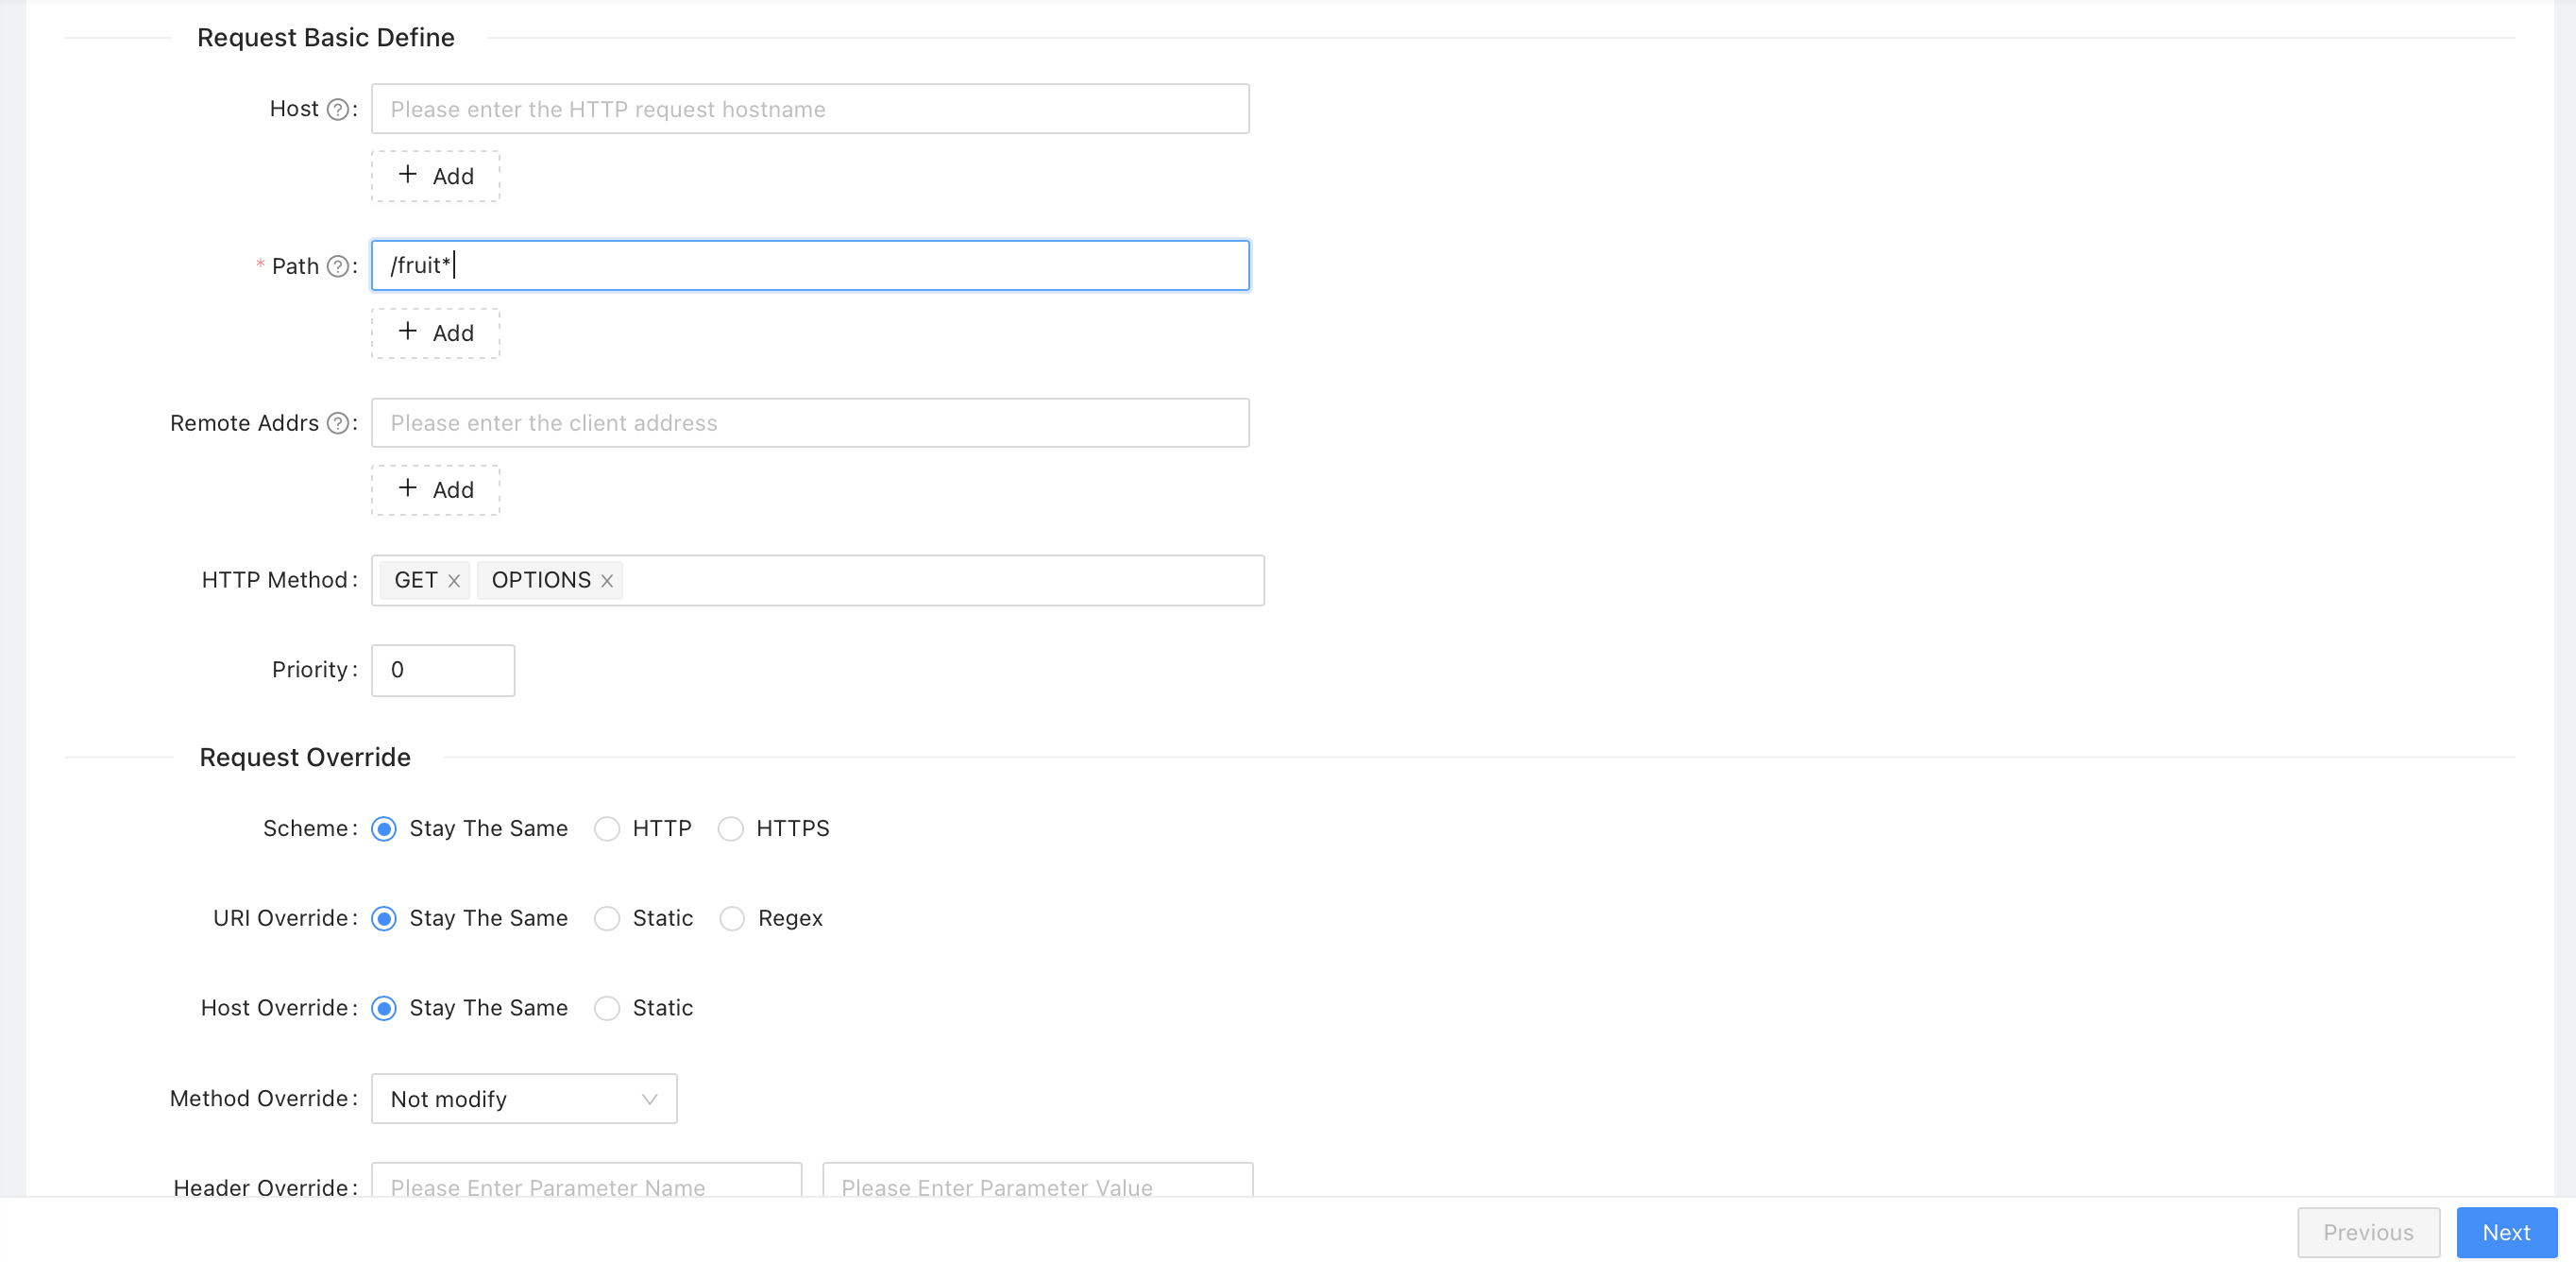
Fill out the necessary details (anything not mentioned here can be left at the default value). For example, for the “slow service” to be included in the Sample Applications, provide these details:
-
name = slow
-
path = /fruit*
-
method = get, options
-
upstream type = service discovery
-
discovery type = eureka
-
service name = SLOW (note that this is case sensitive, this is the key from the Eureka dashboard)
NOTE: The API Gateway is pre-configured with both “Eureka” and “Kubernetes” discovery types. For Eureka, the service name is the key used to deploy the service in Eureka, which is normally the value from
spring.application.namein the Spring Boot configuration file (src/main/resources/application.yaml), in uppercase characters. For Kubernetes, the service name is in the formatnamespace/service:portwherenamespaceis the Kubernetes namespace in which the Spring Boot application is deployed,serviceis the name of the Kubernetes service for that application, andportis the name of the port in that service. If you deployed your Spring Boot application with the Oracle Backend for Microservices and AI CLI, the port name will bespring. For example, an application calledslow-servicedeployed in themy-appsnamespace would bemy-apps/slow-service:spring.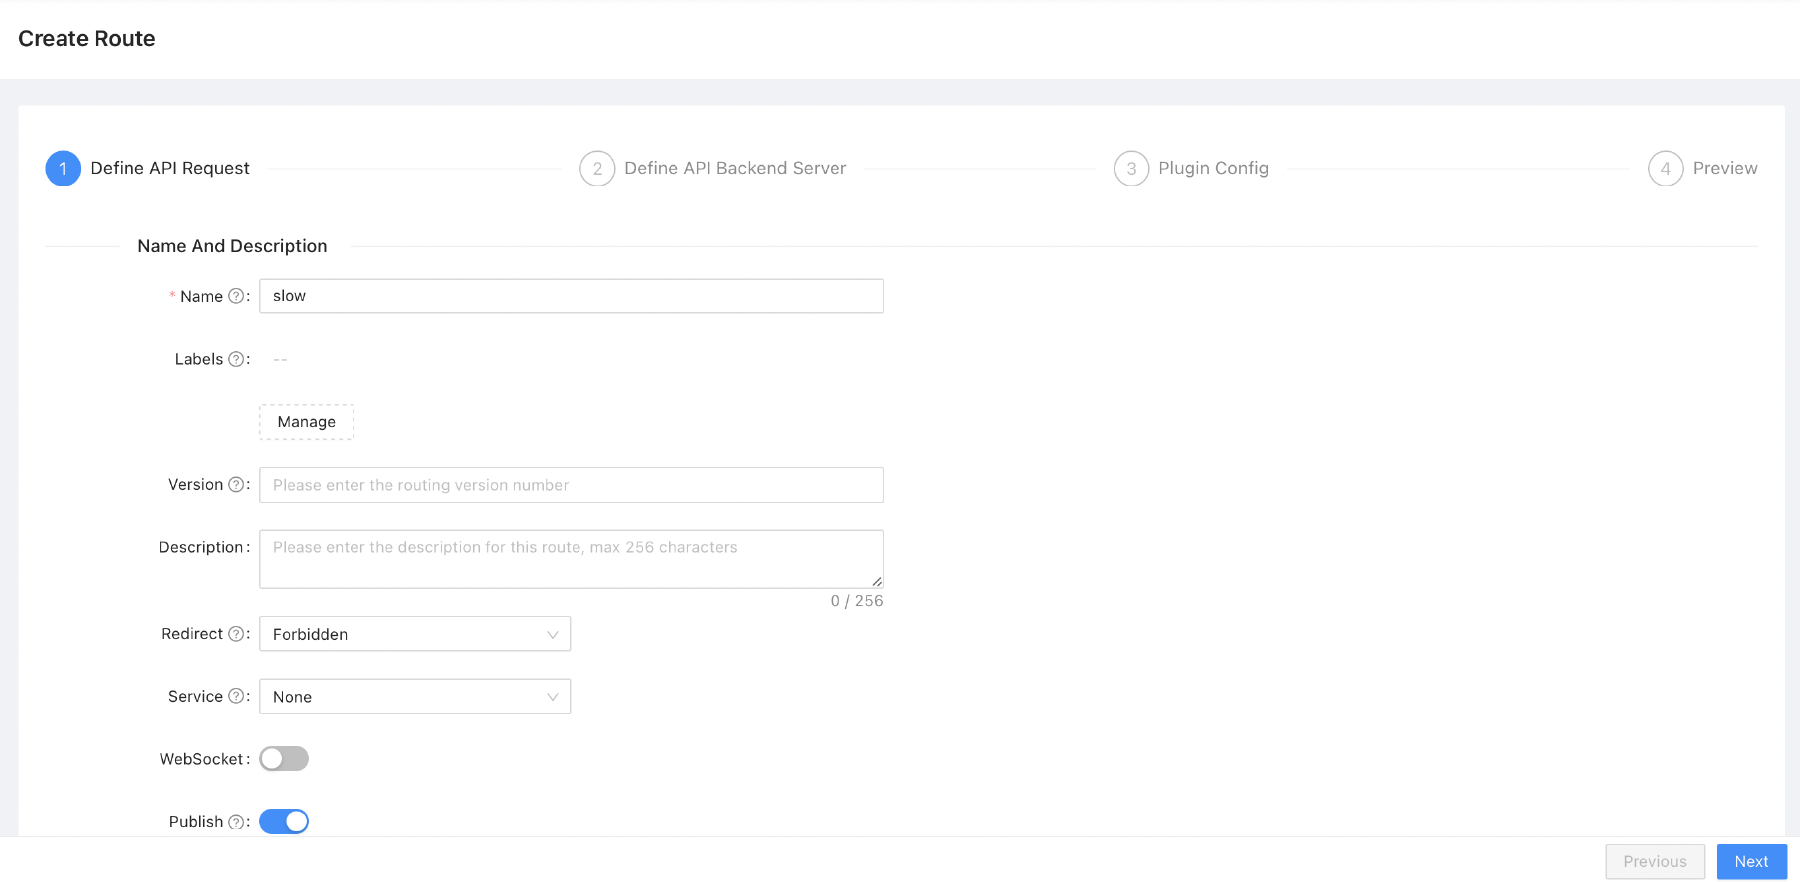
APISIX Routes Step1 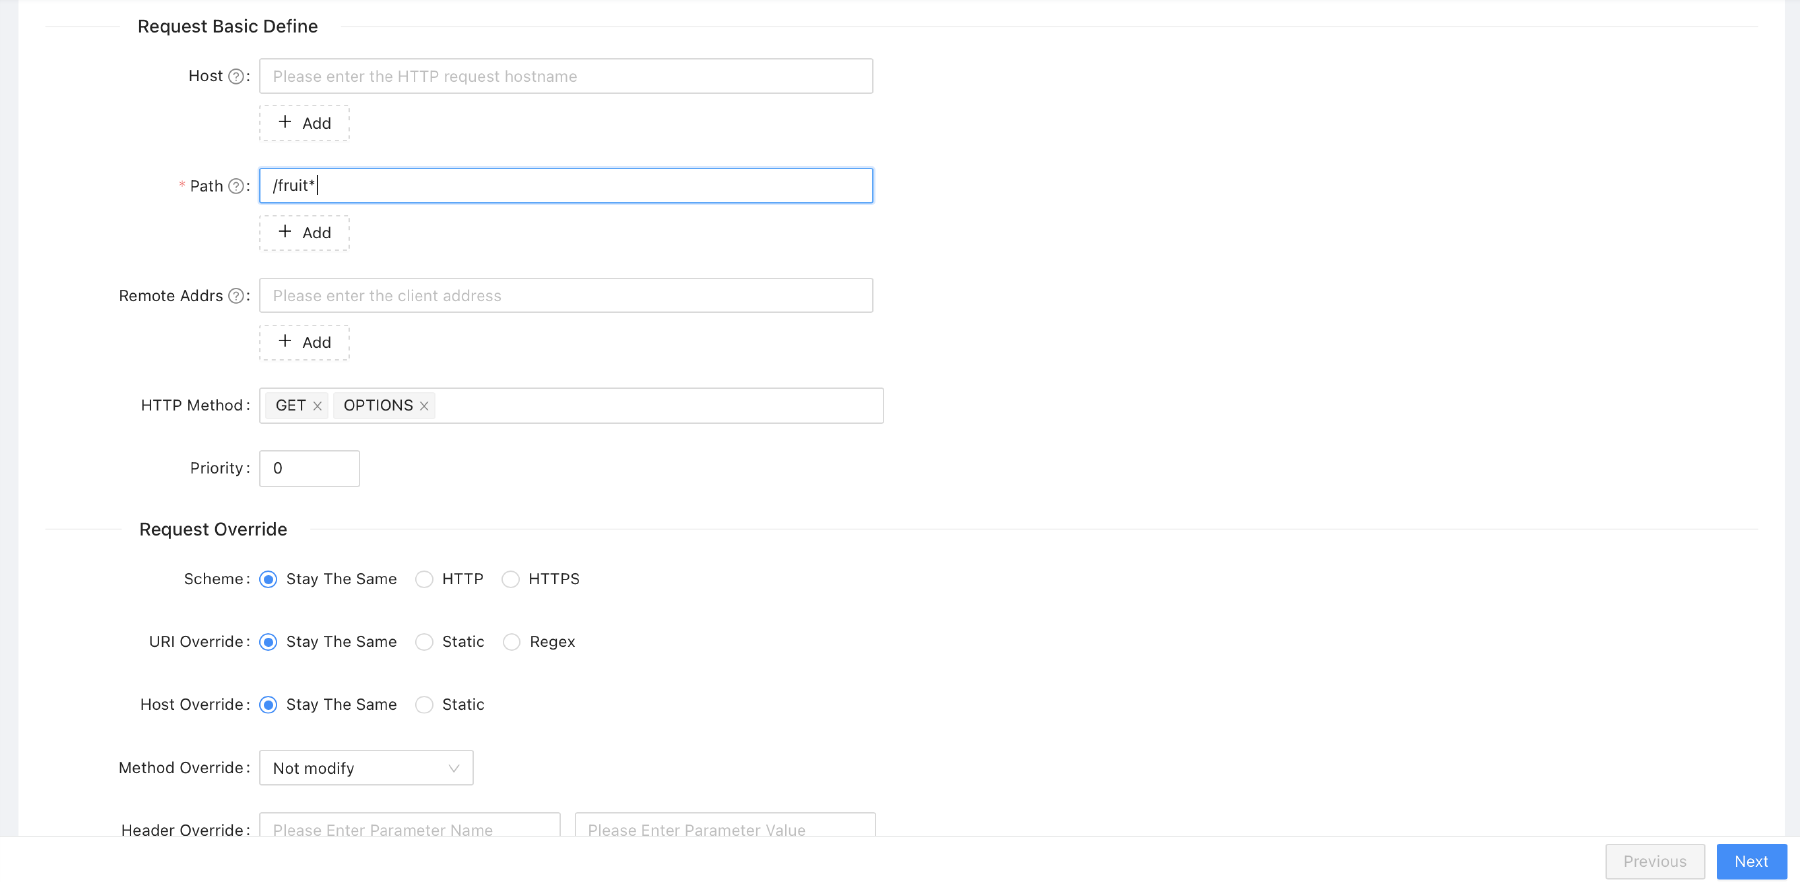
APISIX Routes Step2 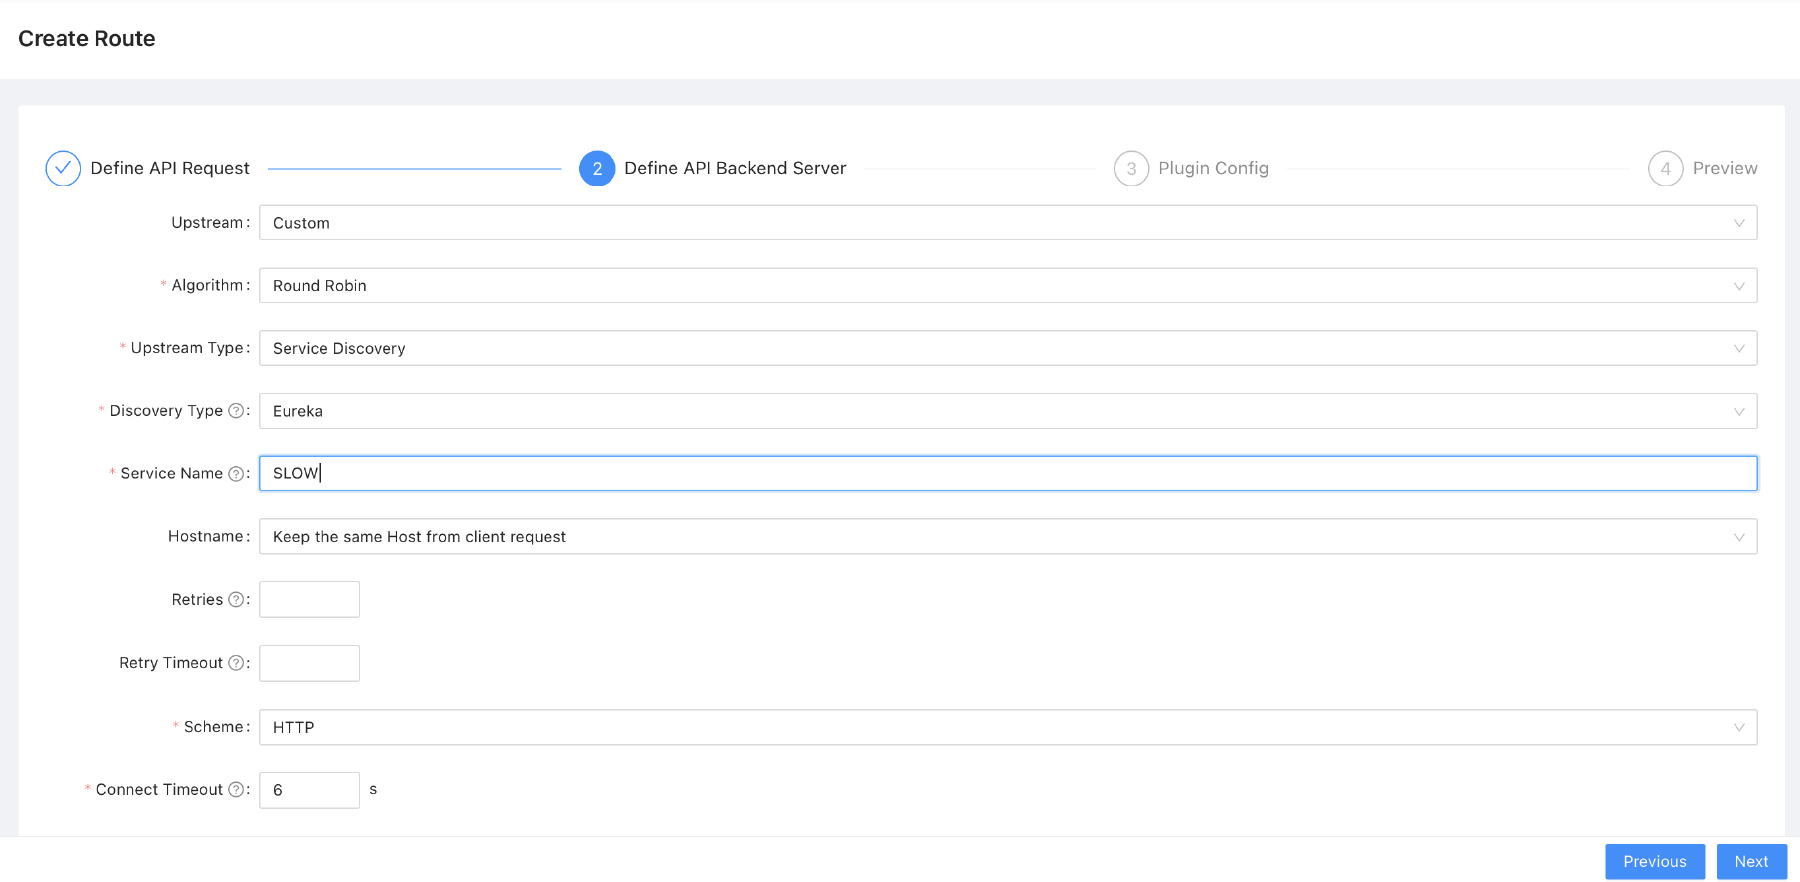
APISIX Routes Step3
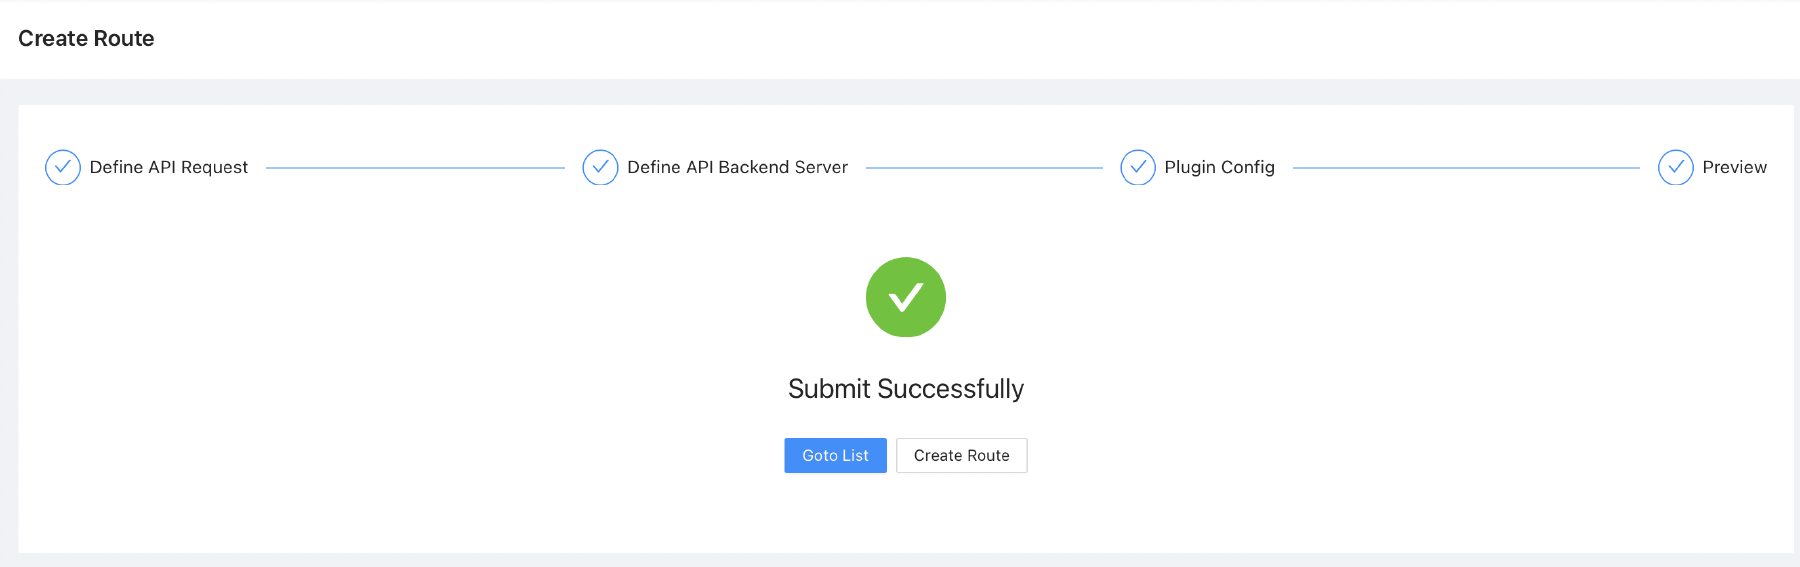
- Save the route that you created.
APISIX Routes Step4 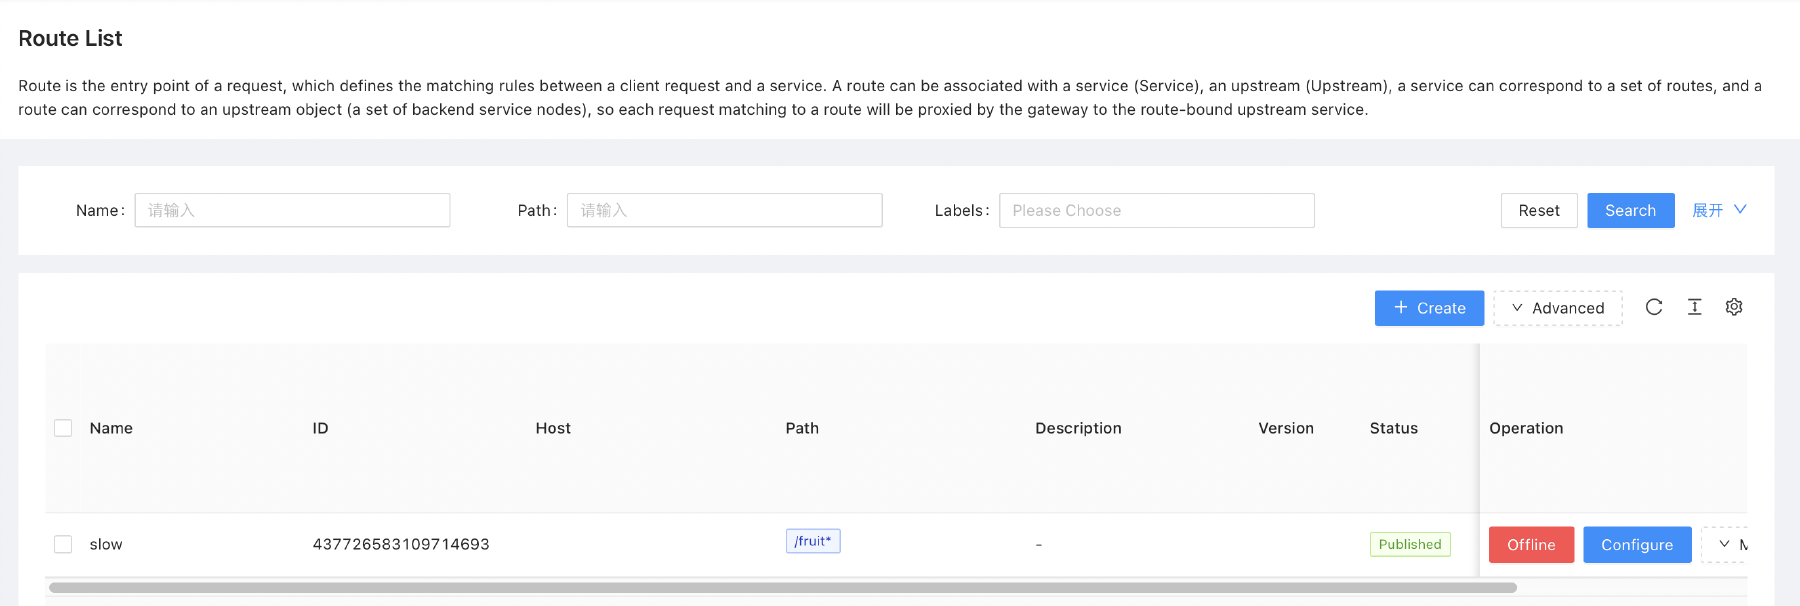
APISIX Routes Step5
-
Test a route to the service. For example:
- Get the Apache APISIX Gateway external IP using this command:
kubectl -n ingress-nginx get svc ingress-nginx-controllerThe result of the command should look similar to this:
NAME TYPE CLUSTER-IP EXTERNAL-IP PORT(S) AGE ingress-nginx-controller LoadBalancer 10.96.172.148 146.235.207.230 80:31393/TCP,443:30506/TCP 25h- Call the API using the Apache APISIX Gateway address plus path. For example:
curl http://APISIX_IP/fruitYou should get “banana” or “fallback fruit is apple” back as the response.