ServiceOps Center
Oracle Backend for Microservices and AI includes “ServiceOps Center”. The ServiceOps Center provides a web user interface to manage the Oracle Backend for Microservices and AI. This release includes the following capabilities:
- View details about the configuration and health of the environment
- Manage and deploy workloads/microservices deployed in the environment
- Manage users and roles defined in the Authorization Server included in the environment
- Collect diagnostic data for support
Deprecation NoticeThis component is deprecated in the 1.4.0 release and will be removed in a future release.
- Accessing ServiceOps Center
- Login Screen
- The Dashboard
The ServiceOps Center can send emails for following operations:
- Forgot Password
- Reset Password
- Forgot Username
- Create User
- Change Password
- Change Roles
- Change Email
It is required to configure a SMTP secret as follows for the email functionality to work.
 kubectl -n obaas-admin create secret generic smtp-secret \
    --from-literal=SMTP_USER=<smtp-server-user> \
    --from-literal=SMTP_PASSWORD=<smtp-server-password> \
    --from-literal=SMTP_HOST=<smtp-server-address> \
    --from-literal=SMTP_PORT=<smtp-server-port> \
    --from-literal=SMTP_SECURE=<true-if-tls-port> \
    --from-literal=SMTP_FROM=<from-email-address>
To access the ServiceOps Center, obtain the public IP address for your environment using this command:
kubectl -n ingress-nginx get service ingress-nginx-controller
The output will be similar to this:
NAME                       TYPE           CLUSTER-IP      EXTERNAL-IP       PORT(S)                      AGE
ingress-nginx-controller   LoadBalancer   10.96.172.148   xxx.xxx.xxx.xxx   80:31393/TCP,443:30506/TCP   158m
Use the EXTERNAL-IP from the results and open a browser to https://xxx.xxx.xxx.xxx/soc to access the login page.
Note: If you installed with self-signed certificates, which is the default, you will see a browser warning message and will have to click on “Accept risk” or similar. For information about replacing the self-signed certificate with a production certificate, refer to Transport Layer Security
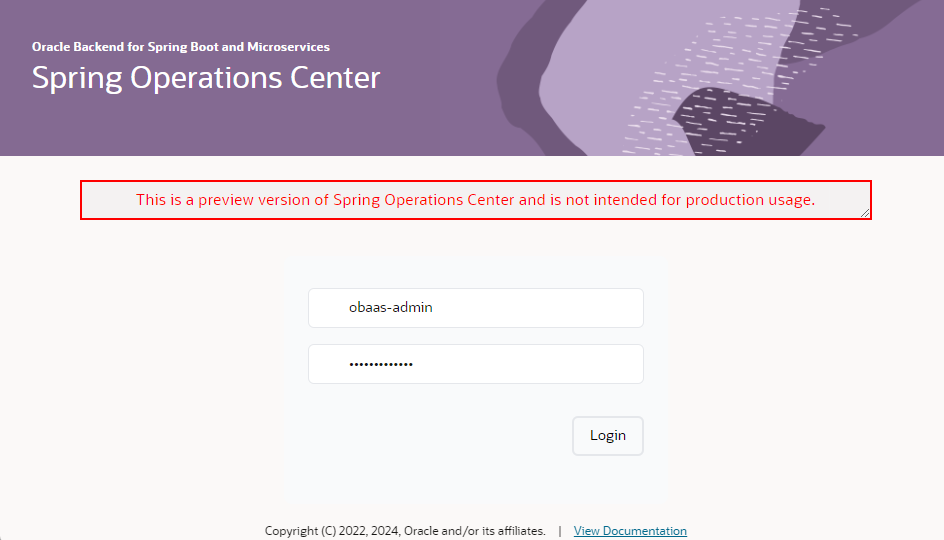
Login using the obaas-admin user (or another user if you have created one) and the password that you set during installation. If you did not set a password, one was auto-generated for you and can be obtained with this command:
kubectl get secret -n azn-server oractl-passwords -o jsonpath='{.data.admin}' | base64 -d; echo
Login page also provides link to retrieve username, get a one-time password and reset password.
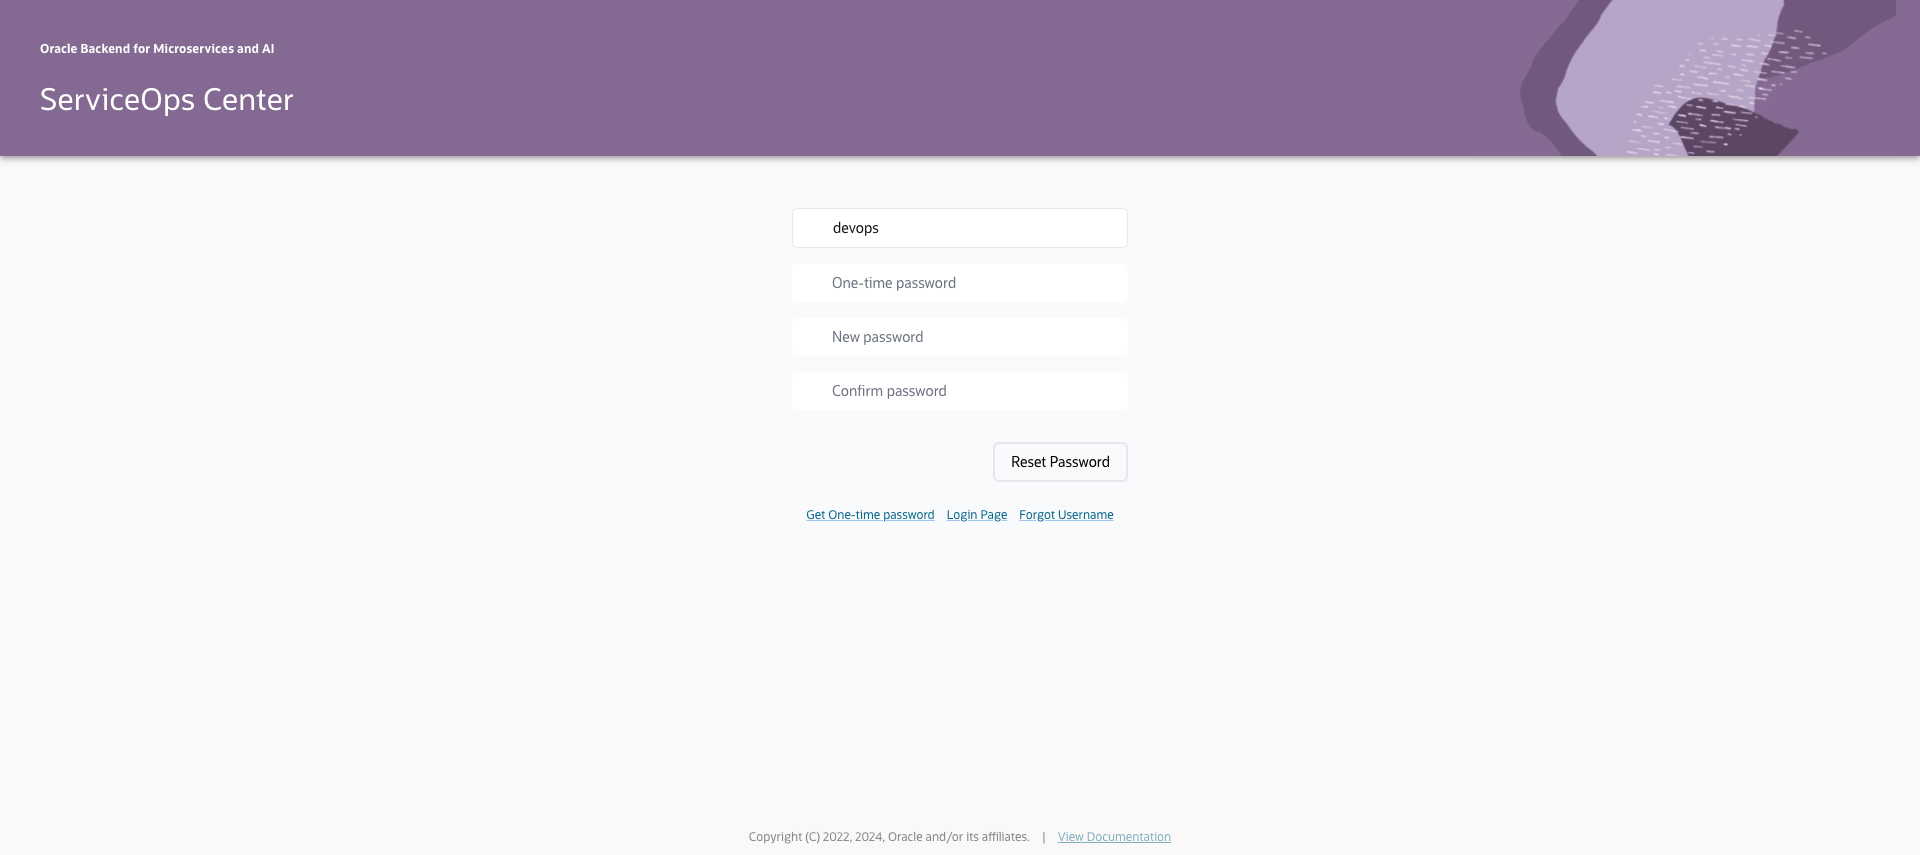
Click on “Forgot Password” to generate a One-time password which will be sent to your email (if configured)
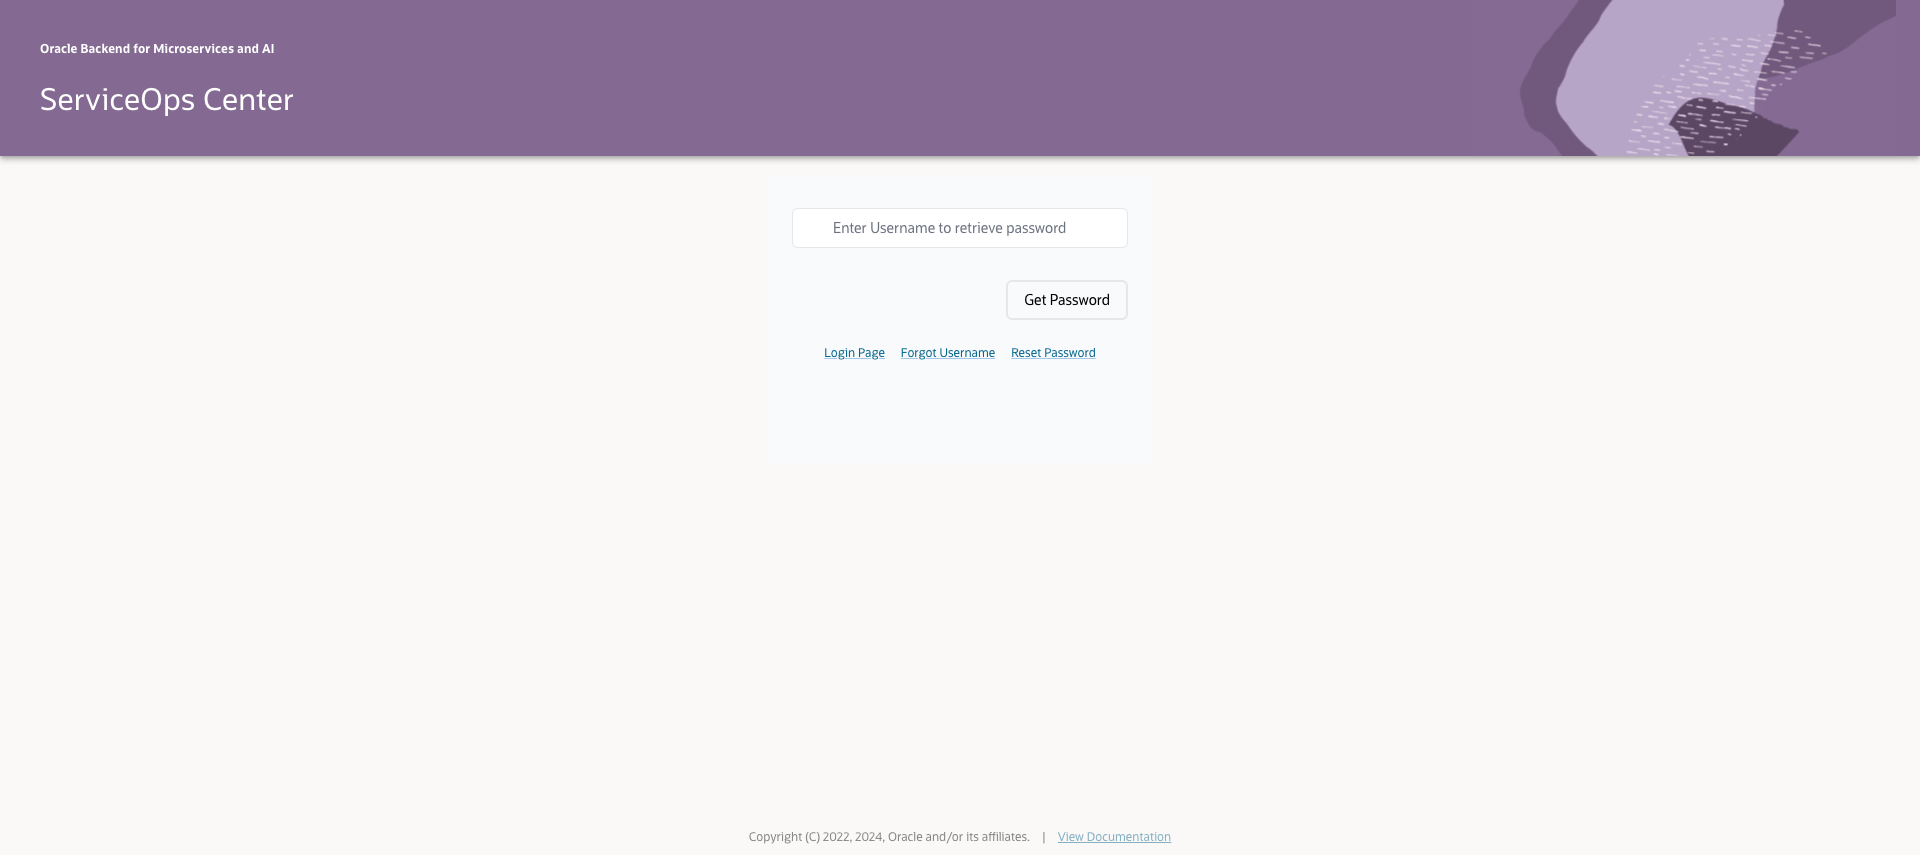
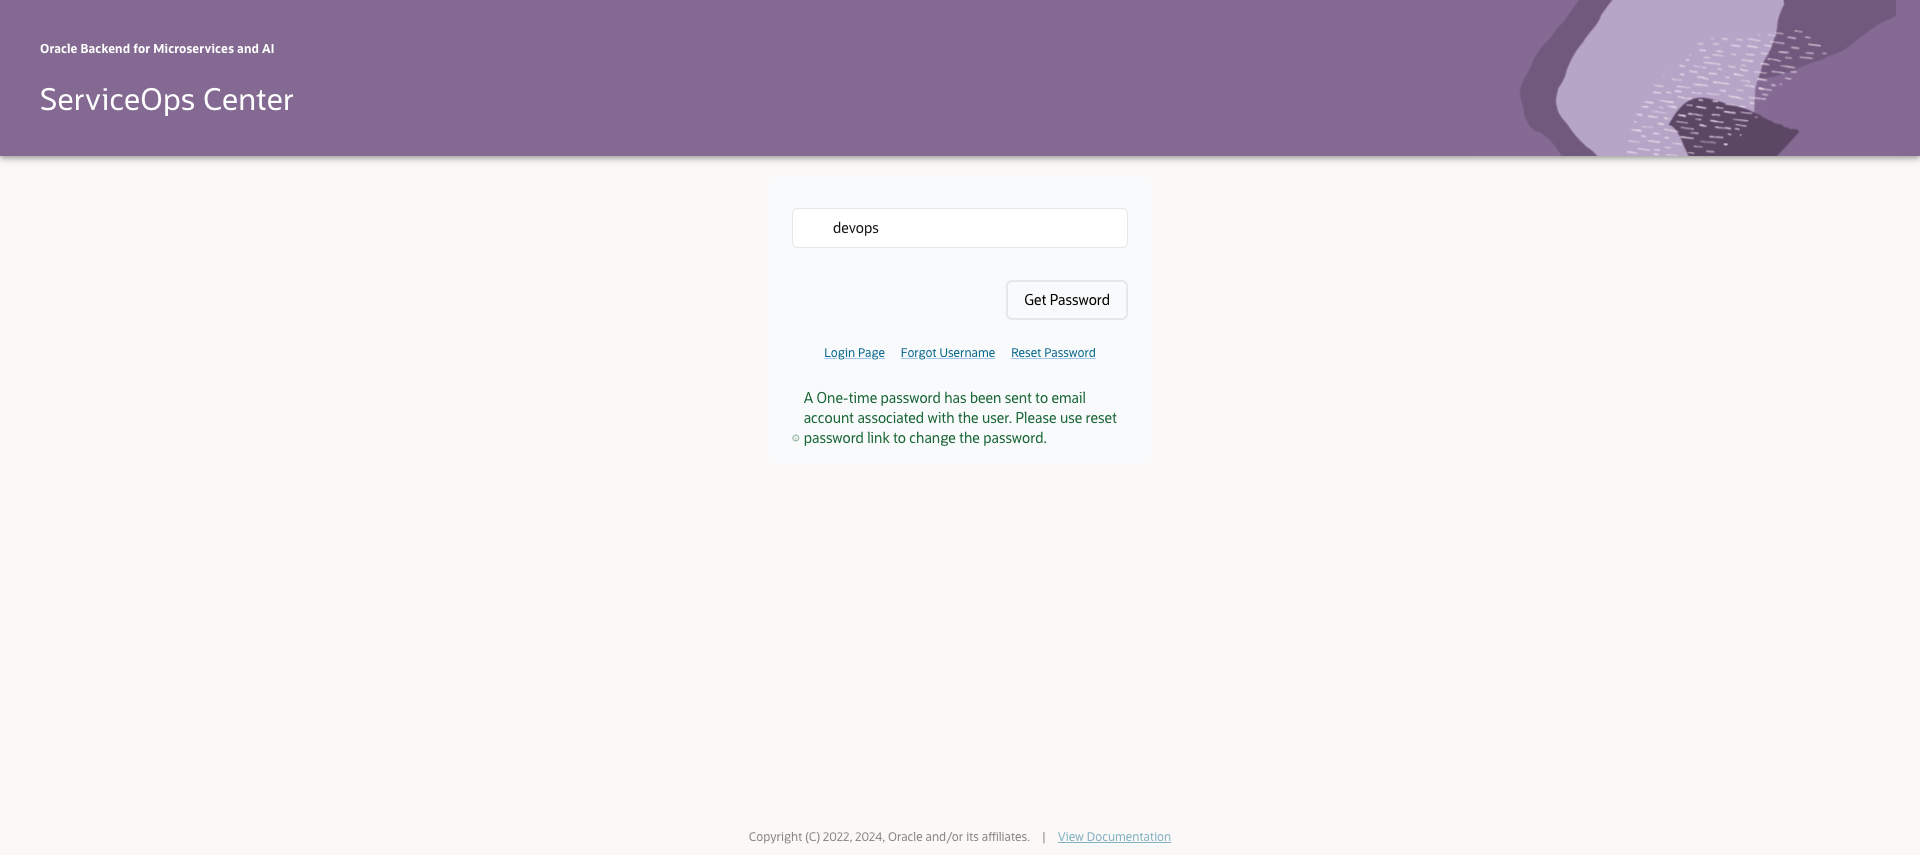
The One-time password must be reset using the “Reset Password” link.
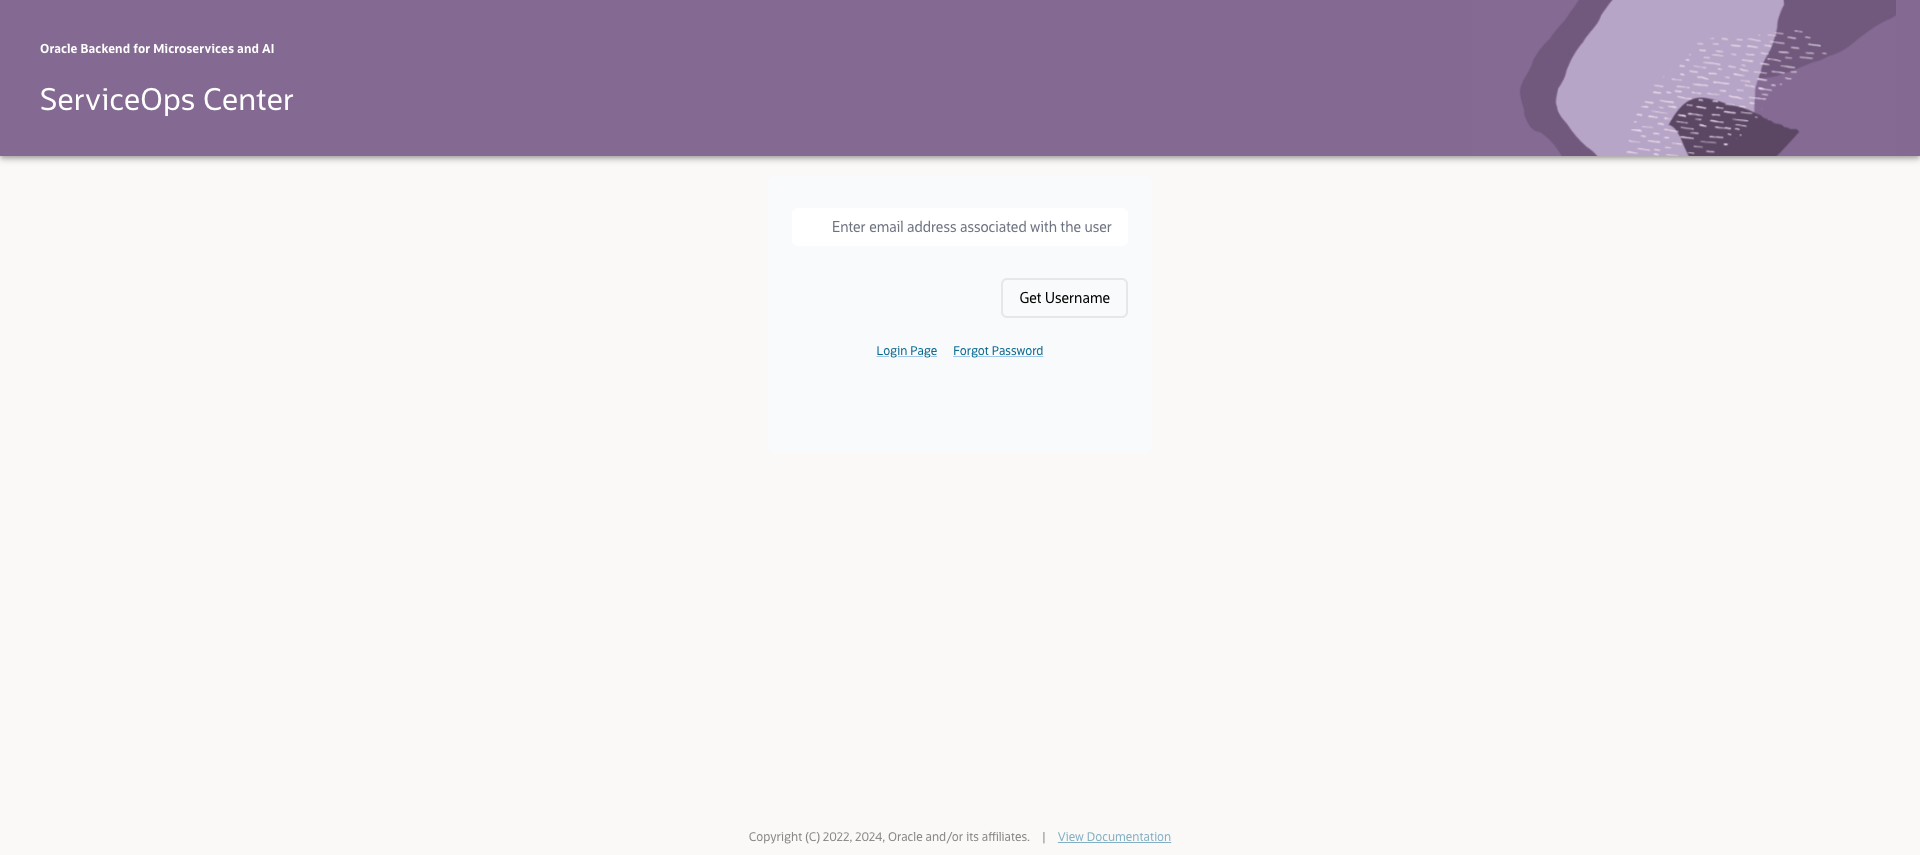
Click the “Forgot Username” link to retrieve username in an Email.
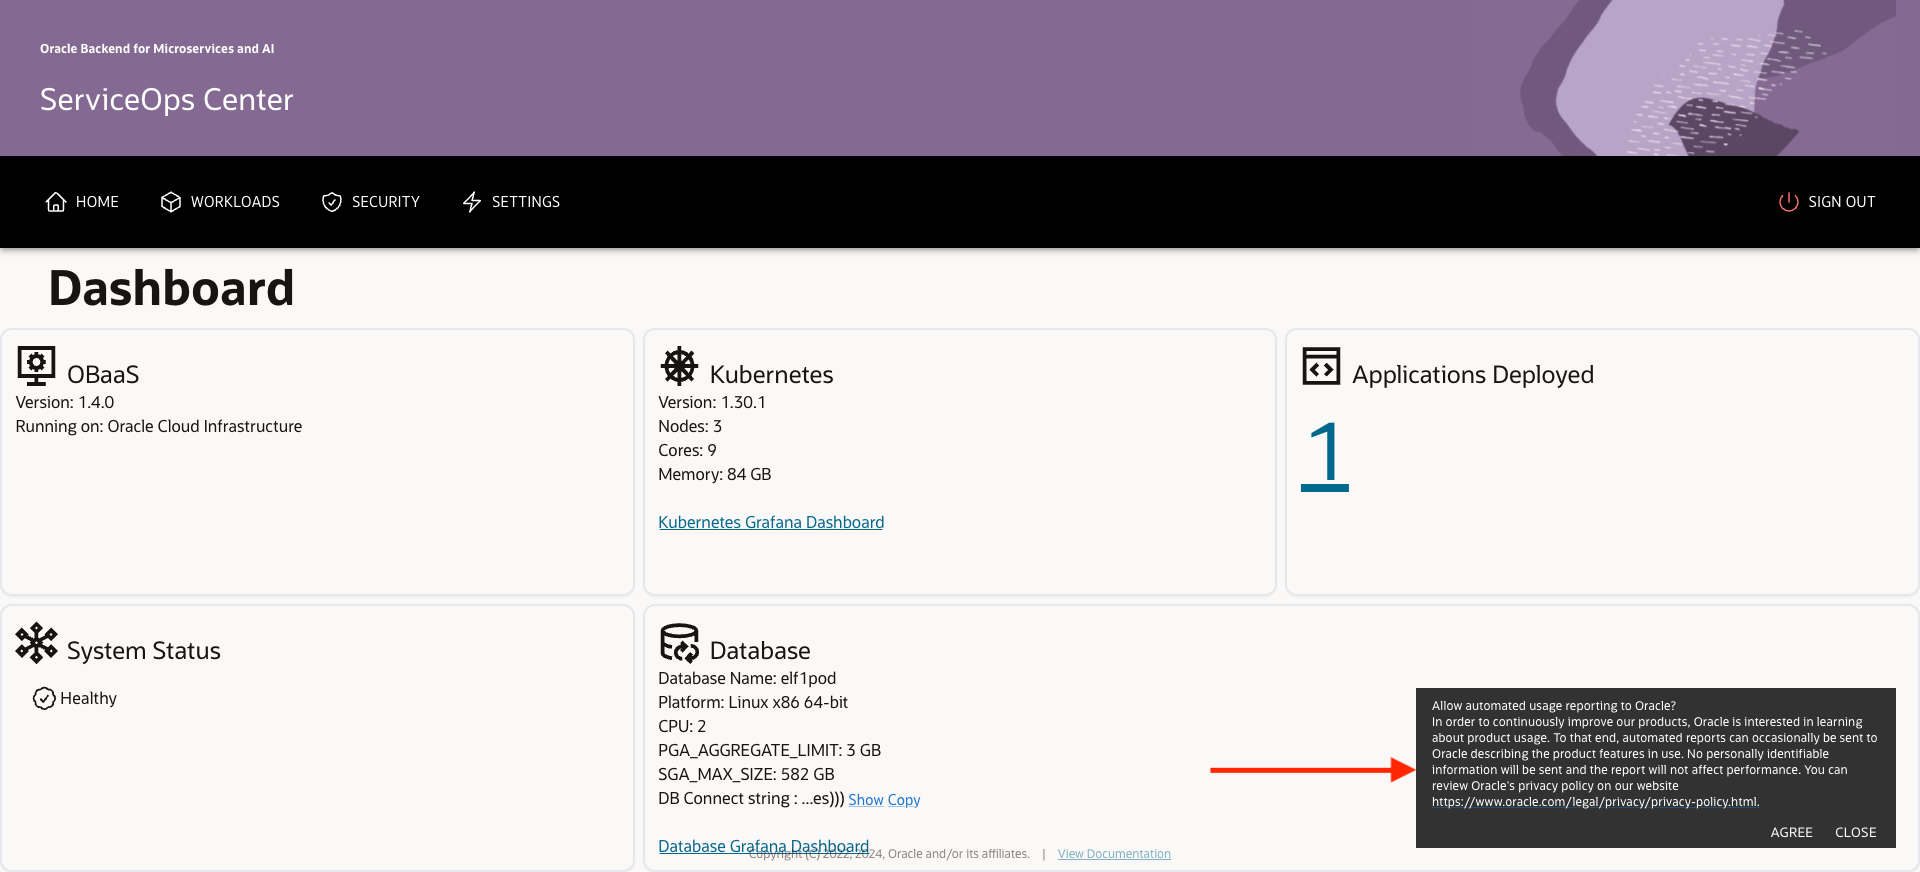
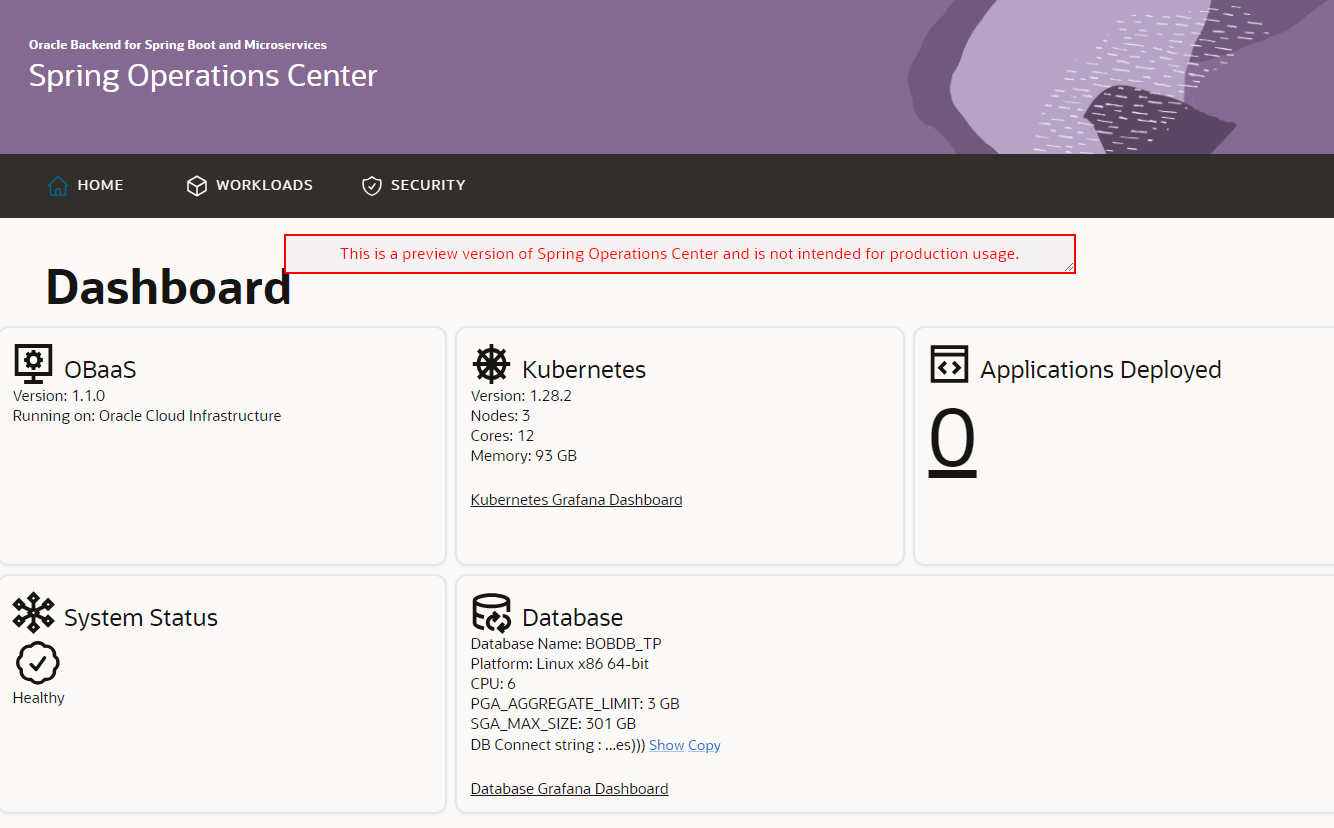
After logging in, you will see the SOC Dashboard.
The ServiceOps Center Dashboard provides information about the overall state of the environment including:
- The version and platform the environment is running on
- The configuration and sizing of the Kubernetes cluster
- The configuration and sizing of the Database instance
- The overall system health status
- How many applications are deployed in the environment
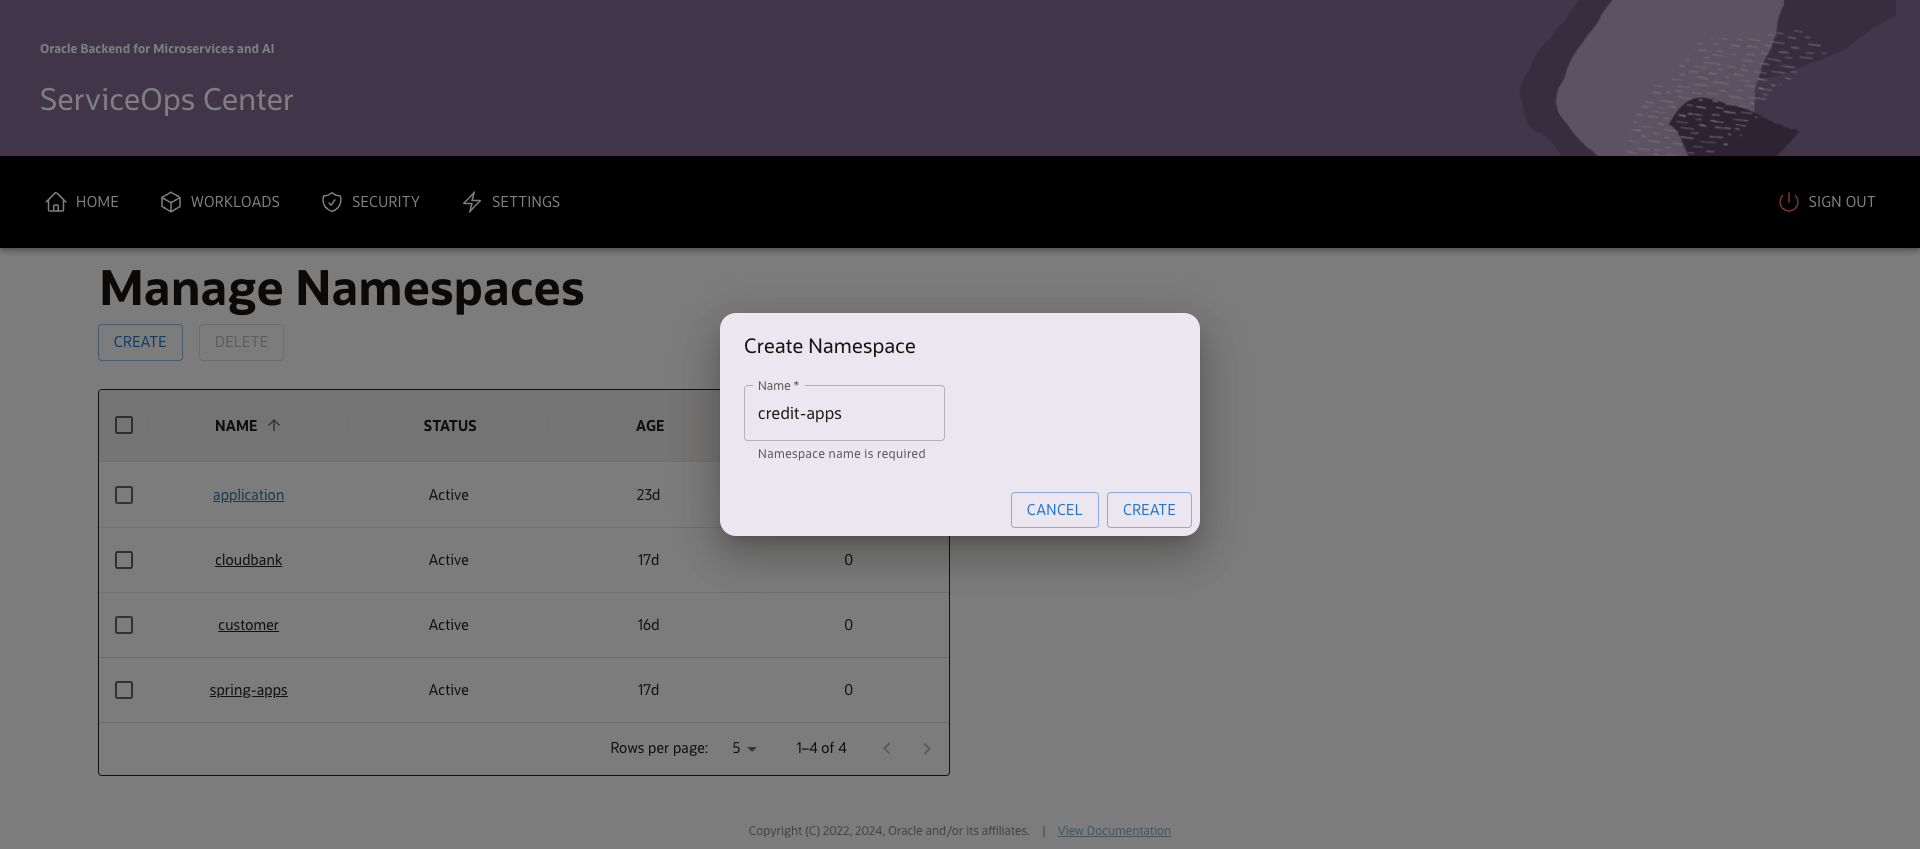
The Manage Namespaces screen is accessible from the Workloads menu, and allows you to view and manage the namespaces that are configured for microservice deployments. Note that this does not show you all namespaces in the Kubernetes cluster, just those that have be specifically configured for workloads, meaning they have the necessary secrets for pulling images, accessing the database, and so on.
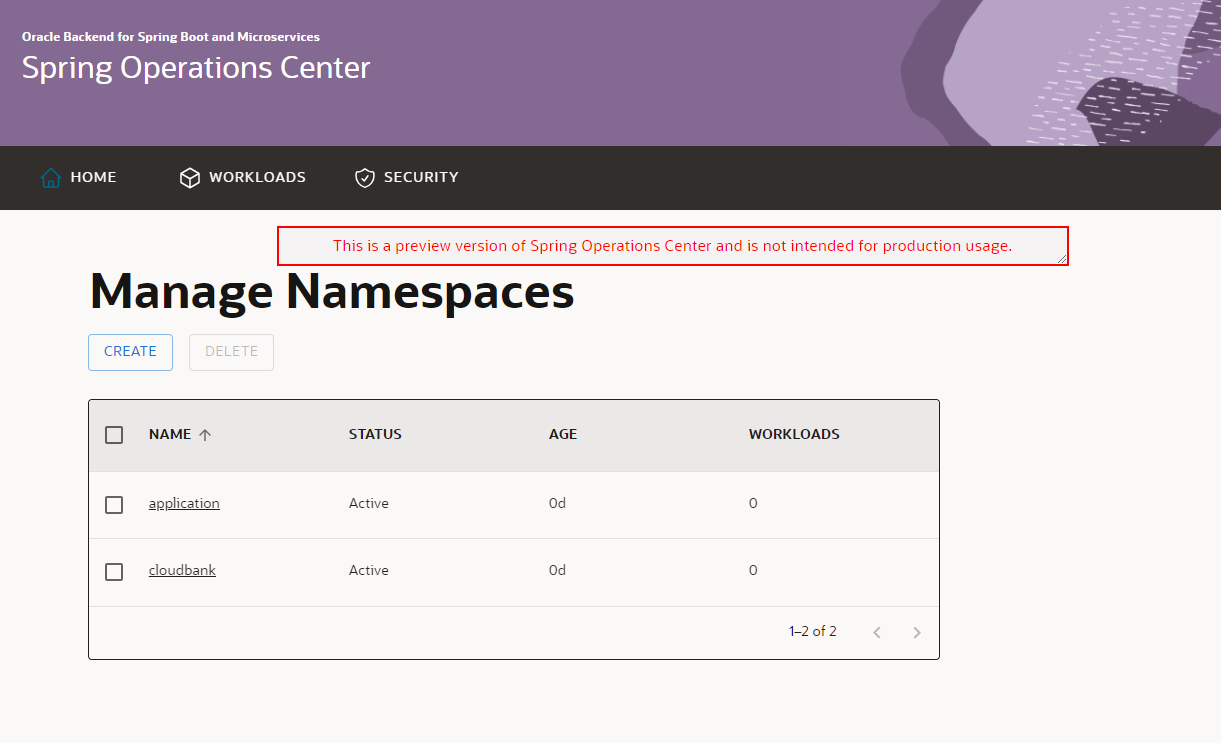
Clicking on a namespace will allow you to drill down into that namespace and see the workloads/microservices deployed there.
You can click on the “CREATE” button to create a new namespace.
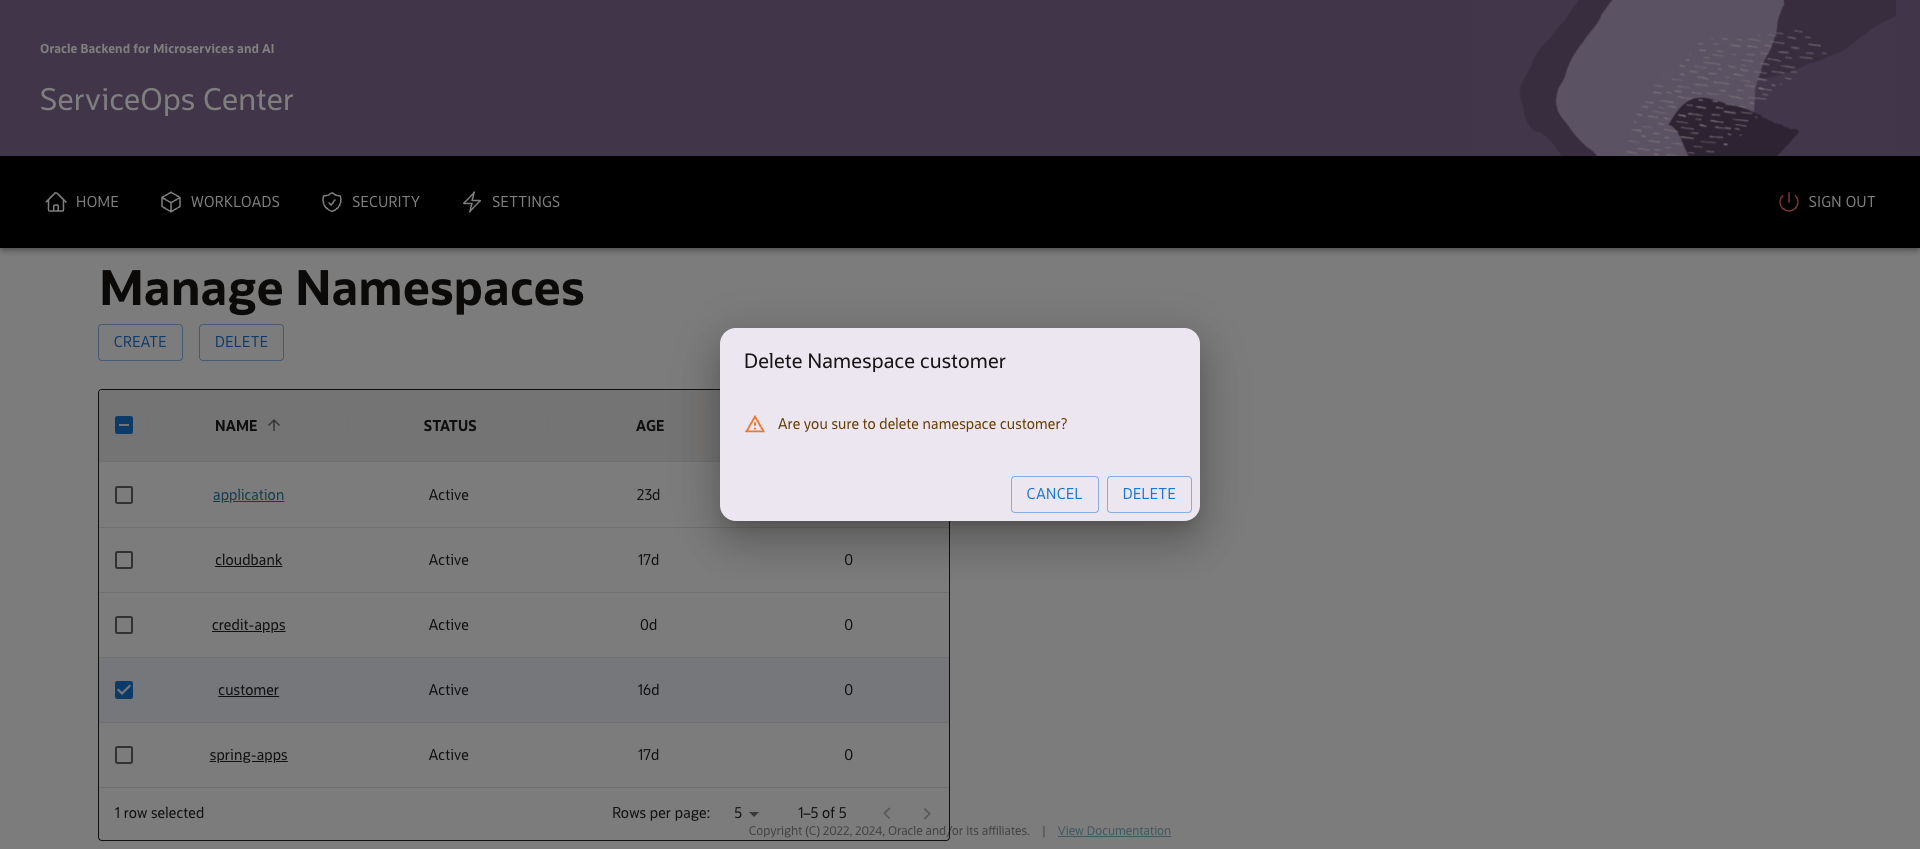
To delete one or more of the namesapces, select from the grid and click “DELETE” button.
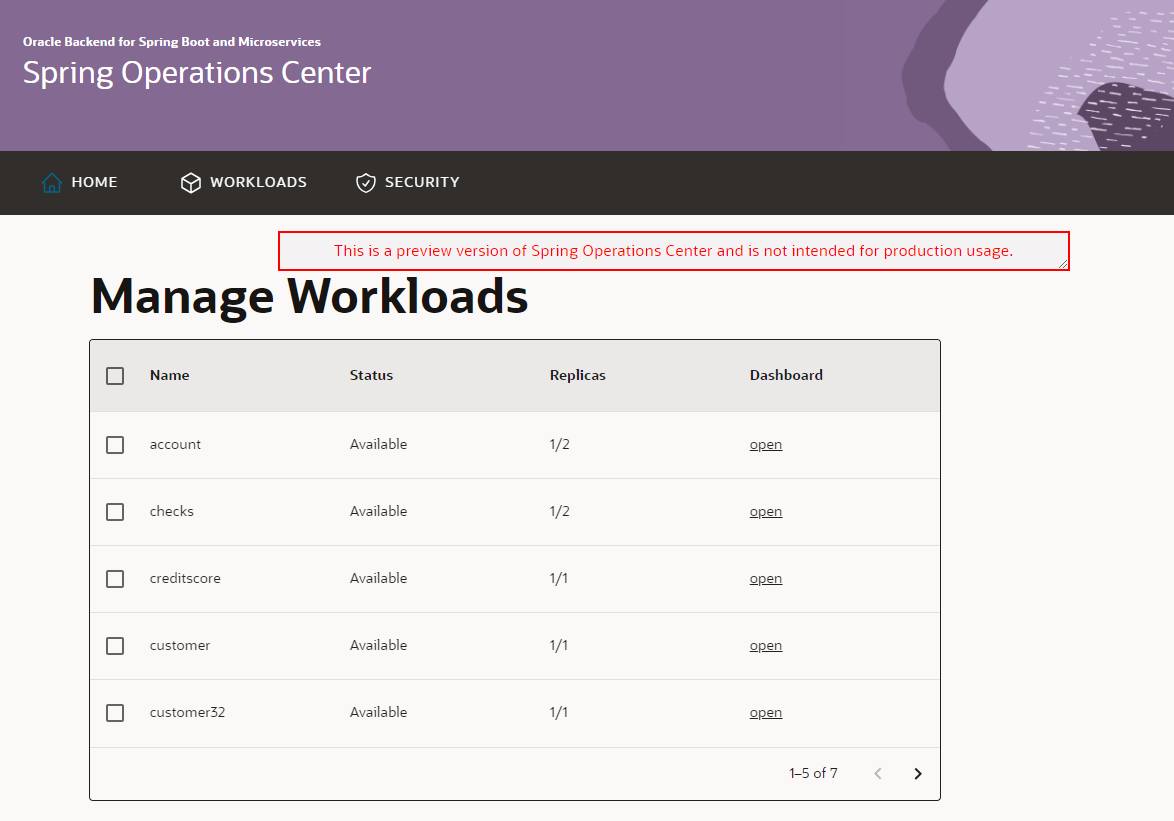
The Manage Workloads screen shows the workloads/microservices deployed in a specific namespace, including the status of each workload, and how many replicas are currently running and desired.
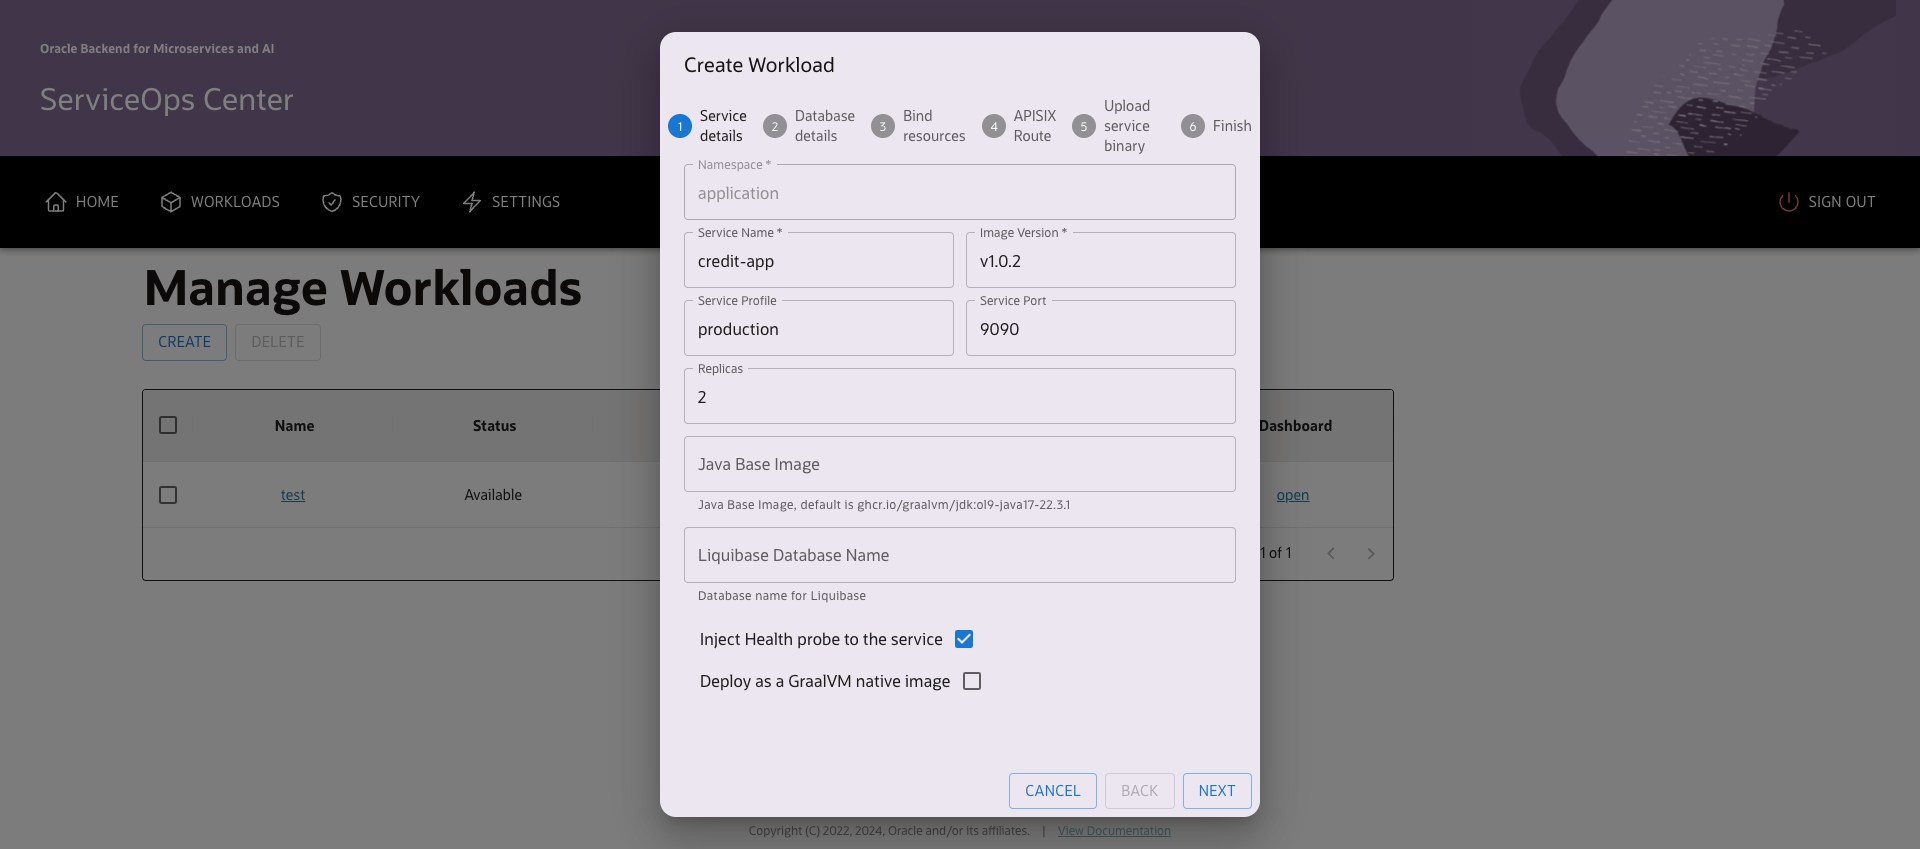
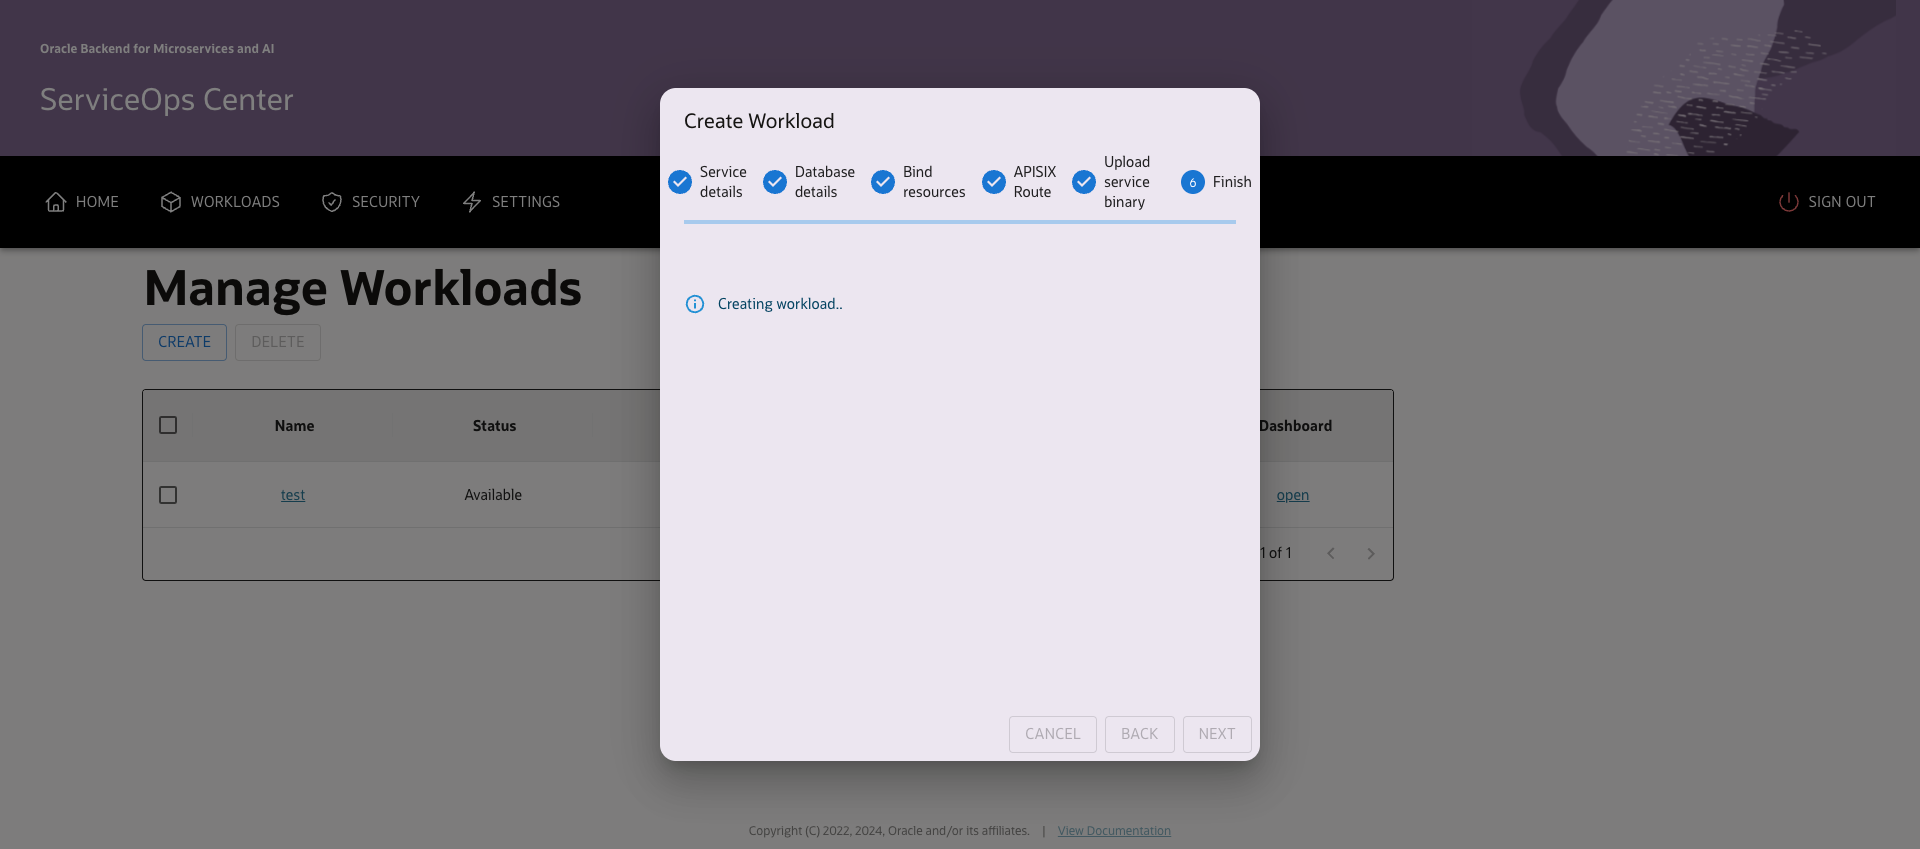
You can click on the “CREATE” button to start the workload deployment wizard where you can provide configuration detail of the workload and upload workload binary. The wizard will have following screens:
Provide basic details of the workload such as
- Name
- Version
- Spring profile to use
- Service Port
- Deployment replicas
- Java Base Image to be used or to use the default
- Name of database schema
- Whether to inject health probe and
- If needs to be deployed as a GraalVM native binary
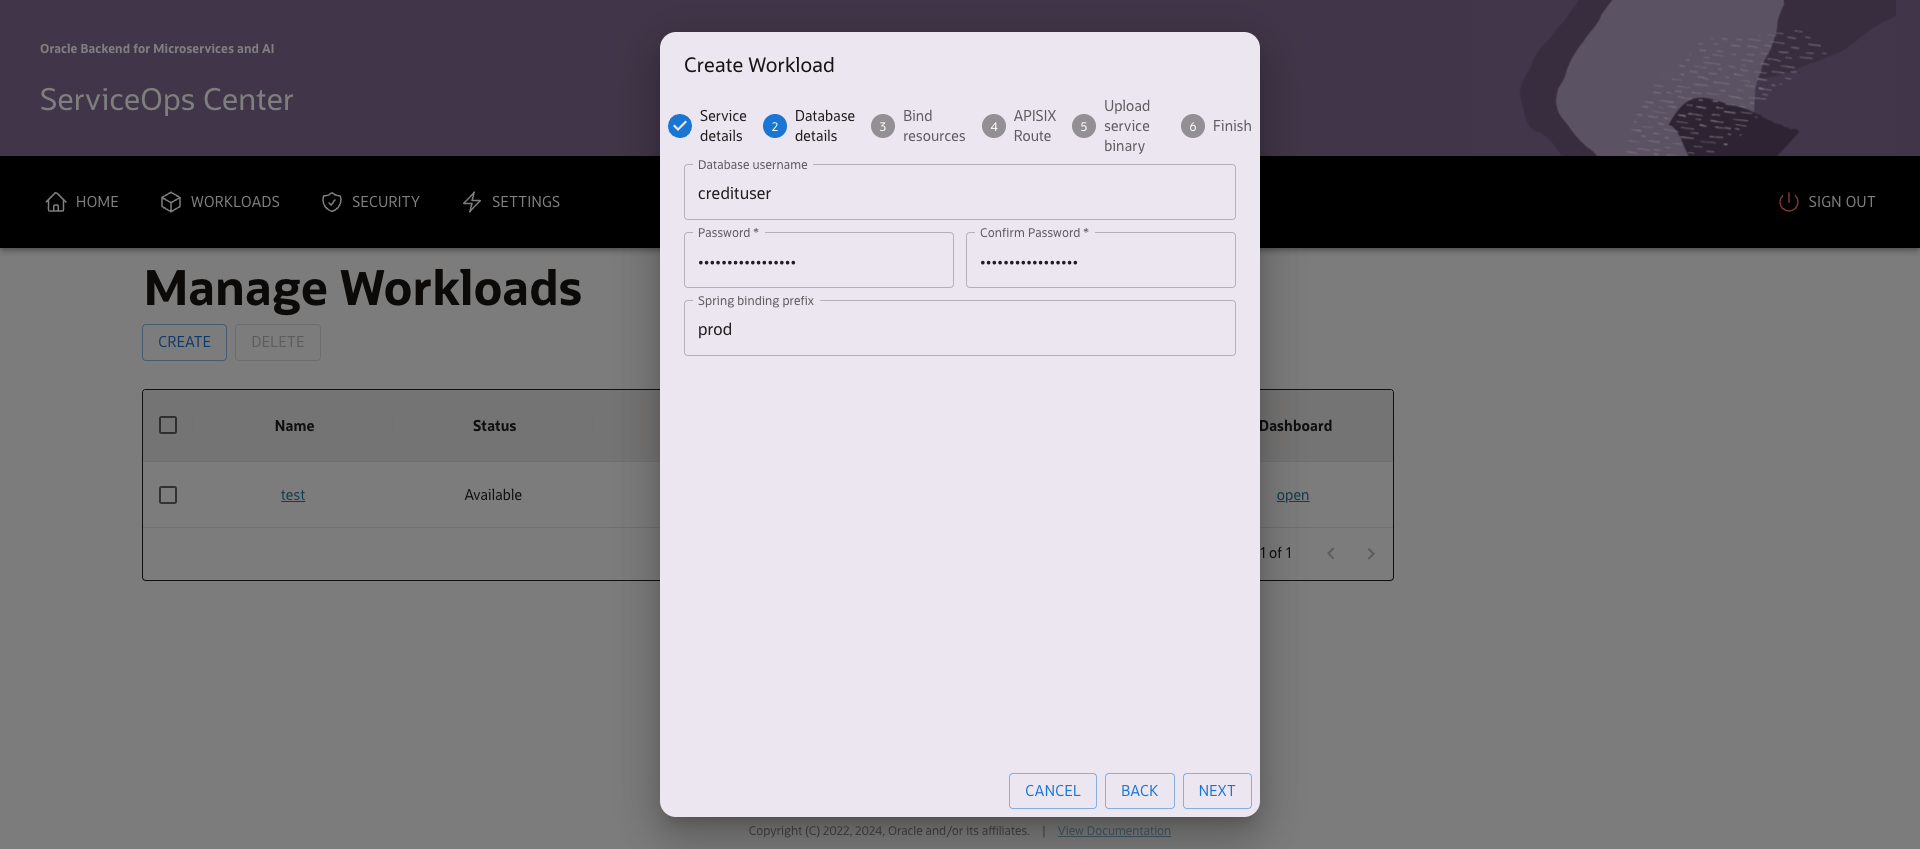
Provide credentials of database schema and optional Spring binding prefix to be used.
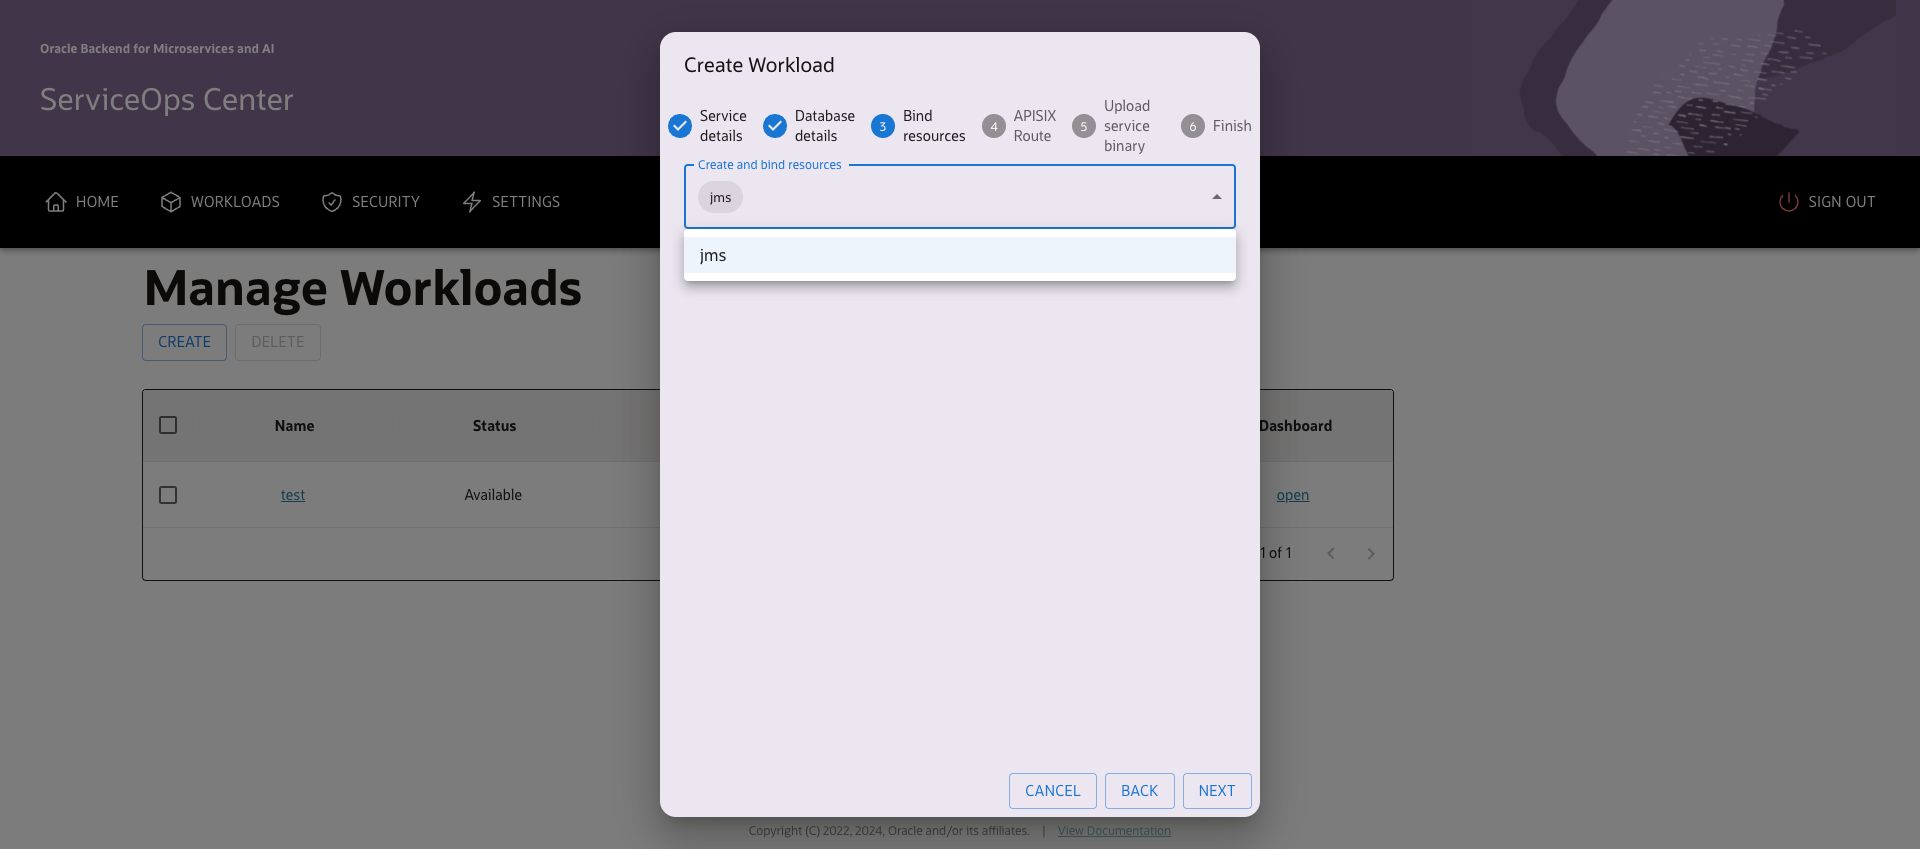
Optionally bind a JMS AQ Event Queue to the workload.
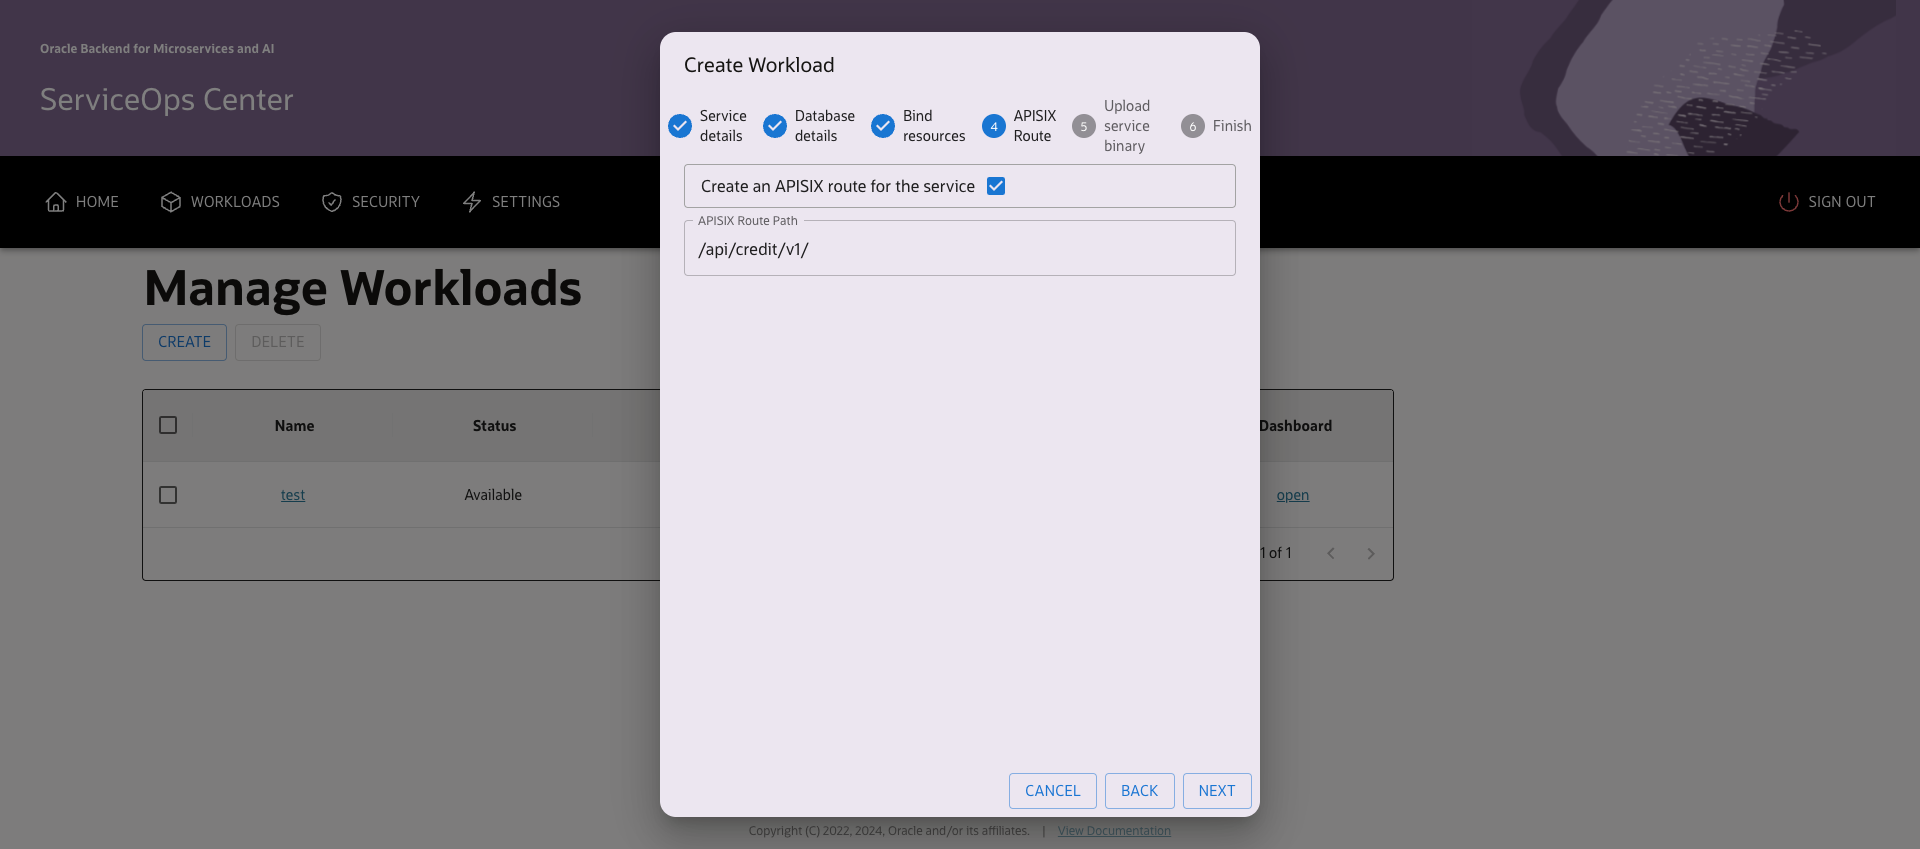
Specify APISIX route for the workload.
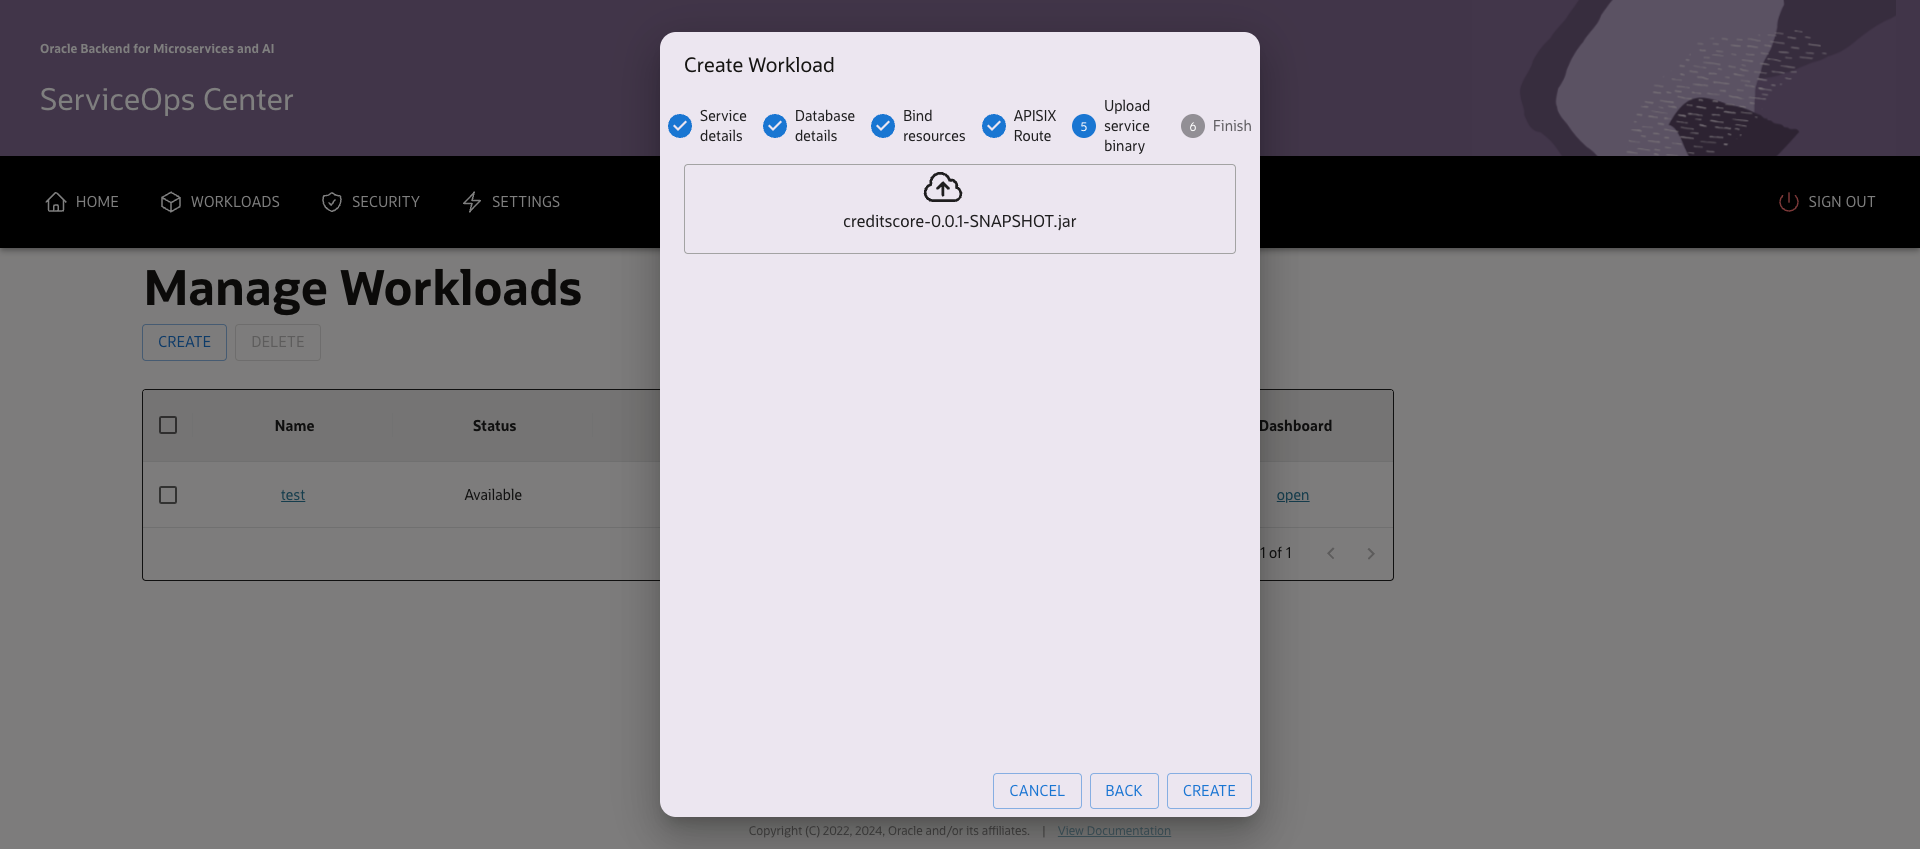
Upload the workload jar/binary.
Next screen will show the progress of workload deployment and associated configurations being created in the cluster.
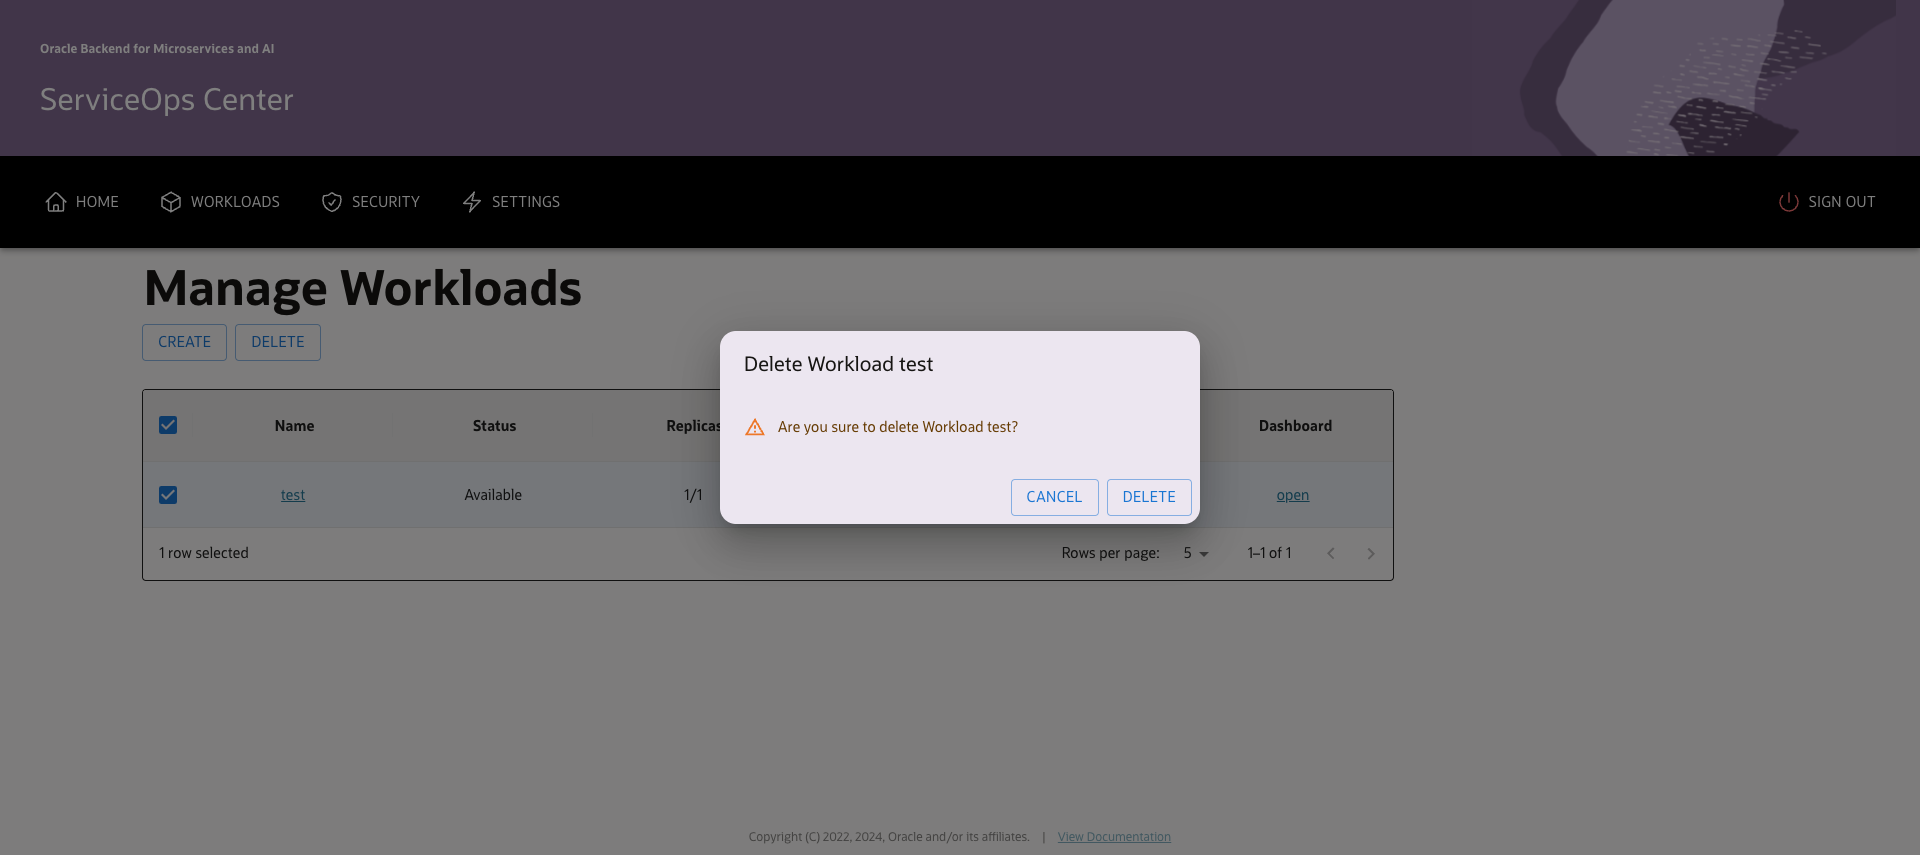
To delete one or more workload, select and click “DELETE”.
To access details about a Workload, click on the name of the workload.
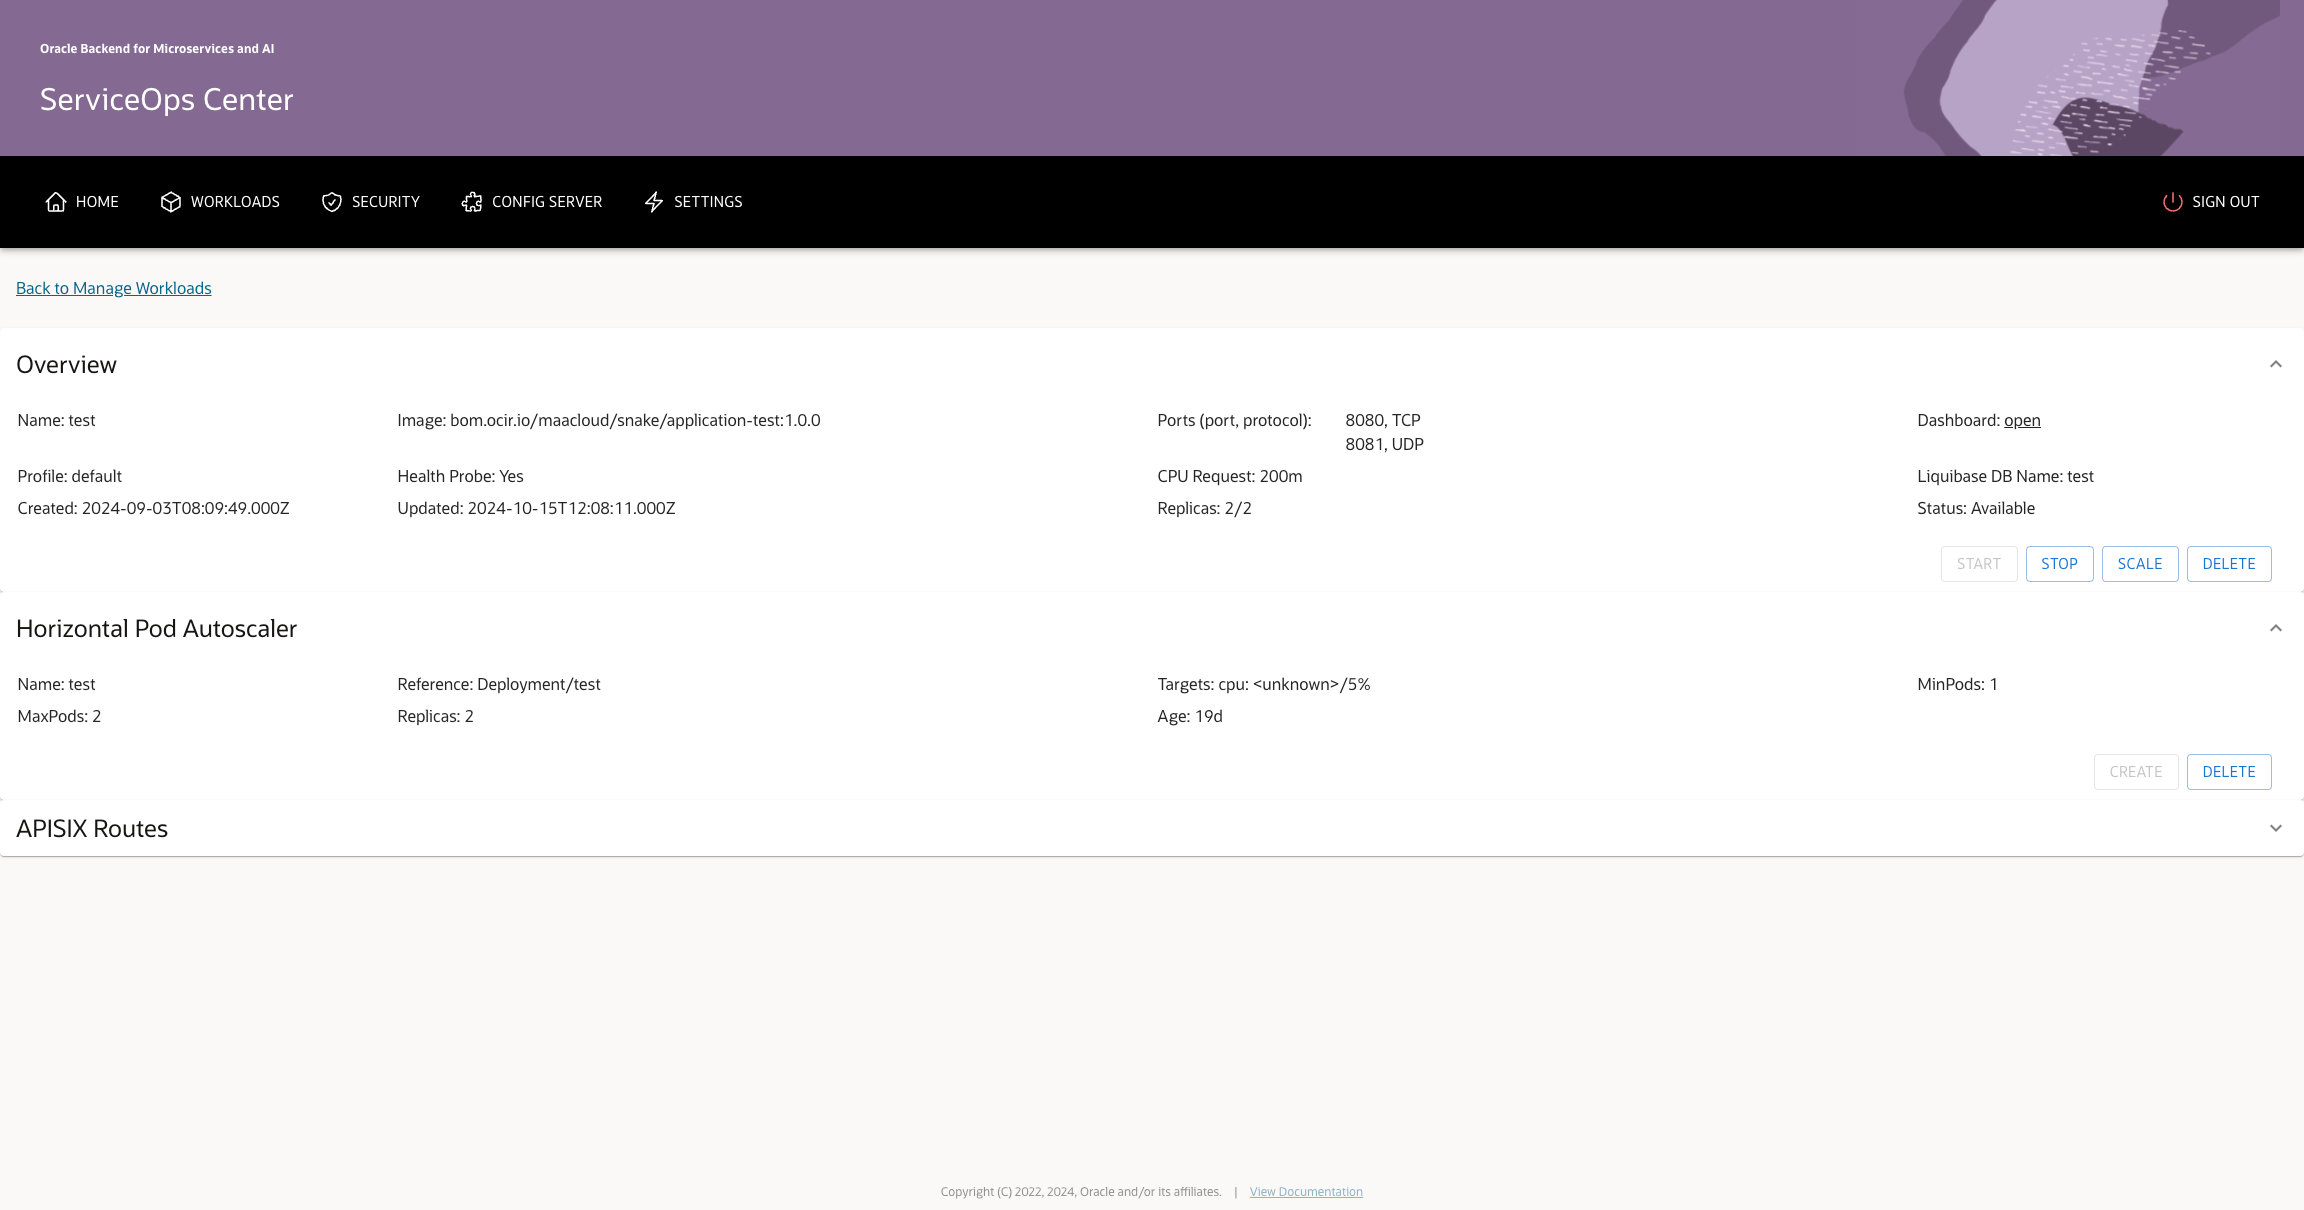
The Overview section on the Workload details page contains basic details of the workload such as
- Name of the workload
- Image
- Ports exposed by the workload
- Spring profile
- Status of Health Probe
- CPU Resource request
- Name of the Liquibase database
- Workload creation/last update timestamps
- Replicas available
- Overall status of the workload.
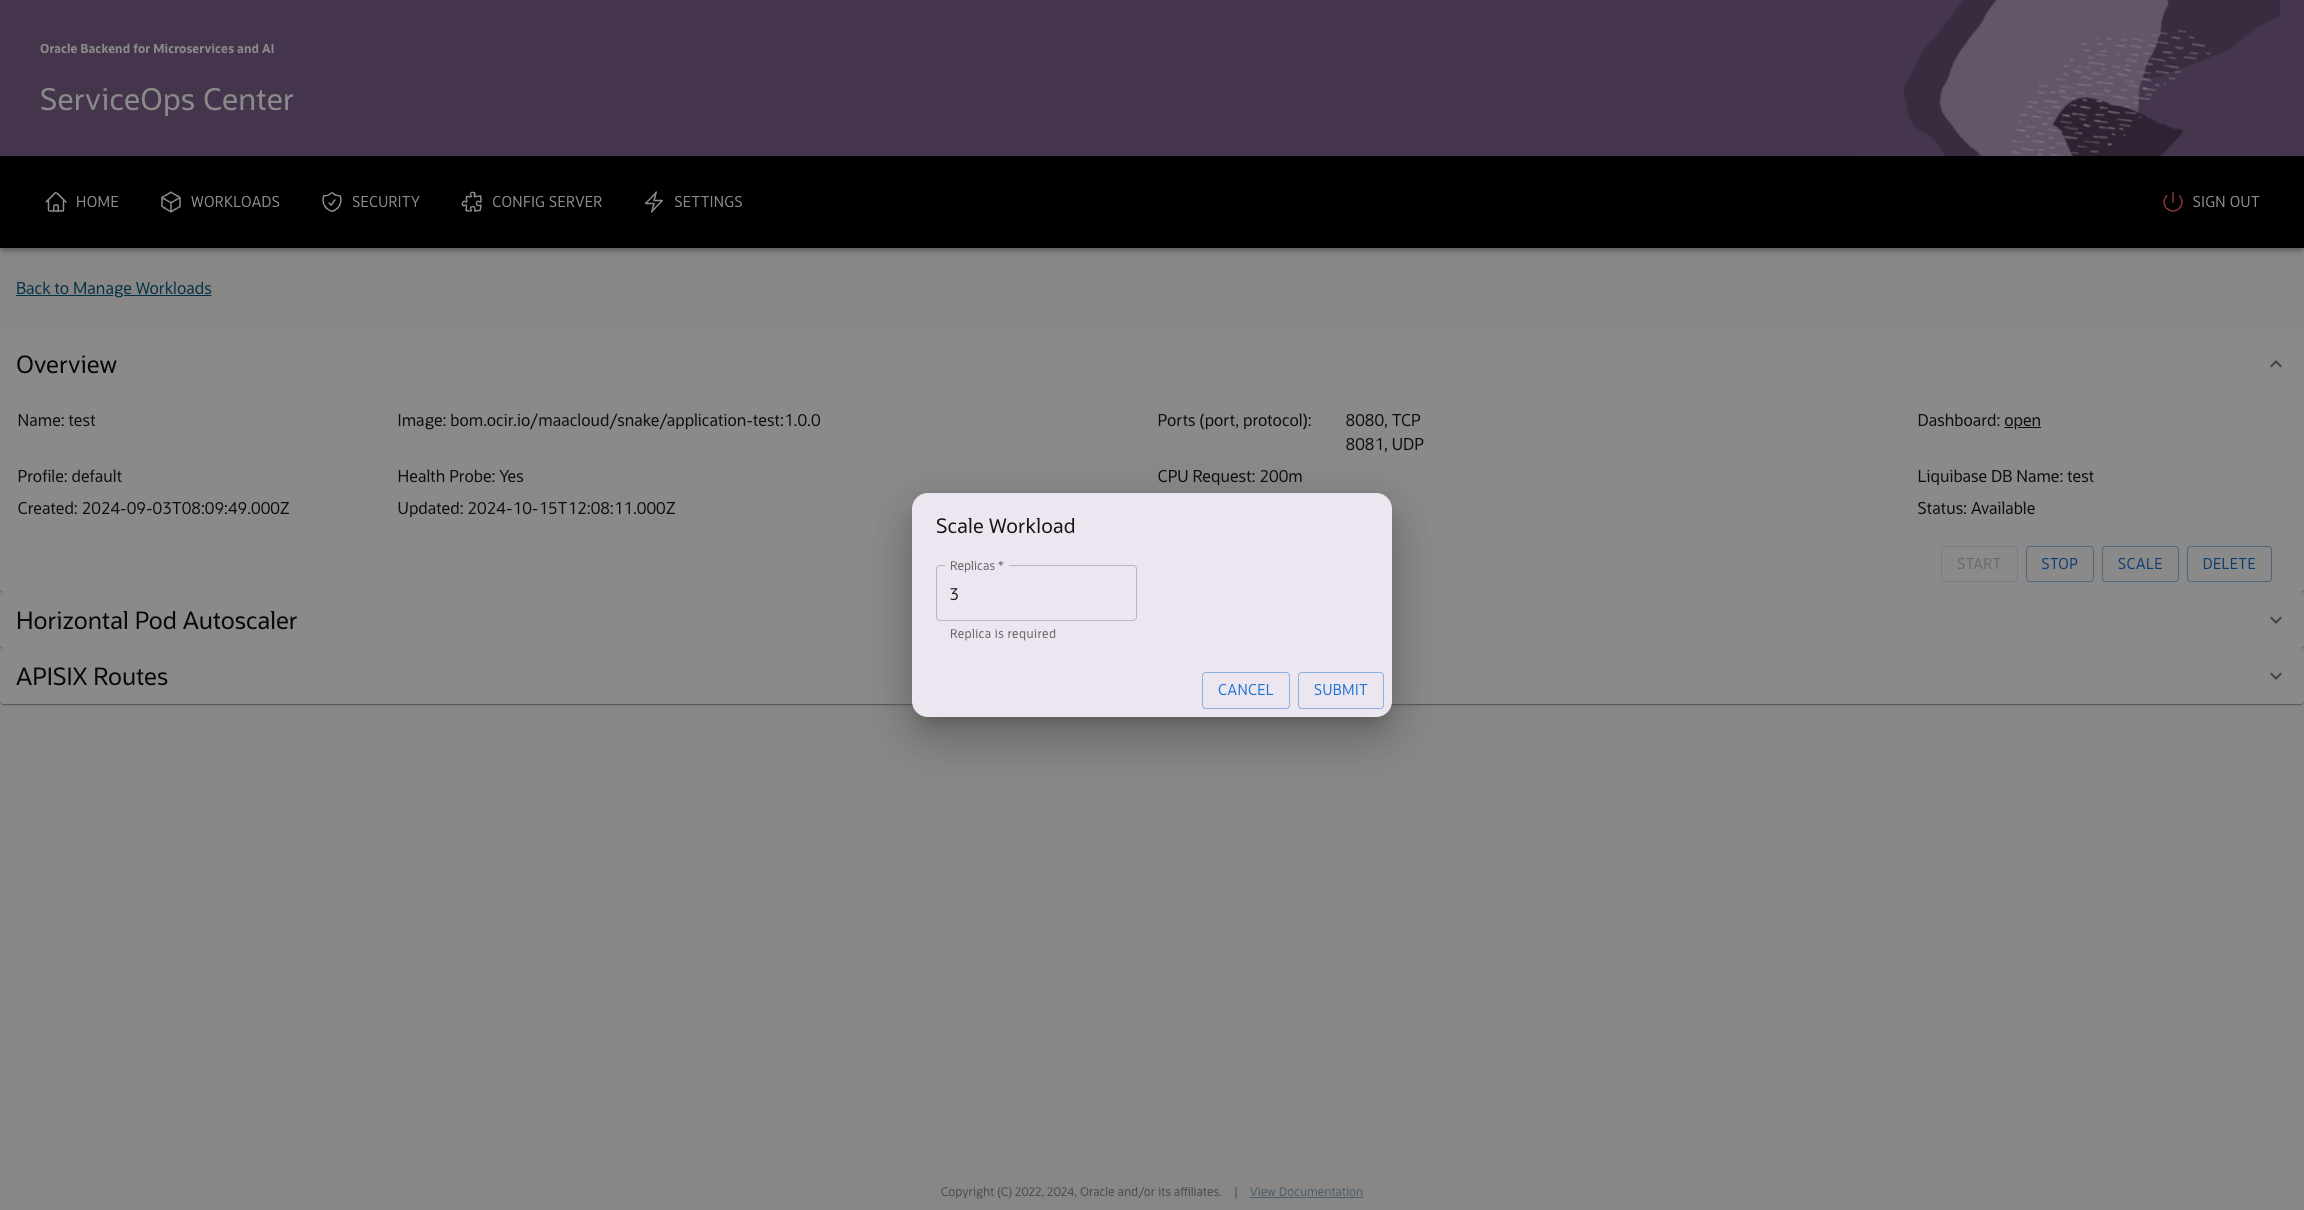
The Overview section also provides buttons to control state of the workload. You can click START to start a workload which is currently unavailable. Click STOP to stop a running workload. DELETE can be used to permanently remove a workload from the cluster.
To scale the workload to a desired number of replicas, click SCALE and enter the number of replicas.
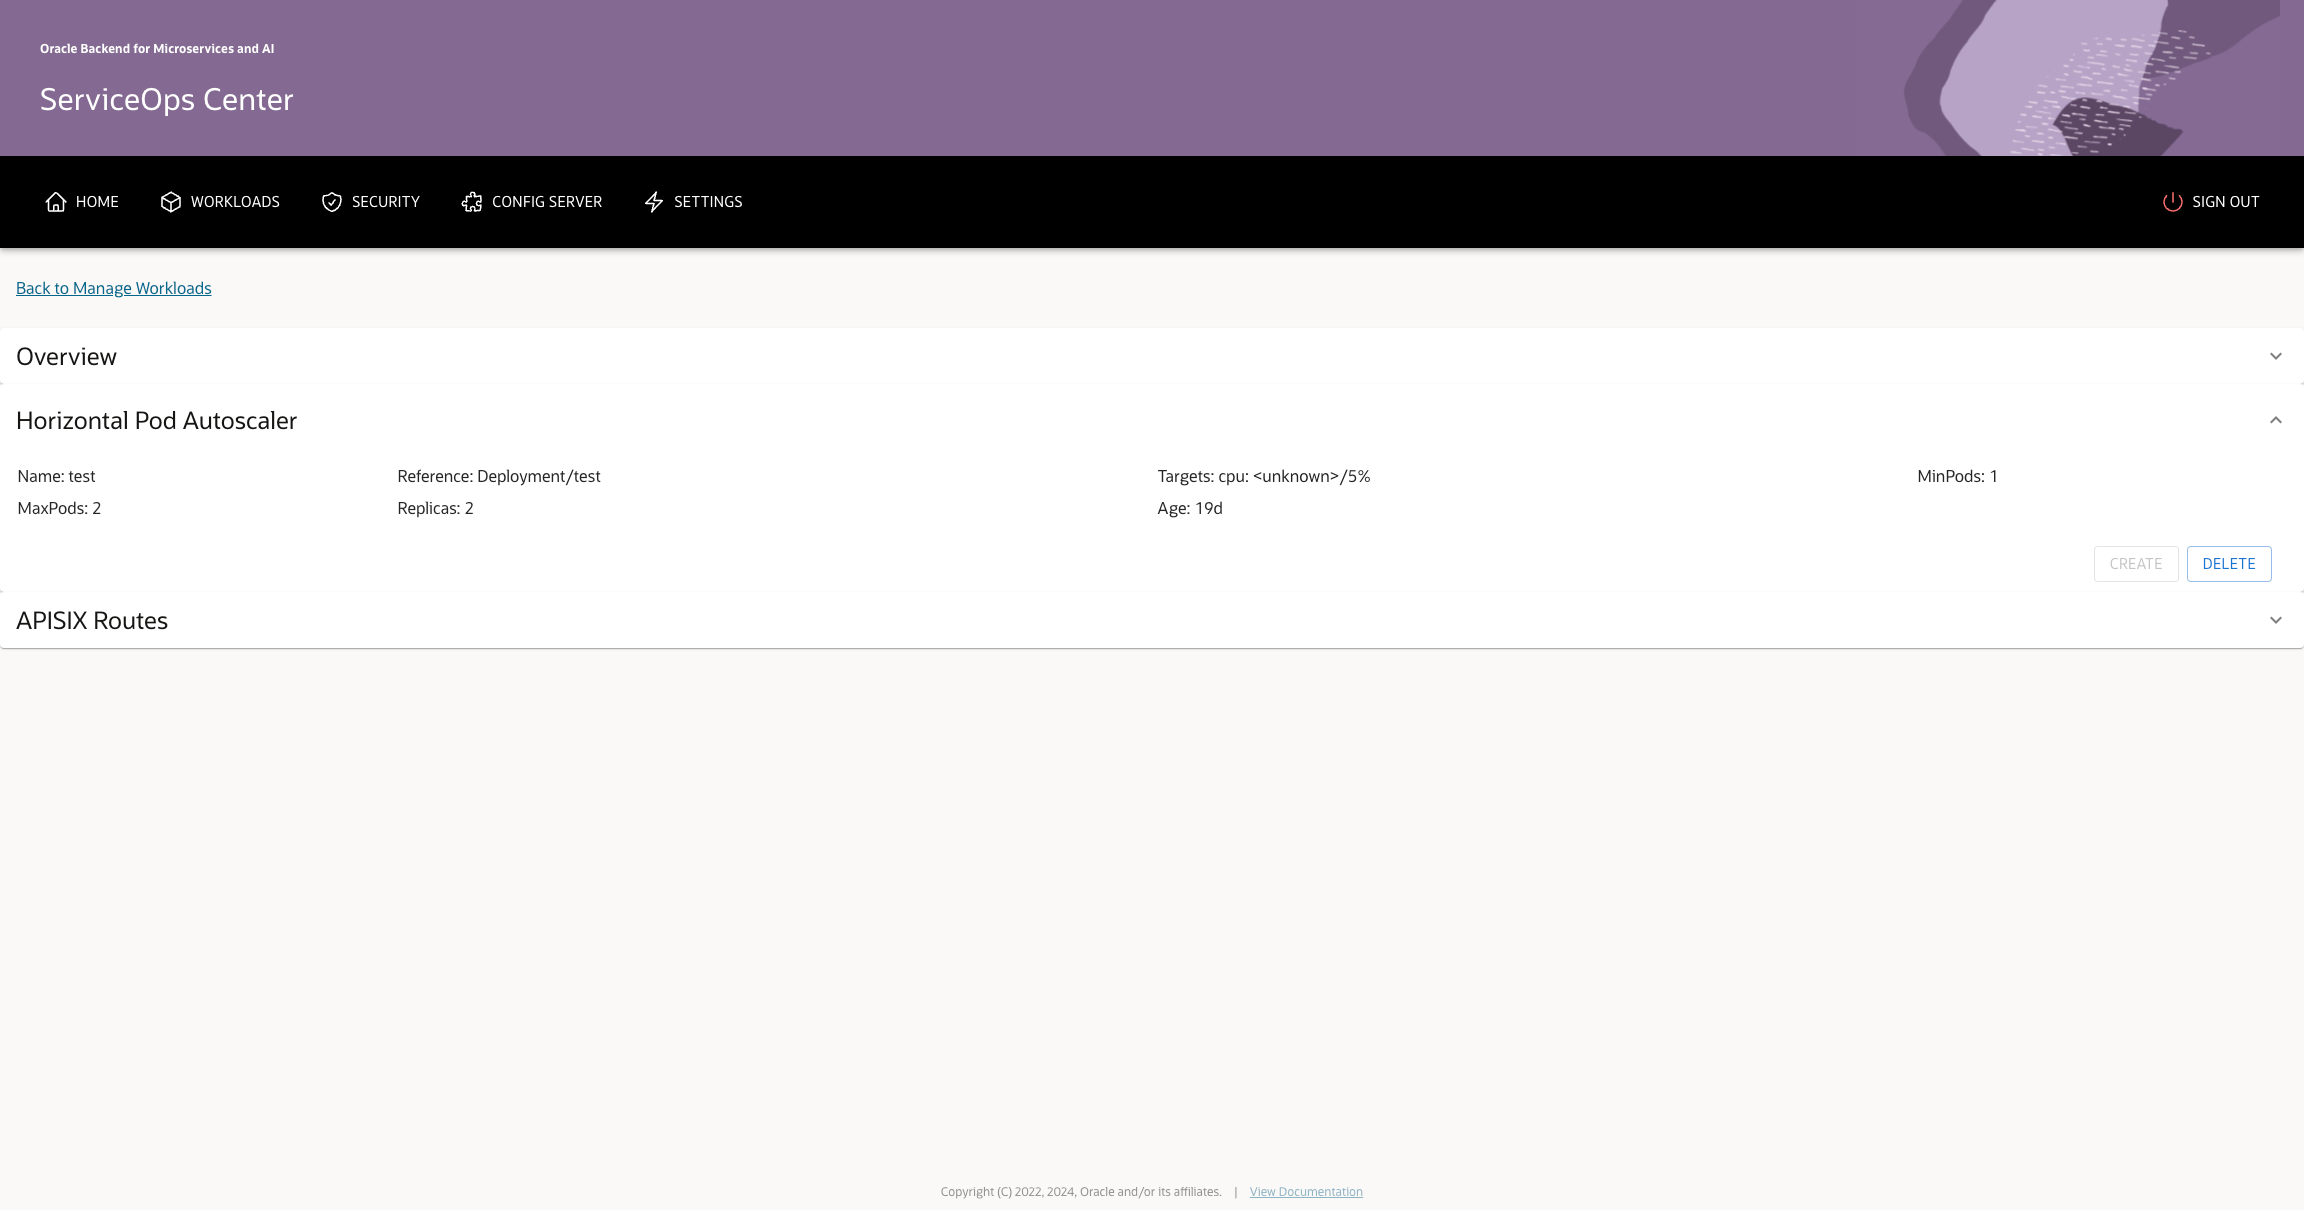
The Horizontal Pod Autoscaler section contains basic details of the Horizontal Pod Autocaler or HPA present for a workload such as
- Name
- Reference to target deployment
- Target metric value
- Minimum number of pods
- Maximum number of pods
- Current replicas
- Age of HPA
If a HPA exists, DELETE button can be used to delete the HPA.
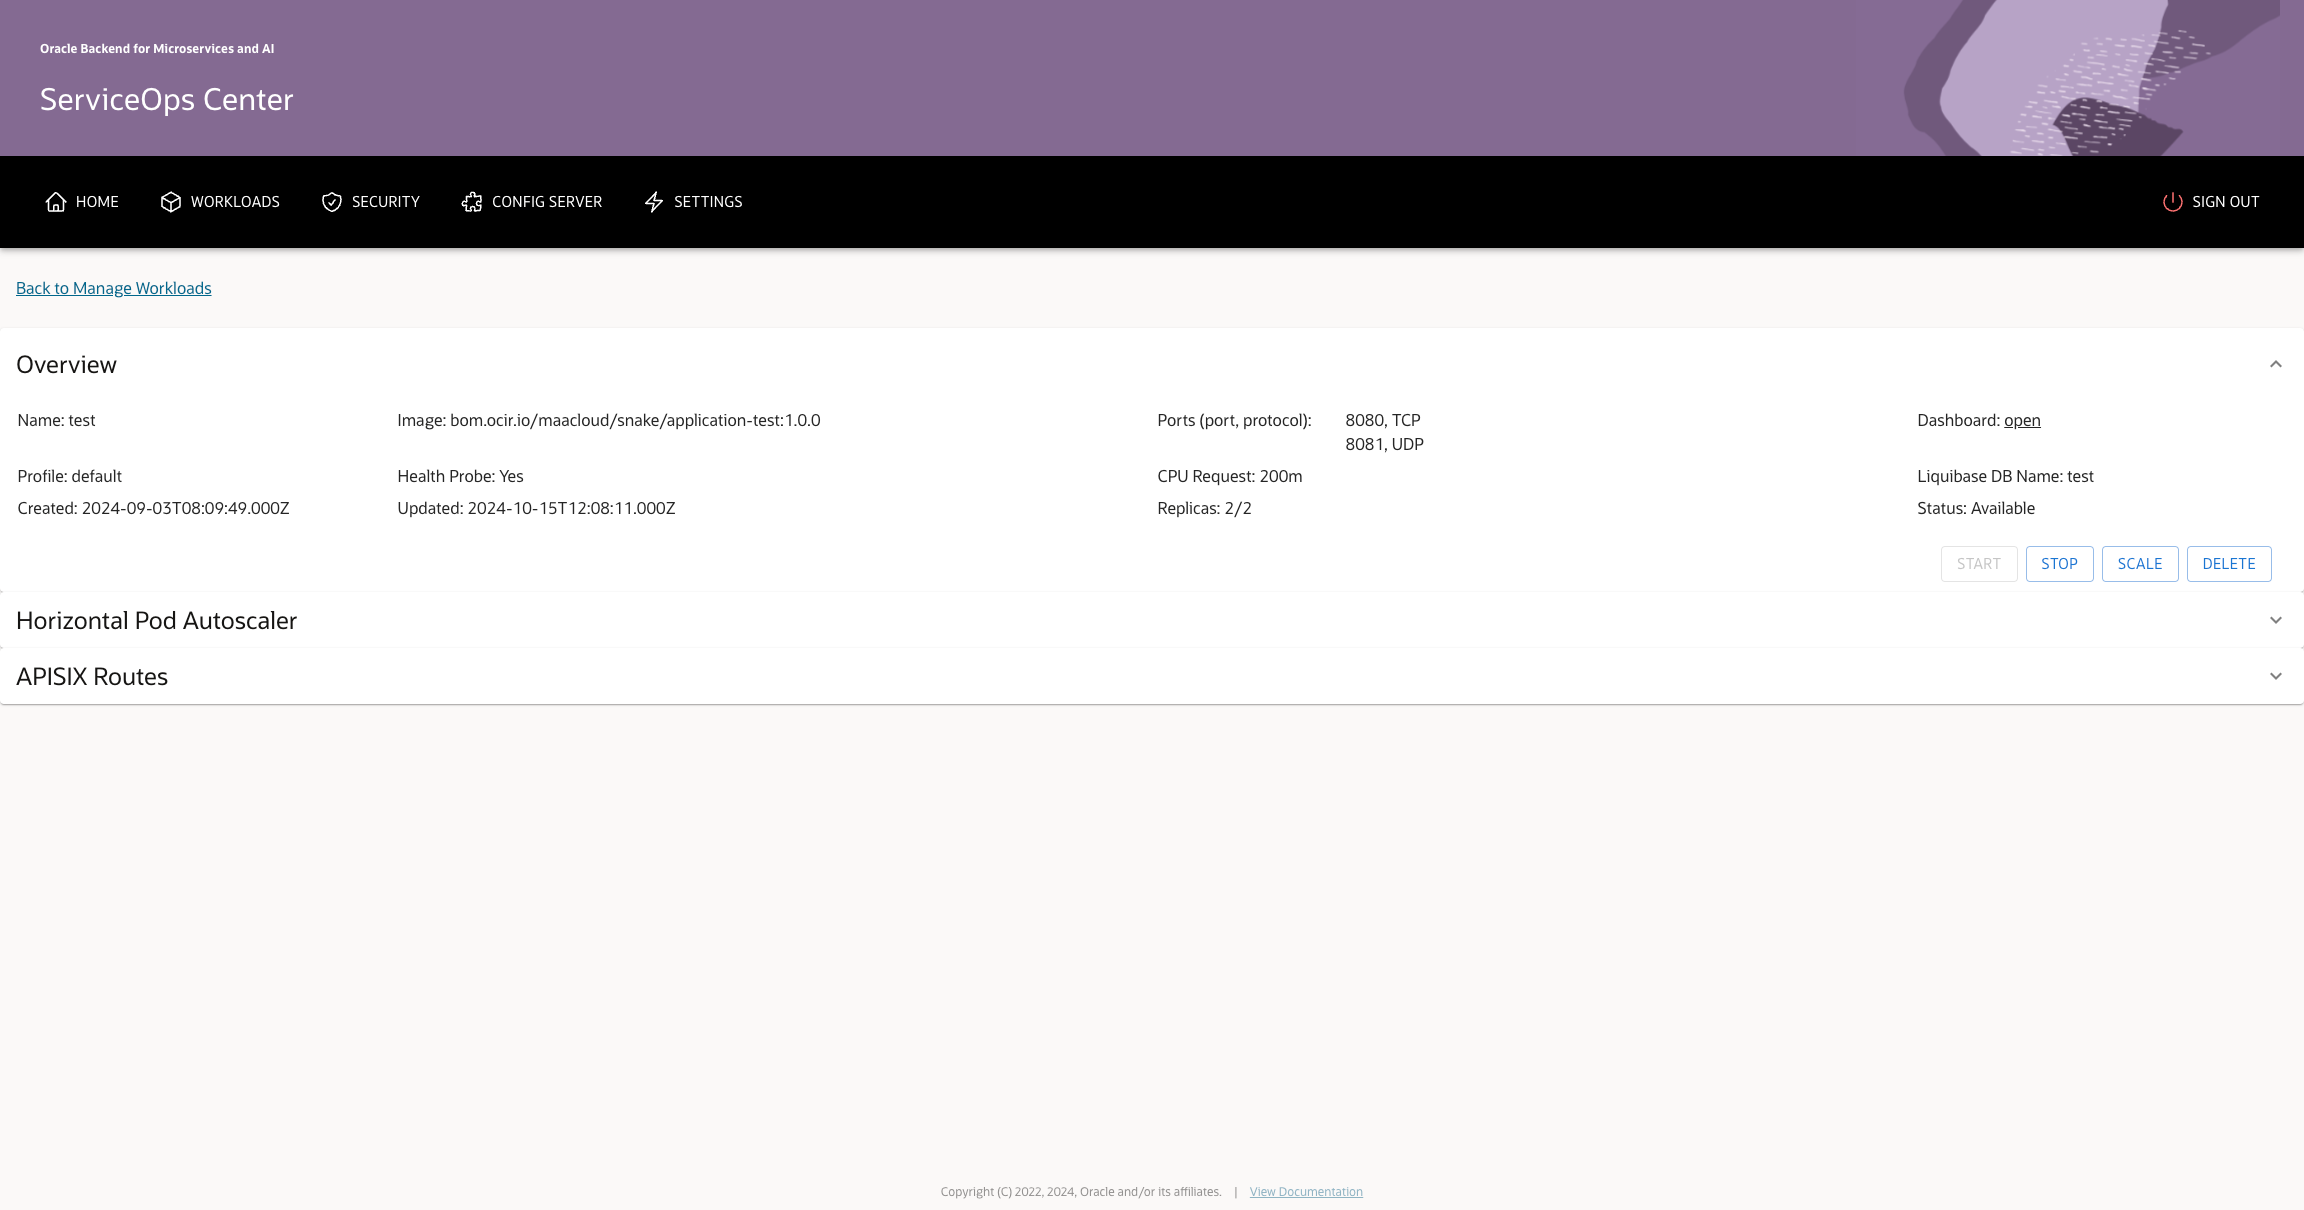
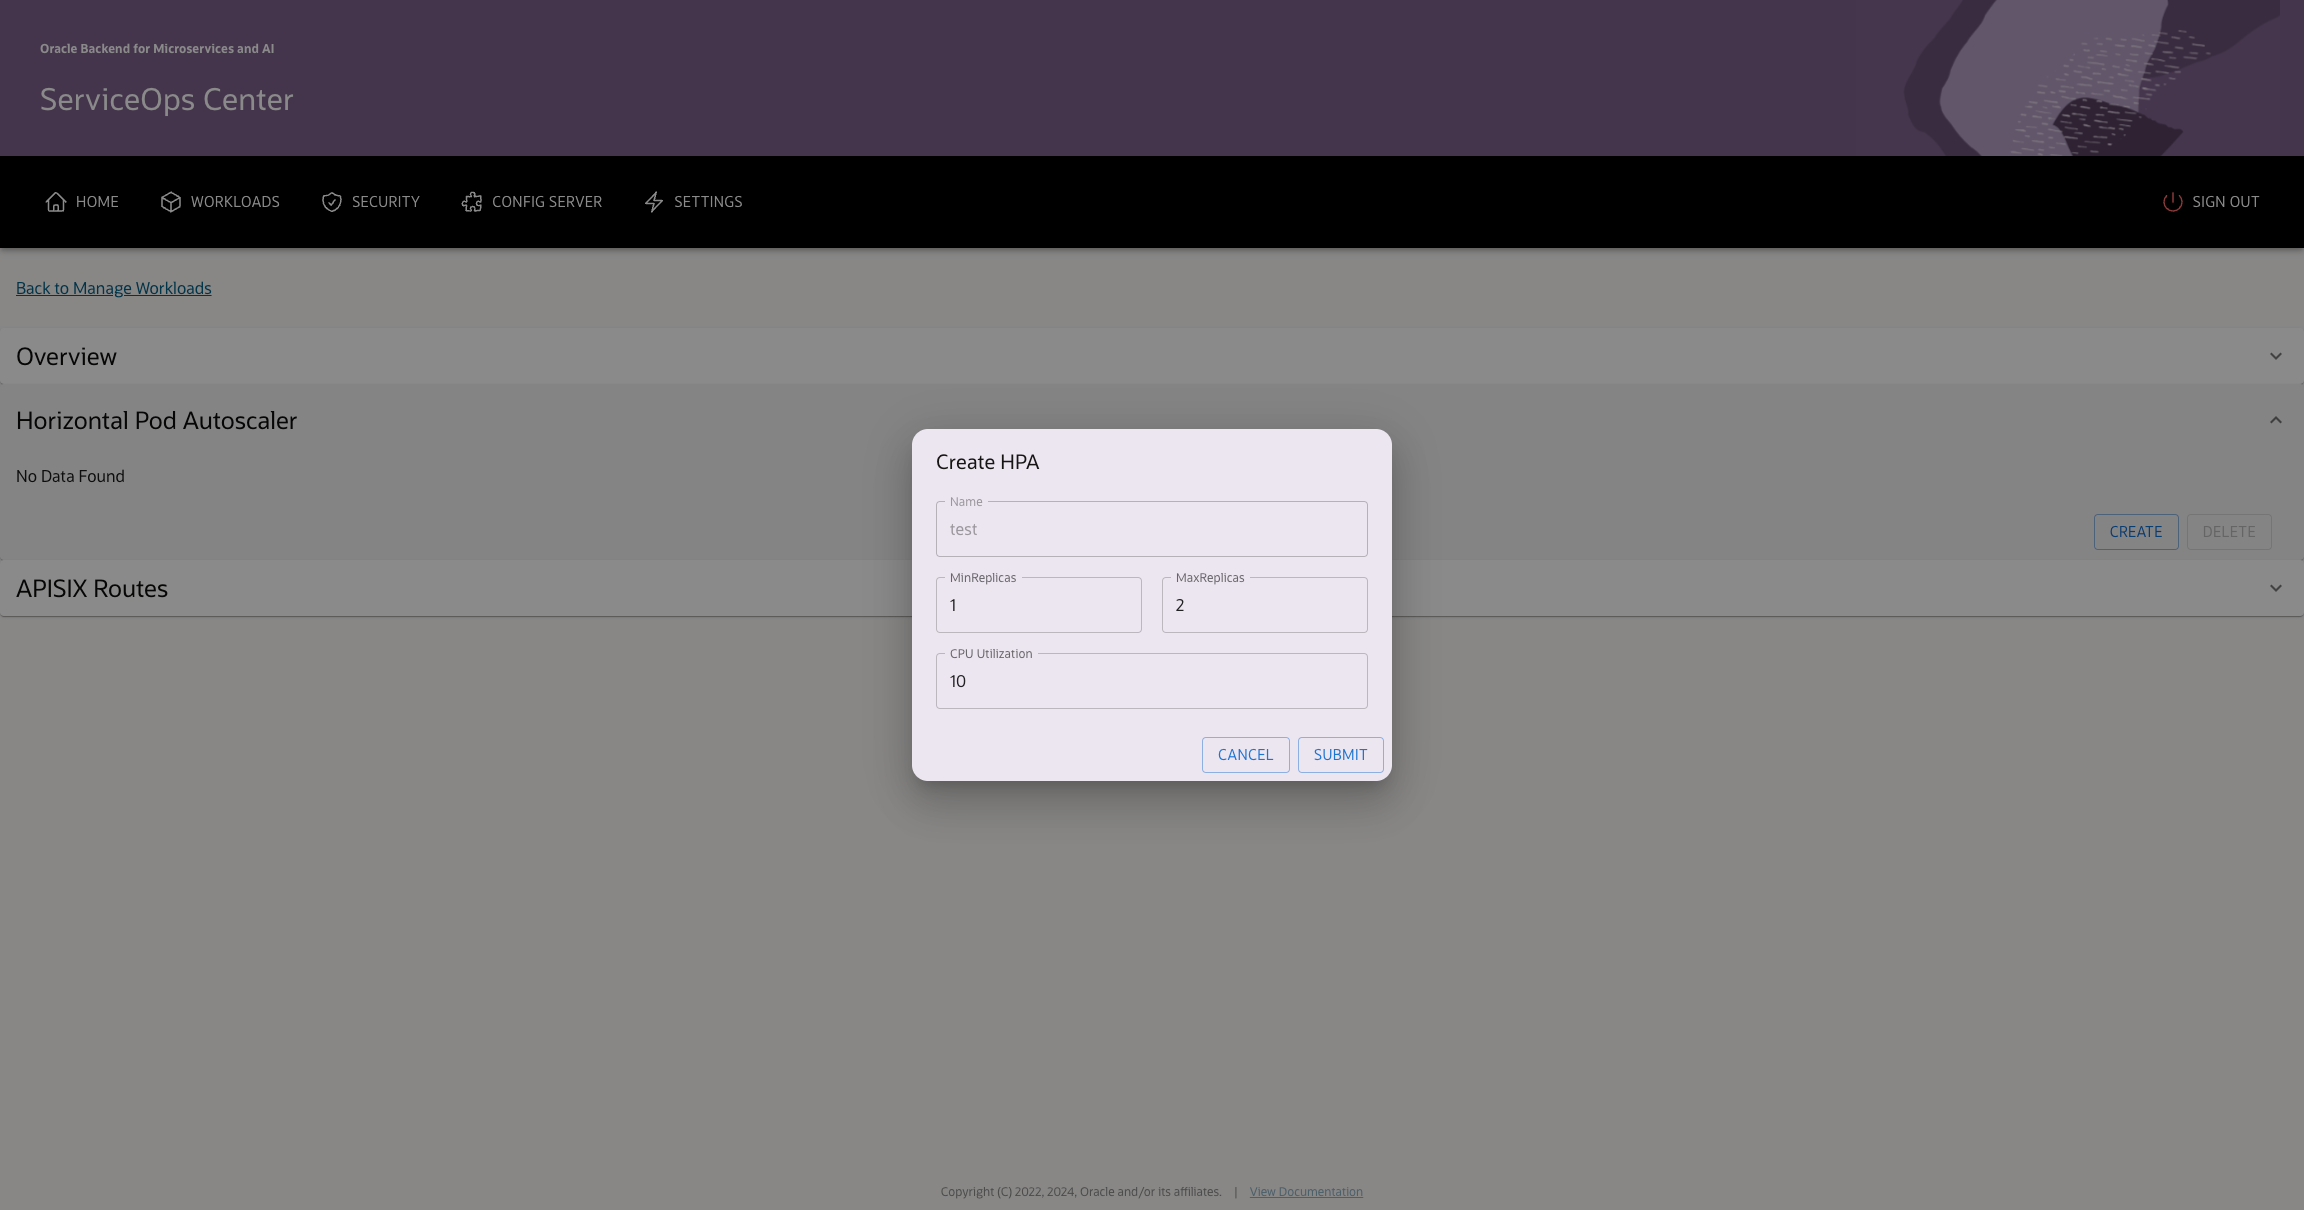
If no HPA exists for the workload, you can create one by clicking the CREATE button and entering HPA details.
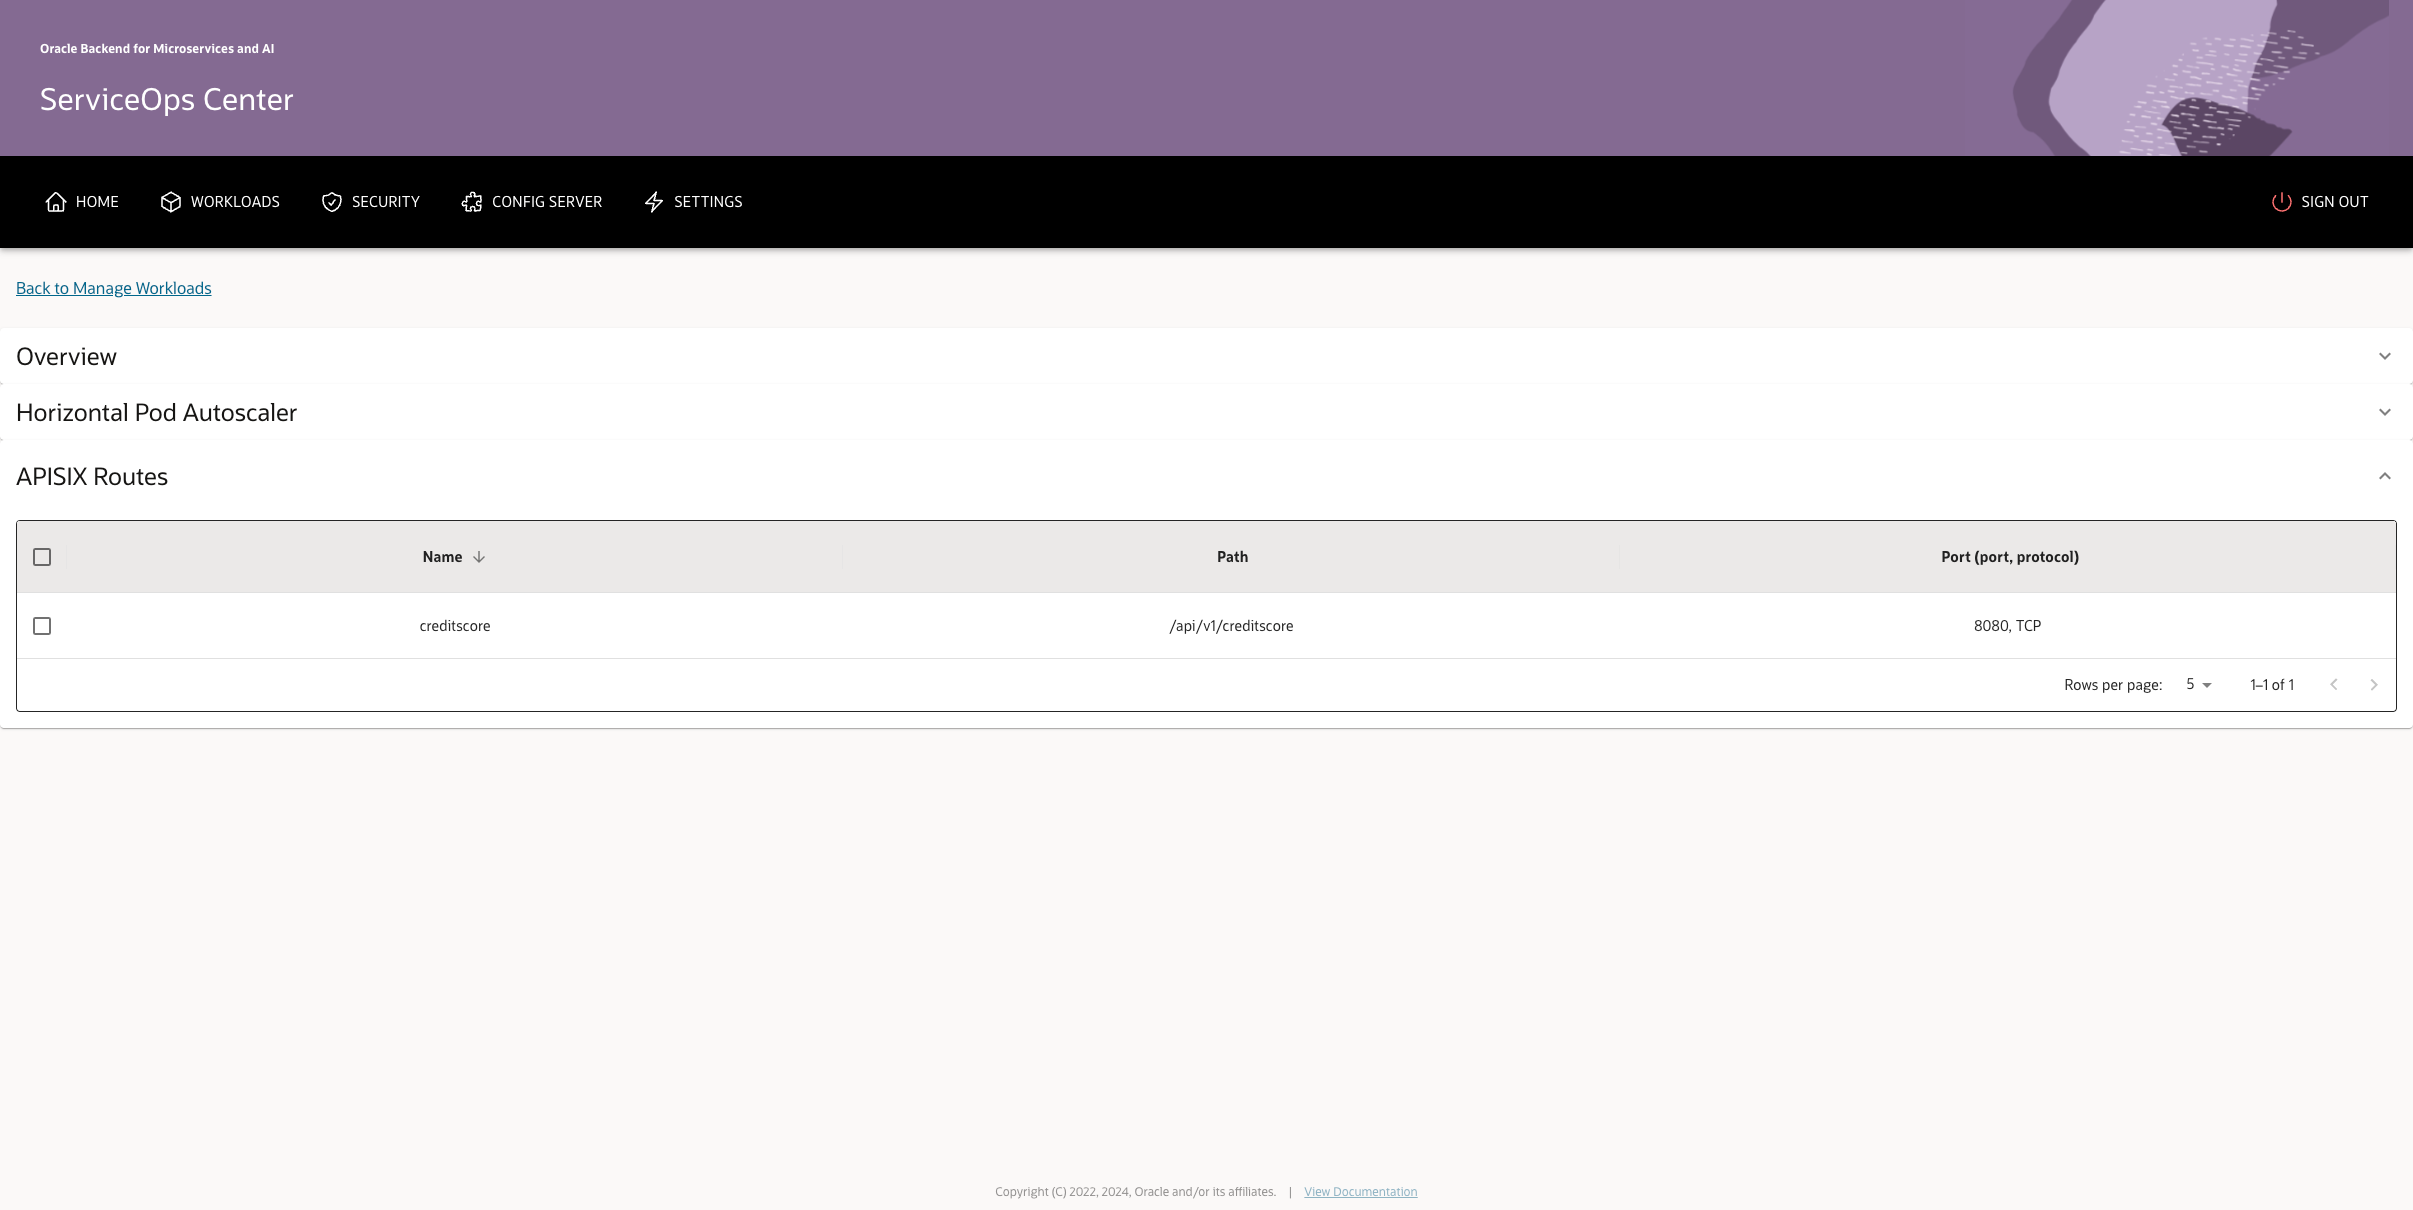
The APISIX Routes section Name, Path and Target port of APISIX Route present for a workload.
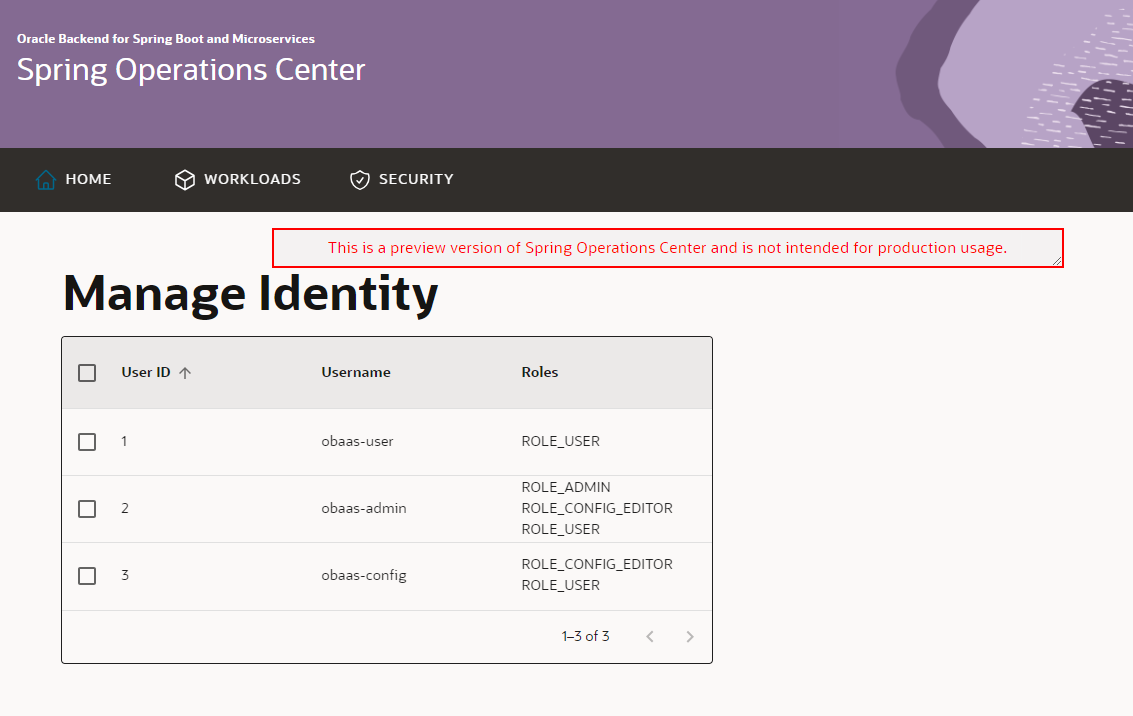
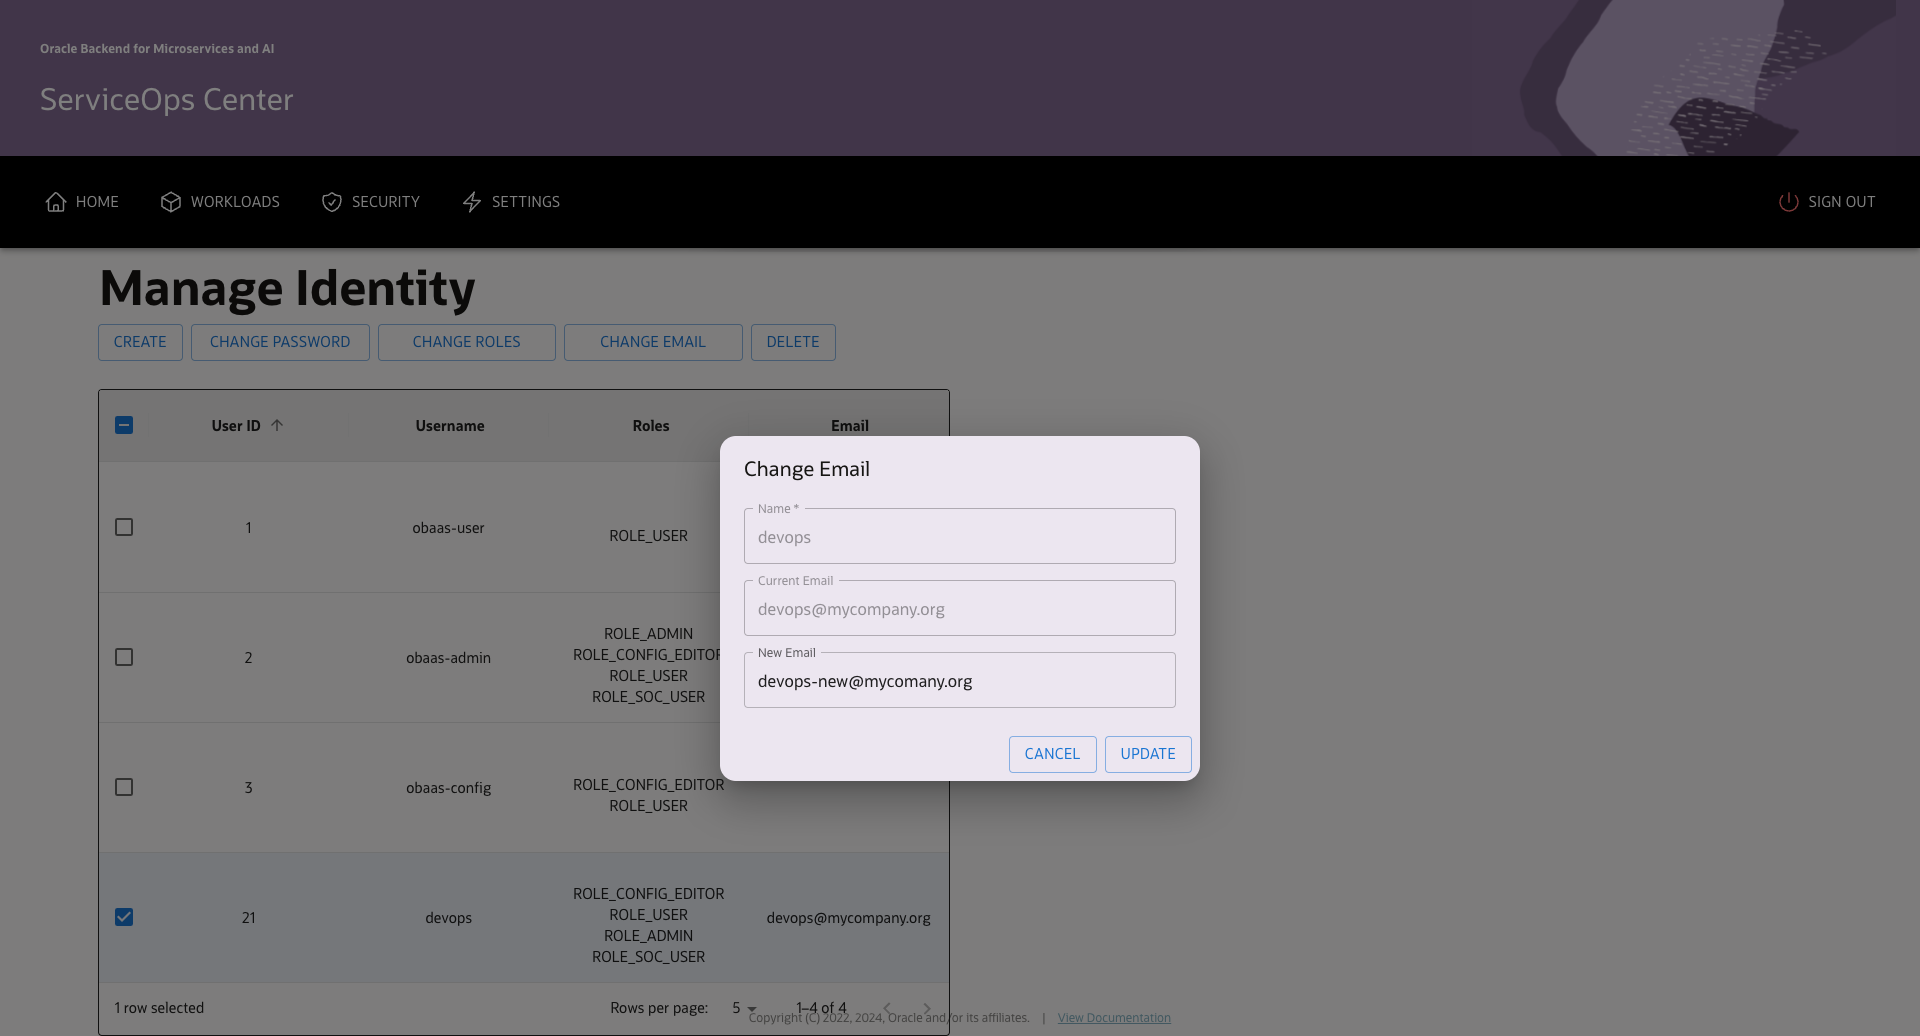
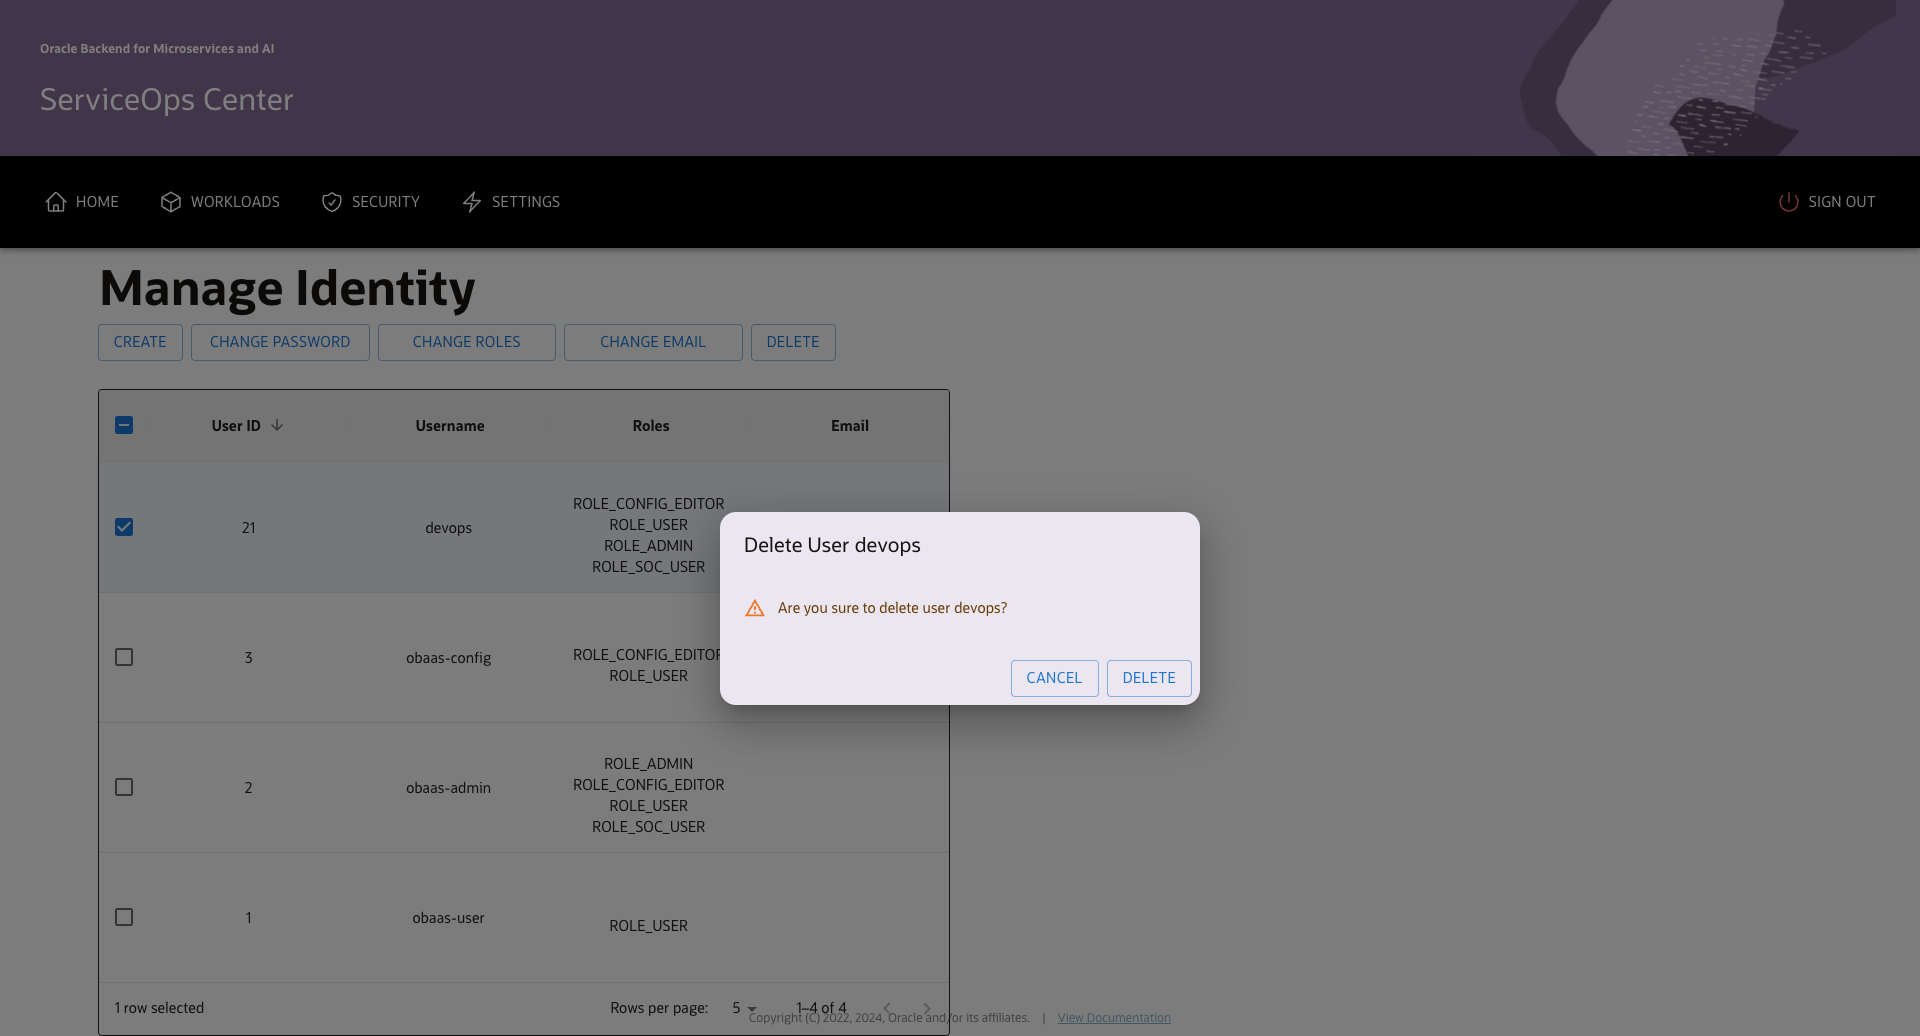
The Manage Identity screen is accessible from the Security menu and allows you to view and edit information about the users and roles defined in the Authorization Server included in the platform.
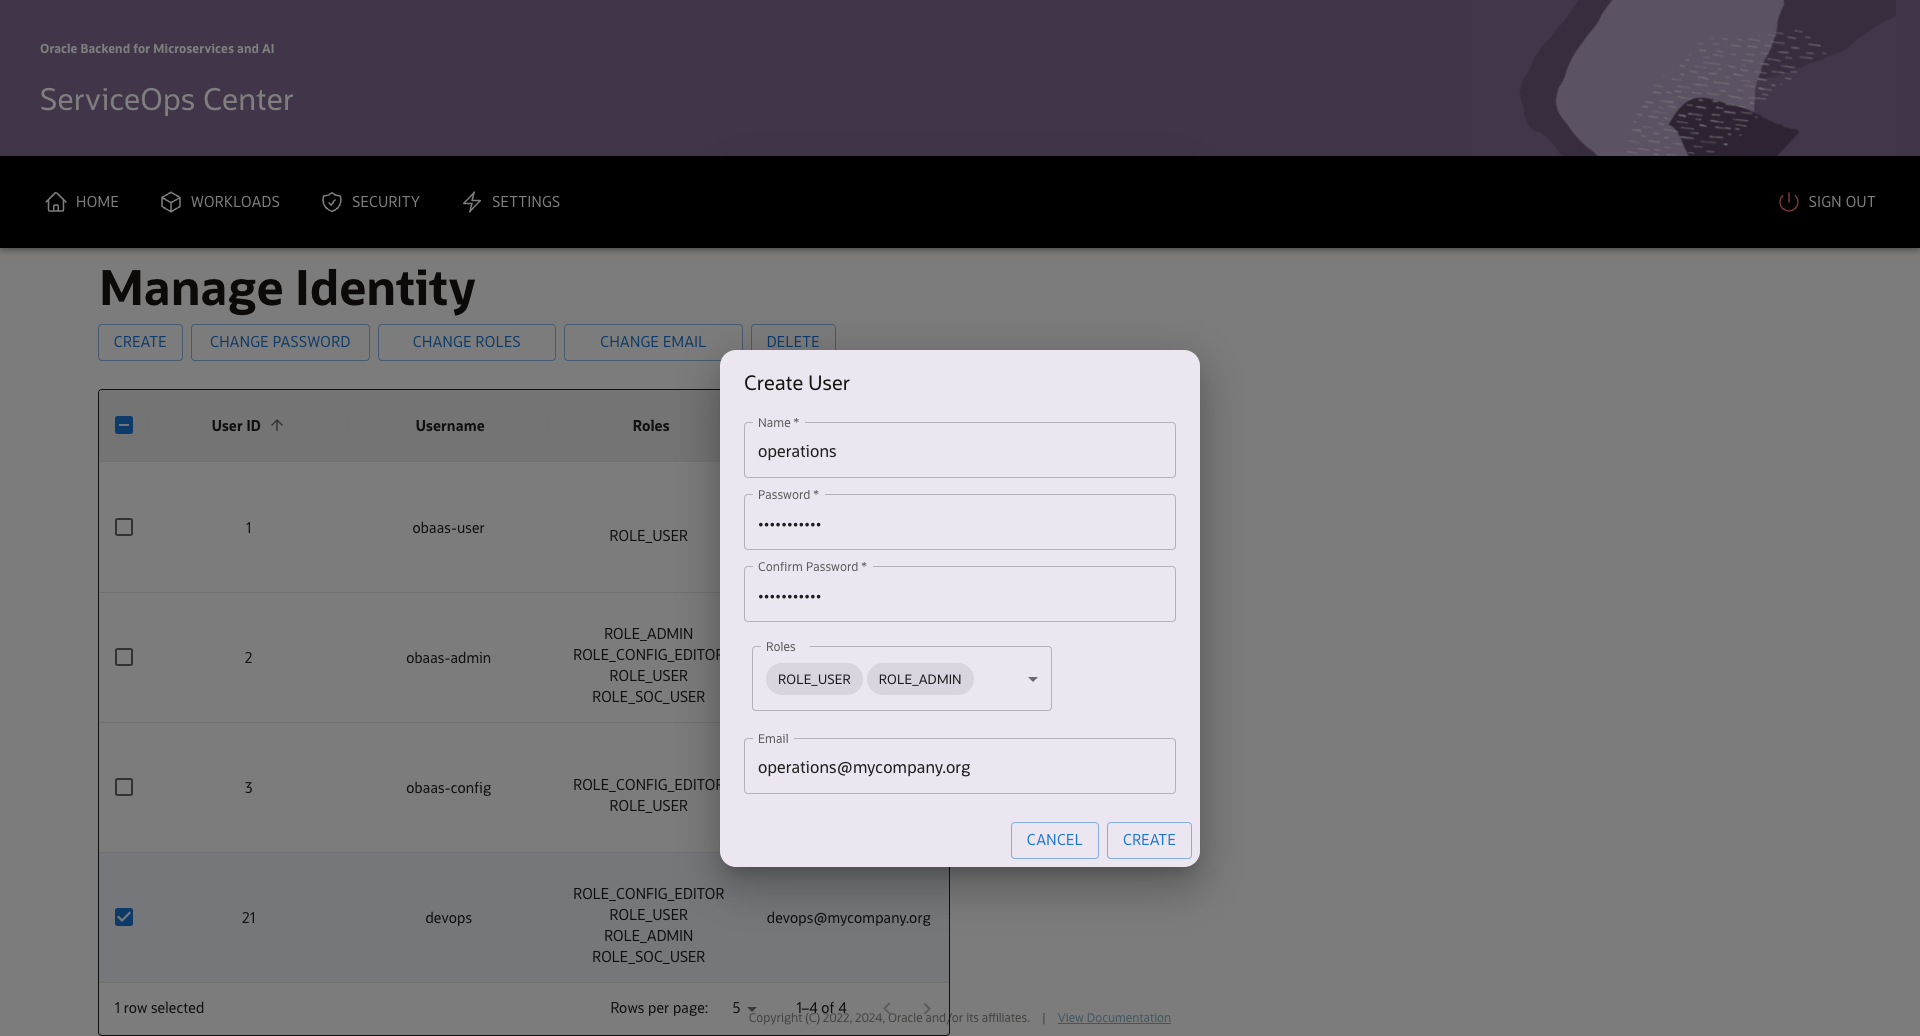
You can click “CREATE” to create a new user and specify the password, roles and email.
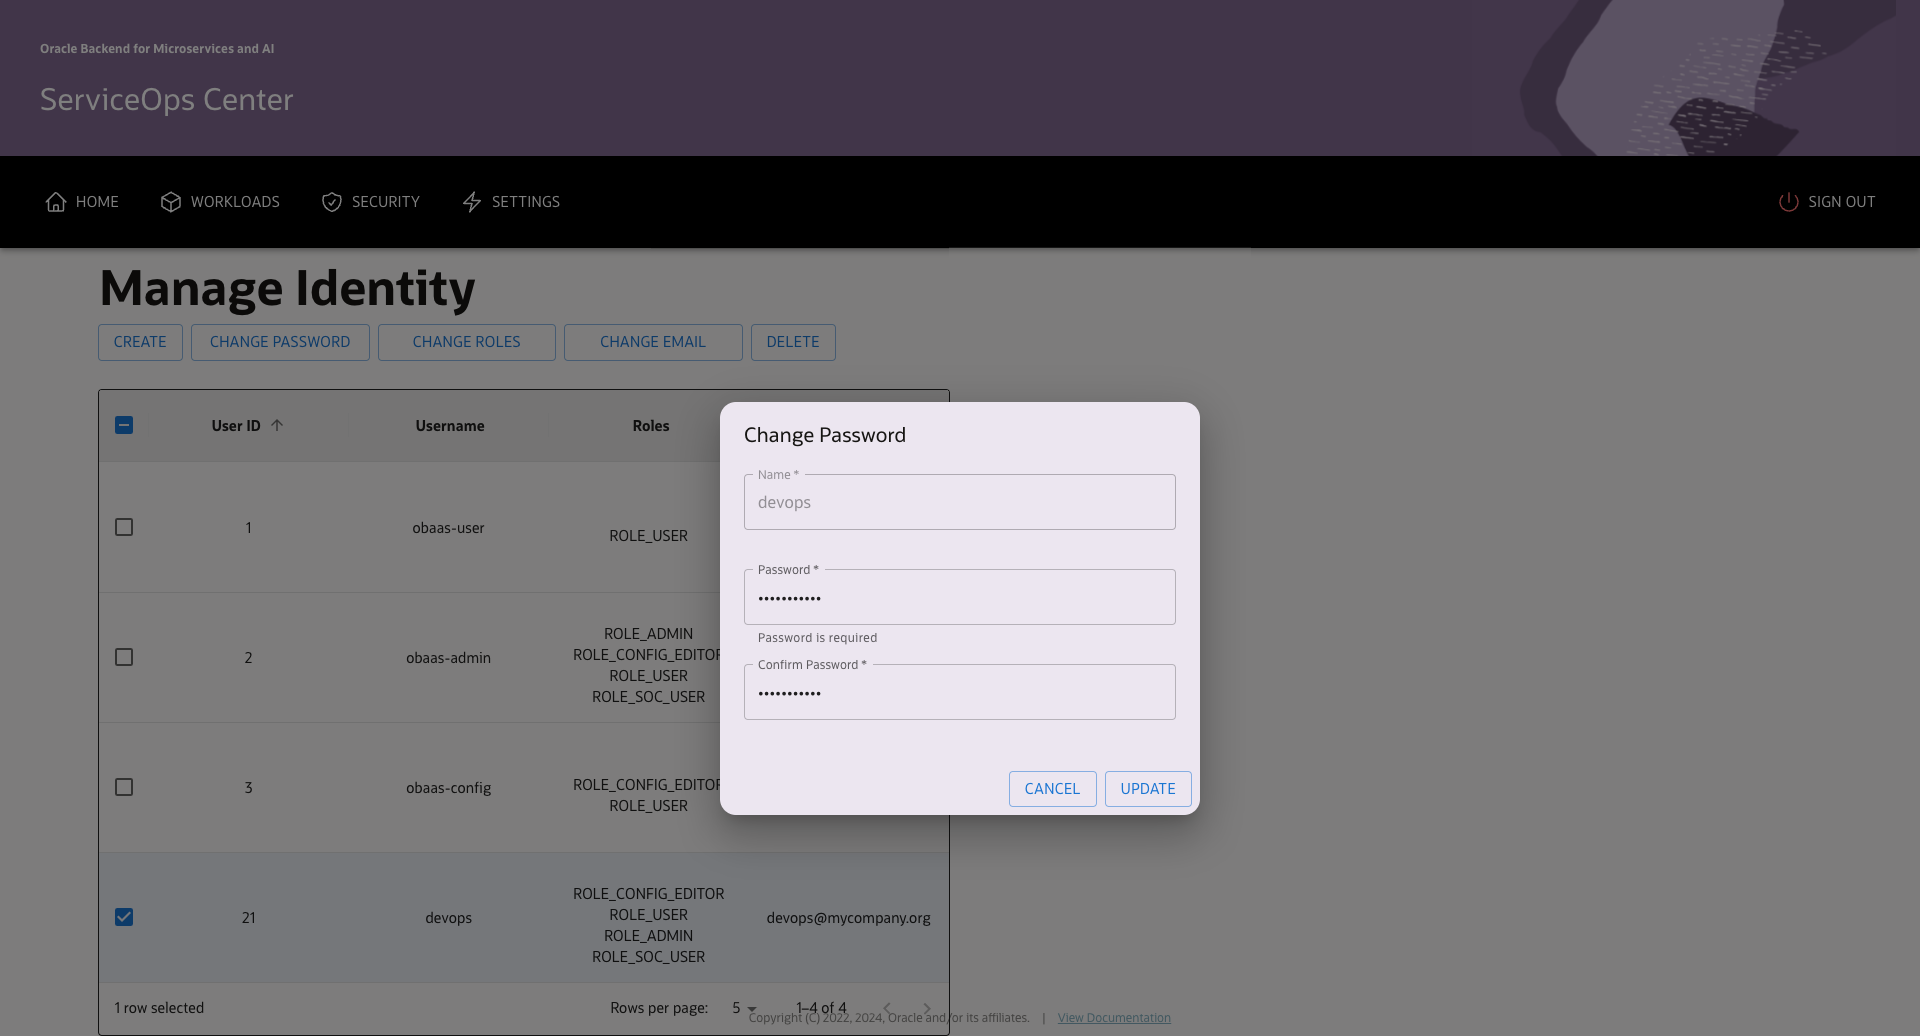
You can select a user and click “CHANGE PASSWORD” to change password.
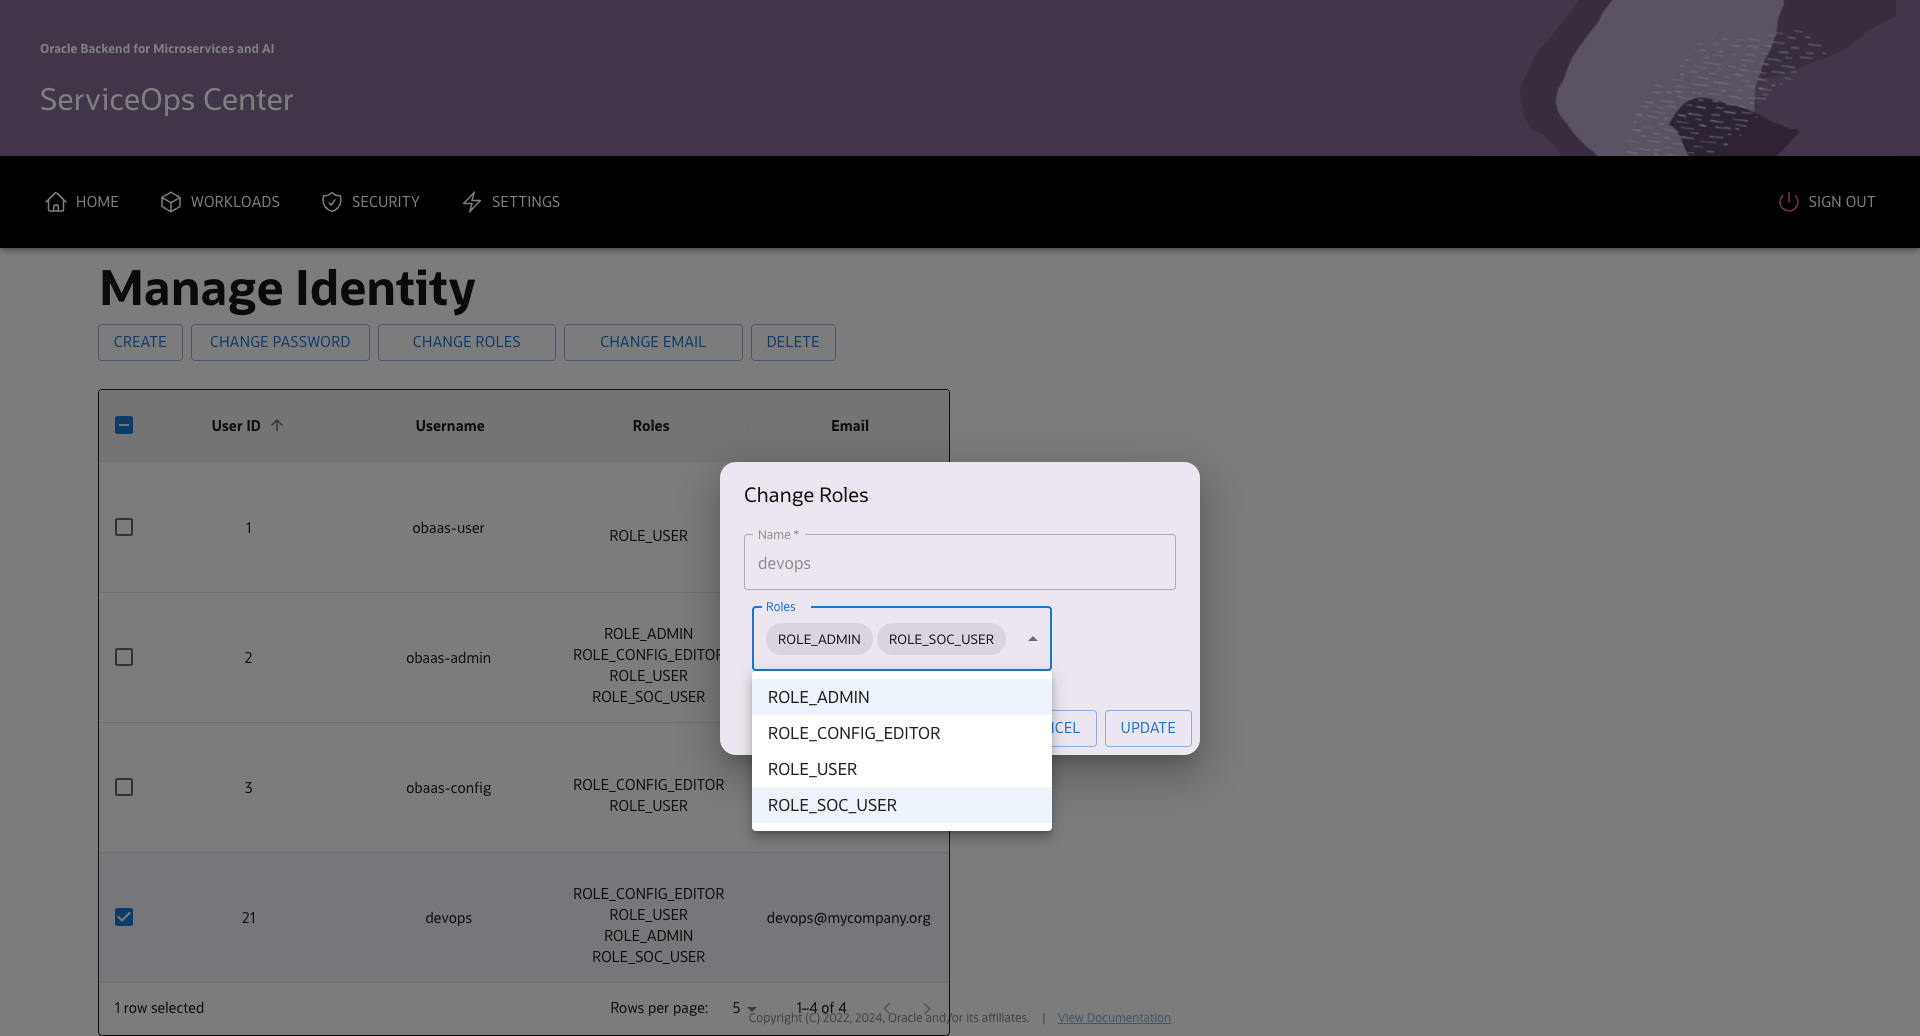
You can select a user and click “CHANGE ROLES” to add/remove roles.
You can select a user and click “CHANGE EMAIL” to change Email.
You can select one or more users and click “DELETE” to delete selected user(s).
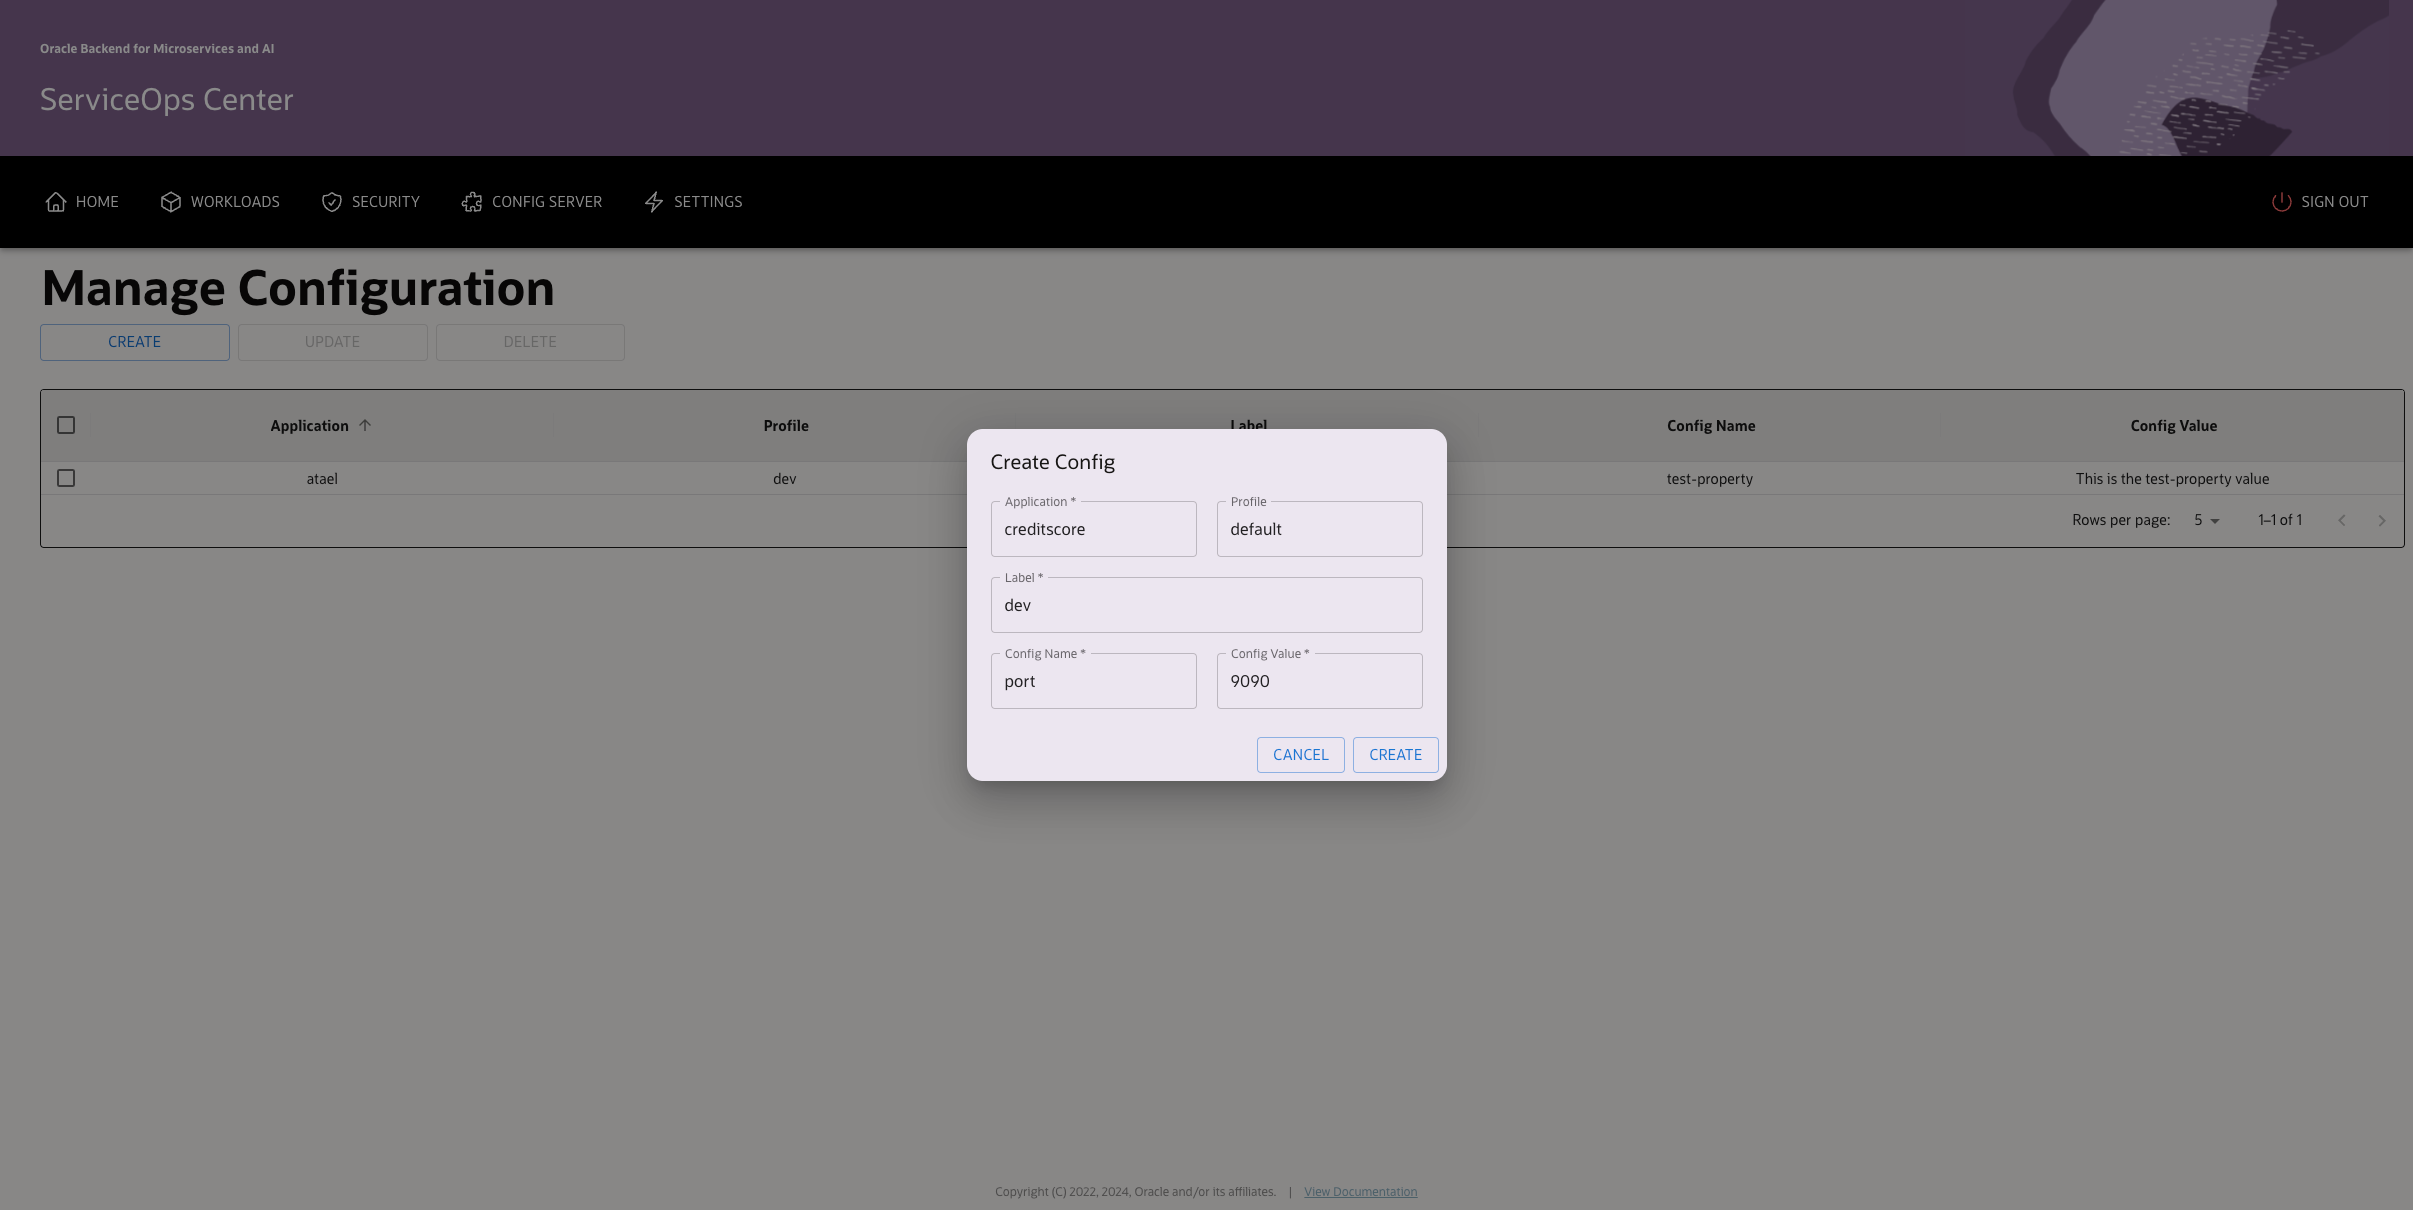
The Manage Configuration screen is accessible from the Config-Server menu and allows you to view and edit external configuration in Spring Cloud Config server.
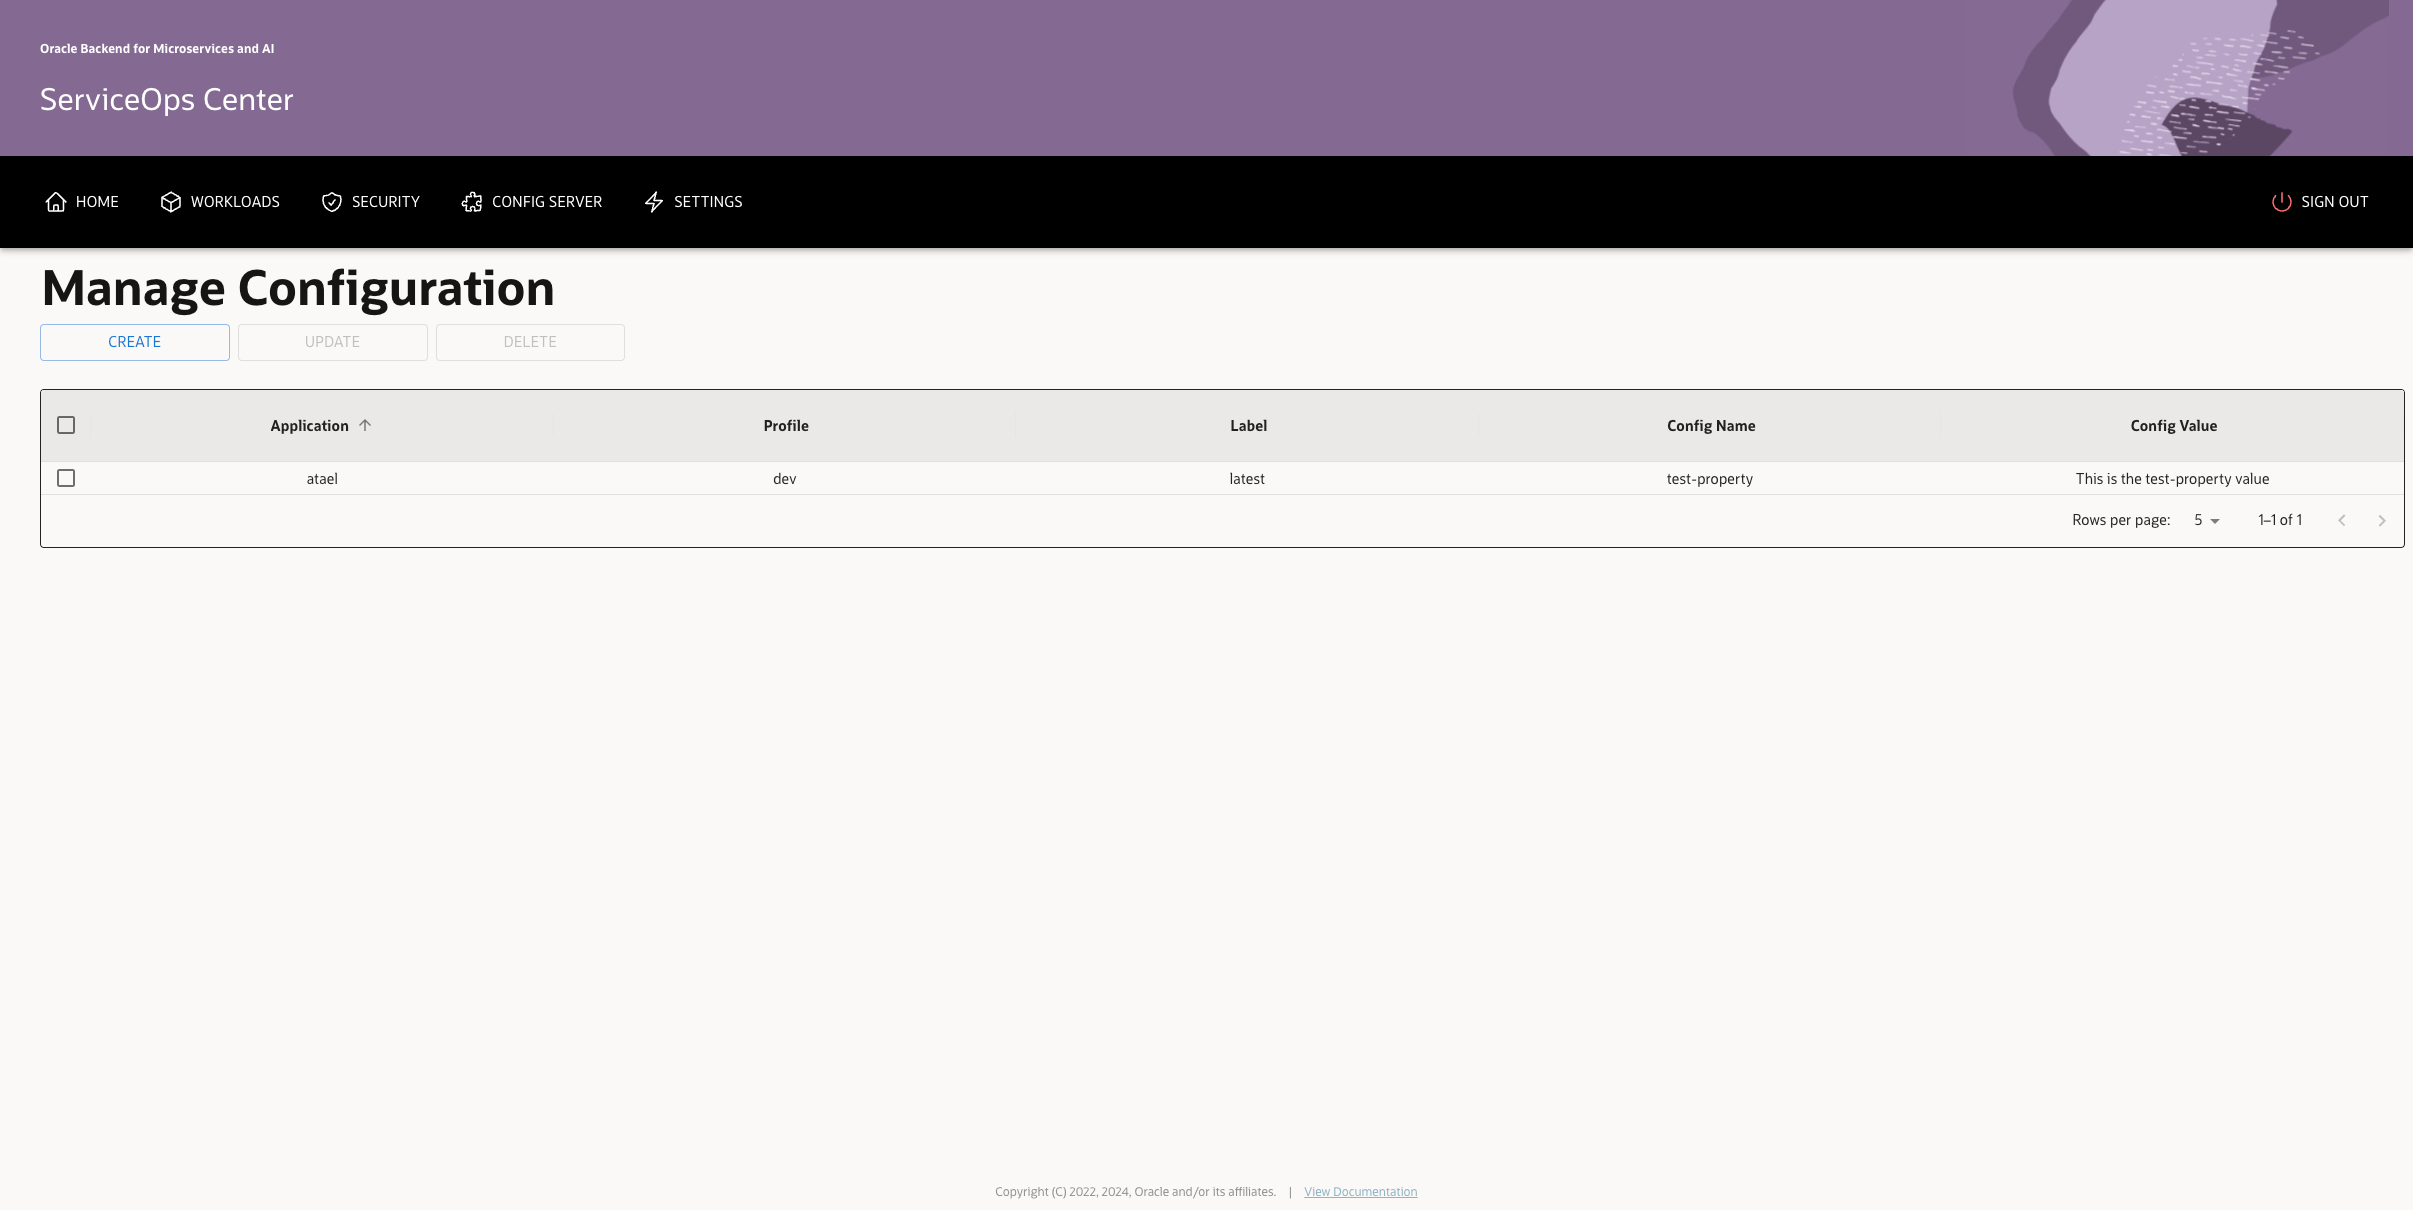
You can click “CREATE” to create a new configuration by specifying the application name, Spring profile, config label, key and its value.
You can select a configuration and click “UPDATE” to change its value.
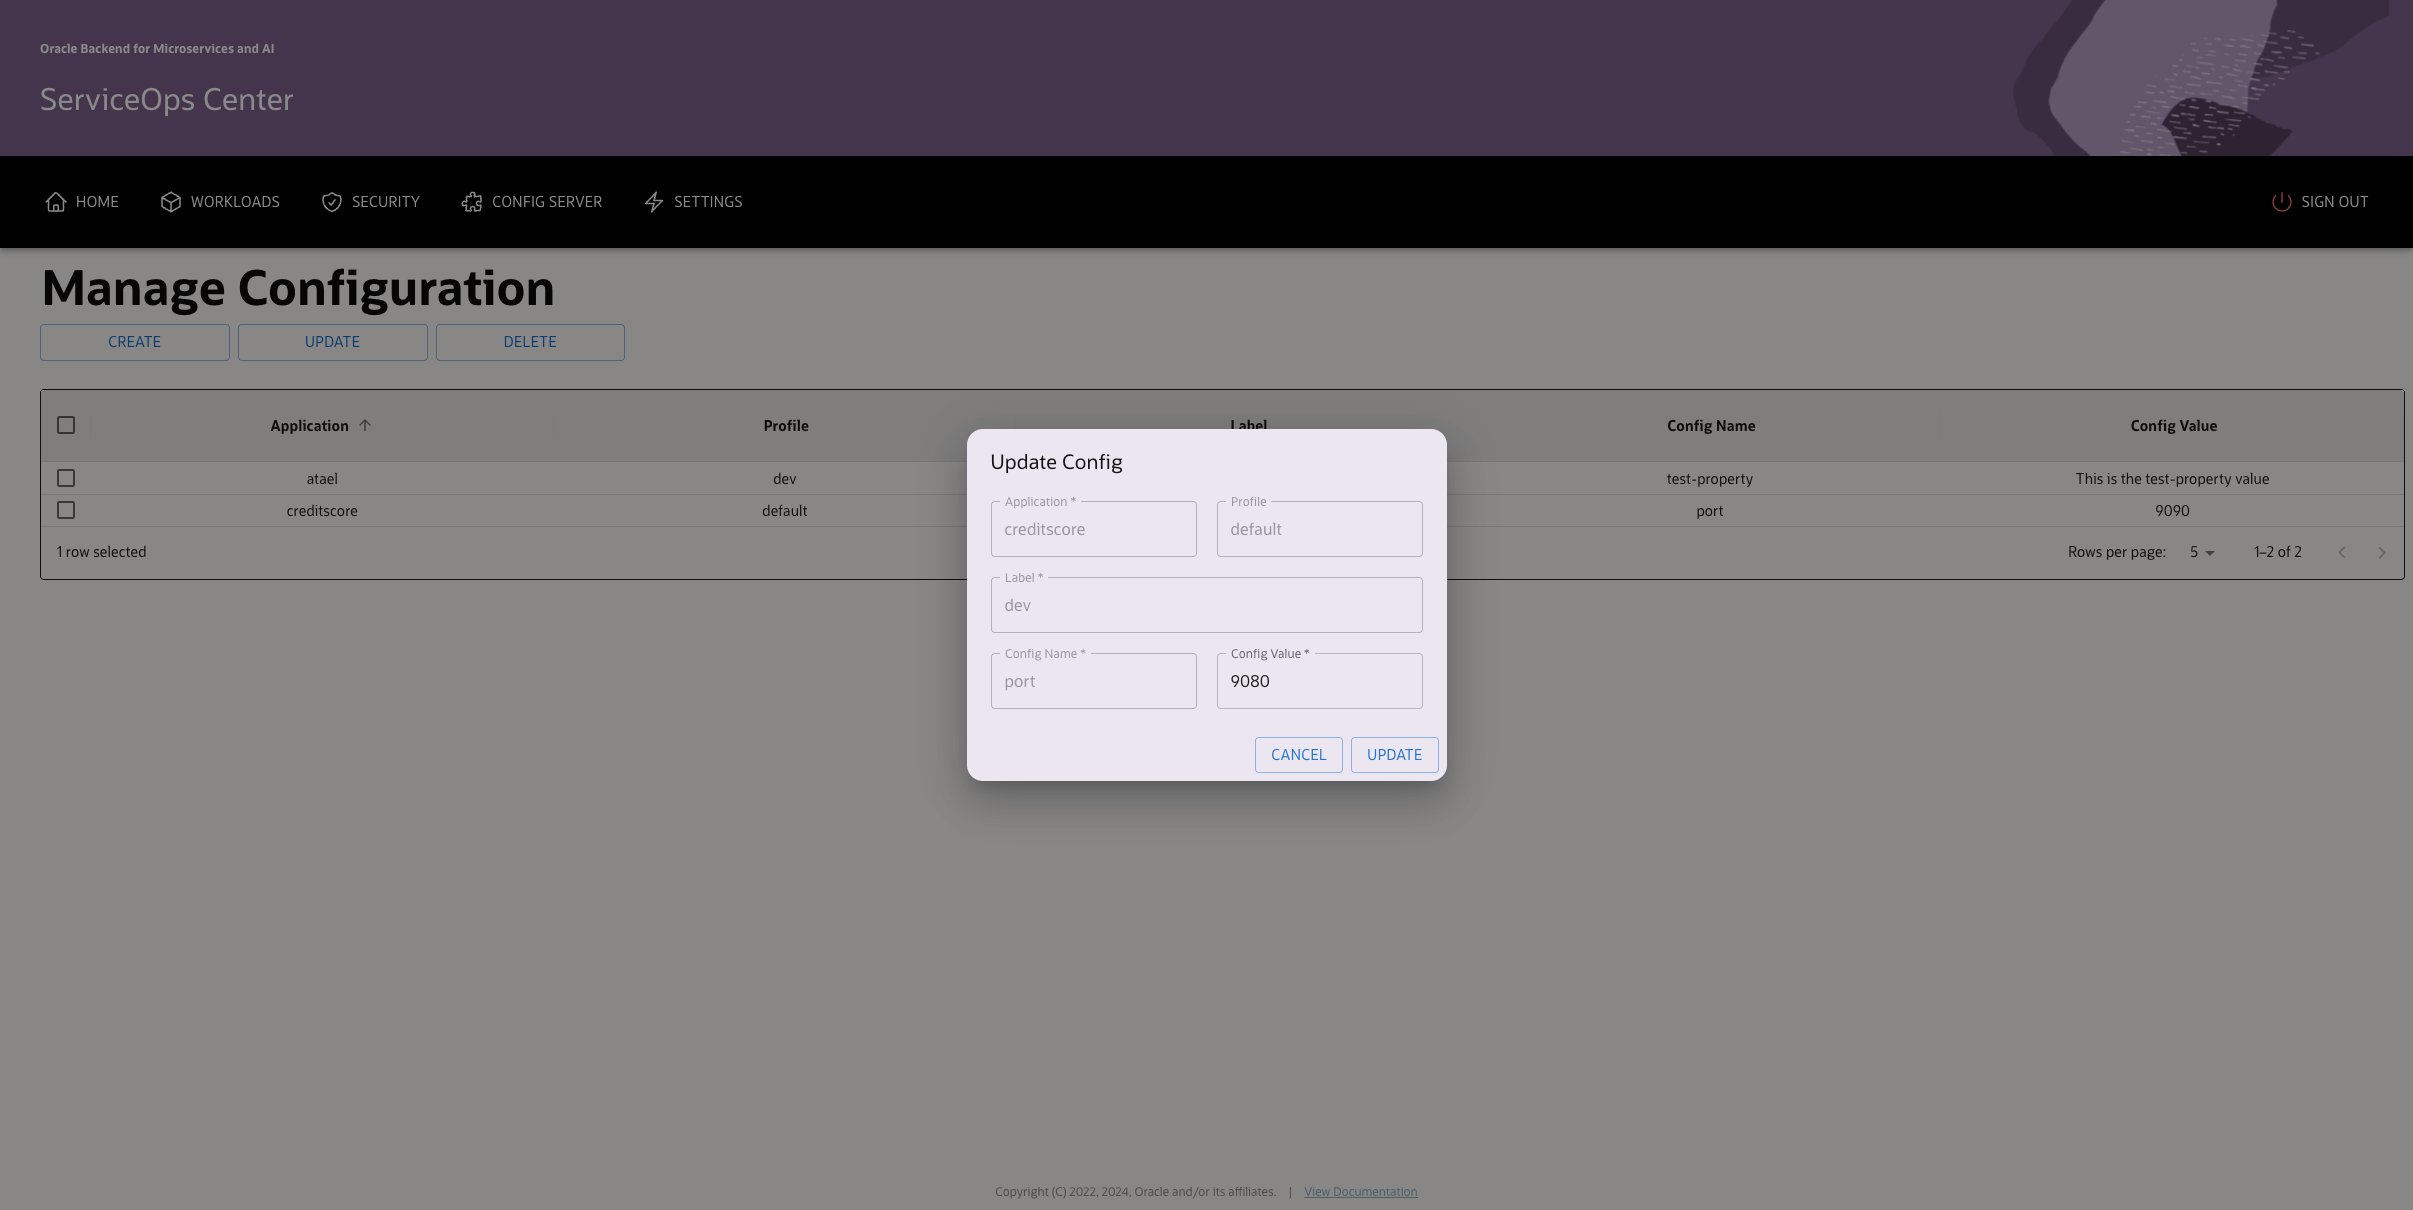
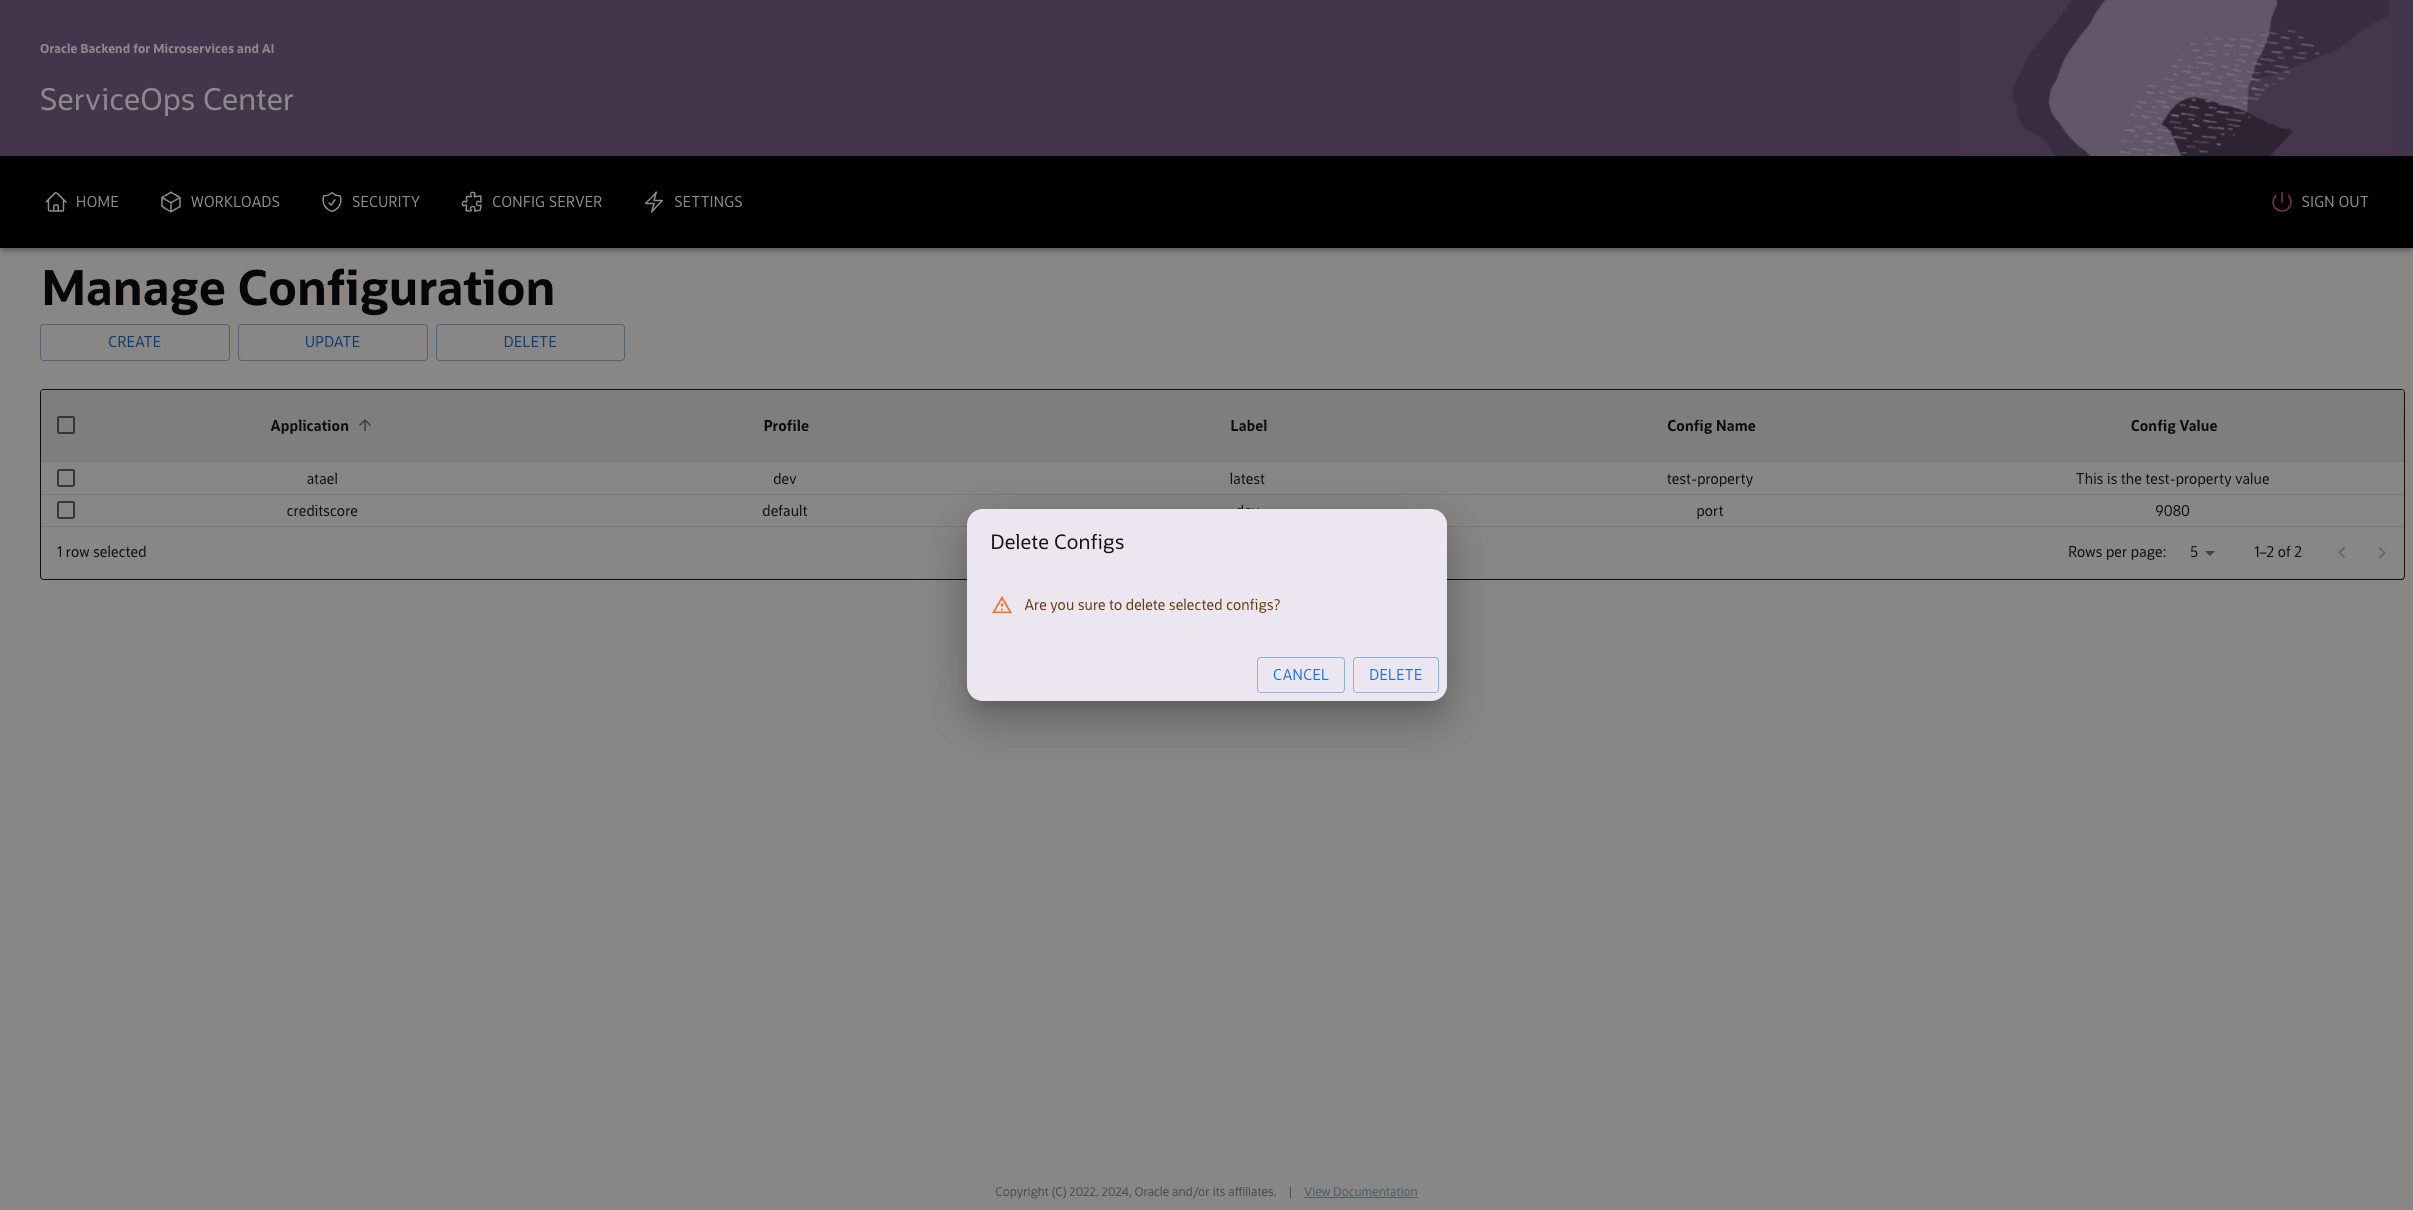
You can select one or more configurations and click “DELETE” to delete selected configuration(s).
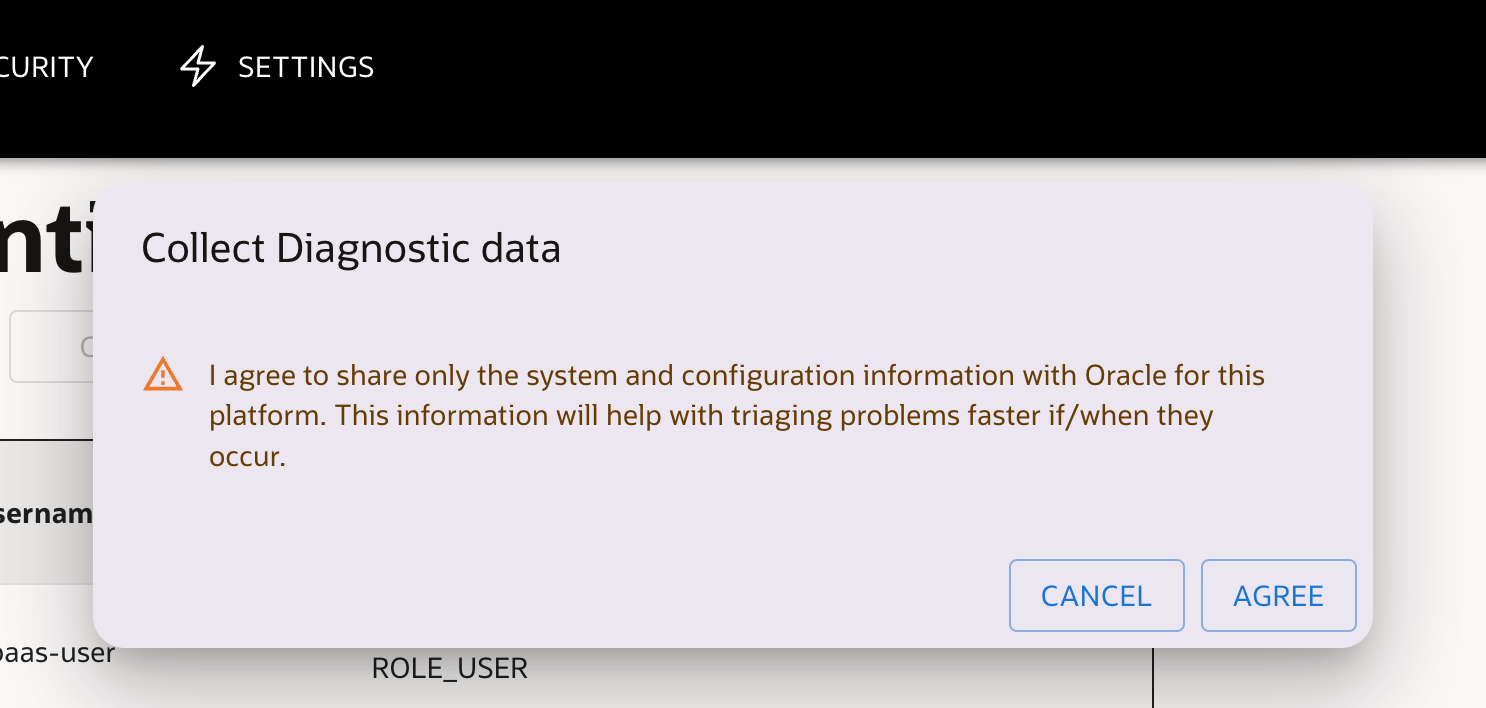
The Collect Diagnostic Data is accessible from the Settings Menu and allows you to collect and download diagnostic data about your installation and platform. Verify its contents for any sensitive information before submitting with any support request.
You can see preview of alerts from Alertmanager in ServiceOps Center. Clicking on an alert navigates to the Alertmanager UI. You can close individual alerts or click “Dismiss All” to close all the alerts. To re-enable the alerts, click “Show All Alerts” from the “Settings” menu.
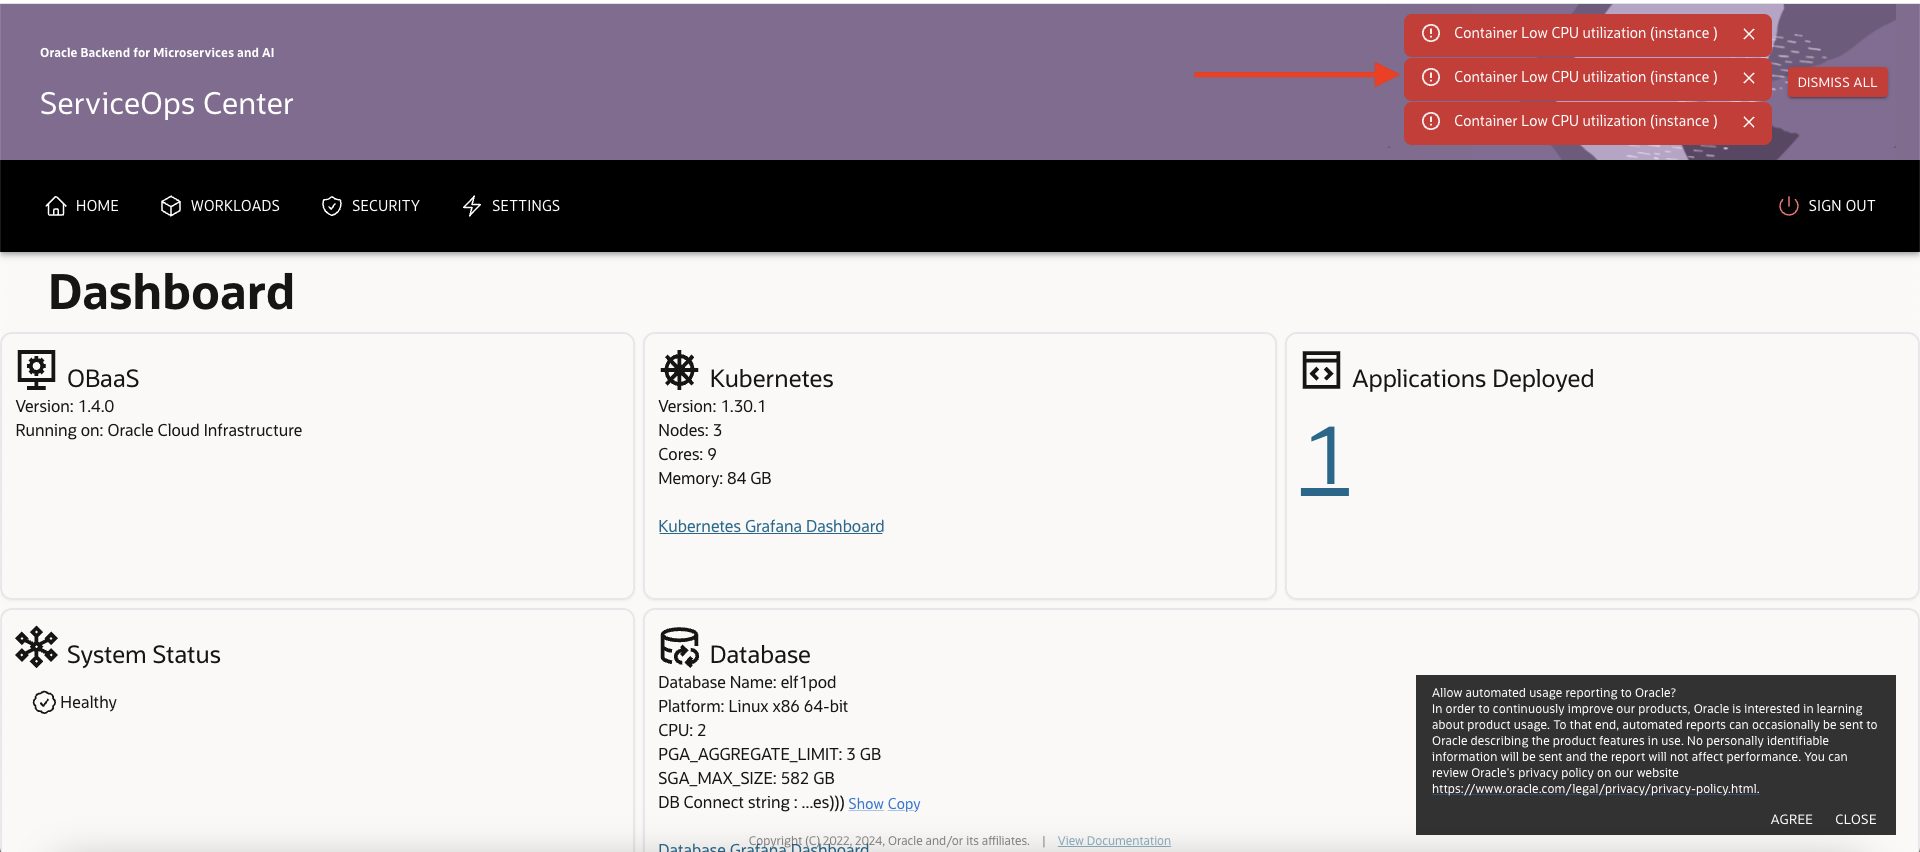
The ServiceOps Center can send basic install details to Oracle on a periodic basis, To enable that, click on the “AGREE” button on the notification or “CLOSE” to mute the notification. The details will include
- Memory, CPU count, nodes and version of the Kubernetes cluster
- Overall health status of the OBaaS platform
- Version of the OBaaS platform
- Database details such as name, CPU count and memory details