Metrics
Oracle Backend for Microservices and AI provides built-in platform services to collect metrics from system and application workloads and pre-built Grafana dashboards to view and explore those metrics.
On this page, you will find the following topics:
- Overview
- Pre-installed dashboards
- How to have metrics collected for your applications
- How to access Prometheus
- How to access Grafana
Oracle Backend for Microservices and AI includes a number of pre-installed and pre-configured components to provide metrics for the platform itself and for your applications.
The diagram below provides an overview of the components that play a role in metrics:
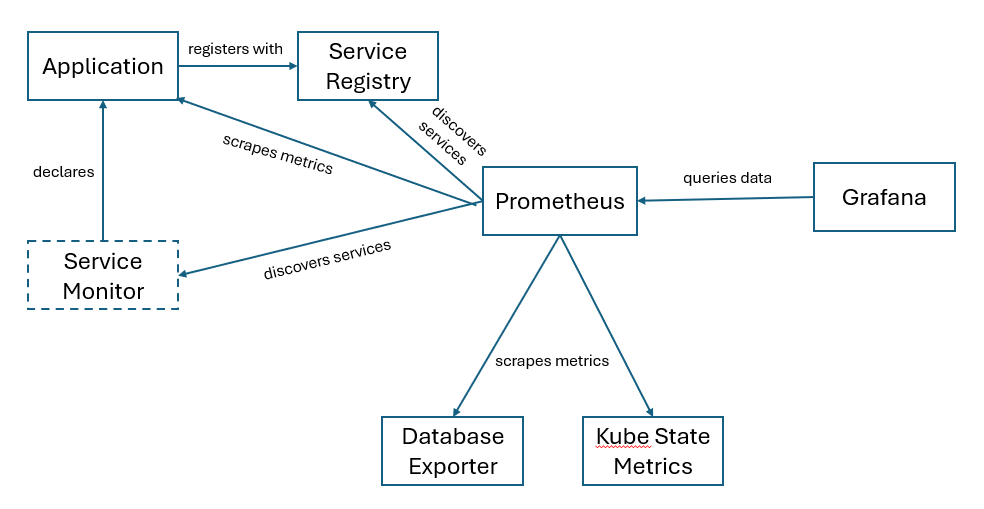
In the diagram above:
- You may deploy applications into the platform and to have metrics collected these must either register with the Spring Eureka Service Registry or you must create Service Monitor resources for your applications.
- Prometheus is configured to auto-discover services that register with the service registry and collect metrics for them.
- Prometheus is configured to collect metrics from application described by a Service Monitor.
- The Oracle Database Exporter and Kube State Metrics are pre-installed and Prometheus is configured to collect metrics from them.
- Grafana is pre-installed and populated with a set of dashboards (see below). A Prometheus data source is pre-configured.
The following dashboards are pre-installed in Grafana:
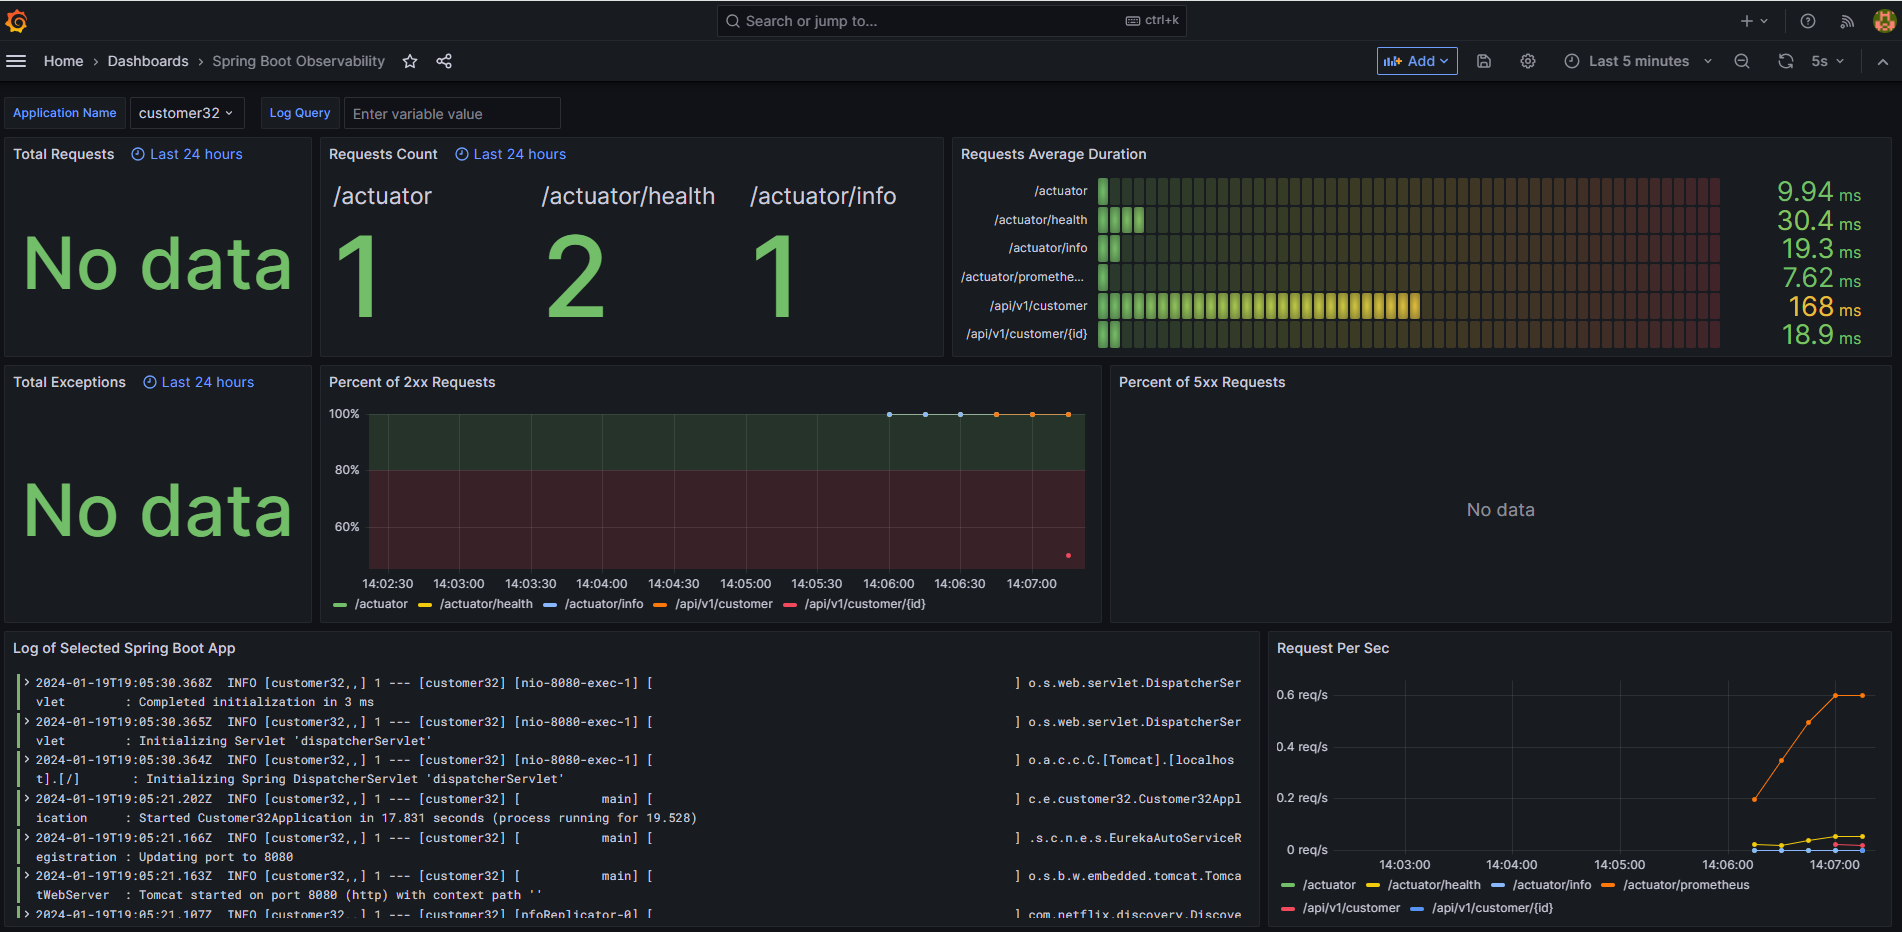
This dashboard provides details of one or more Spring Boot applications including the following:
- The number of HTTP requests received by the application
- A breakdown of which URL paths requests were received for
- The average duration of requests by path
- The number of exceptions encountered by the application
- Details of 2xx (that is, successful) and 5xx (that is, exceptions) requests
- The request rate per second over time, by path
- Log messages from the service
You may adjust the time period and to drill down into issues, and search the logs for particular messages. This dashboard is designed for Spring Boot 3.x applications. Some features may work for Spring Boot 2.x applications.
Here is an example of this dashboard displaying data for a simple application:
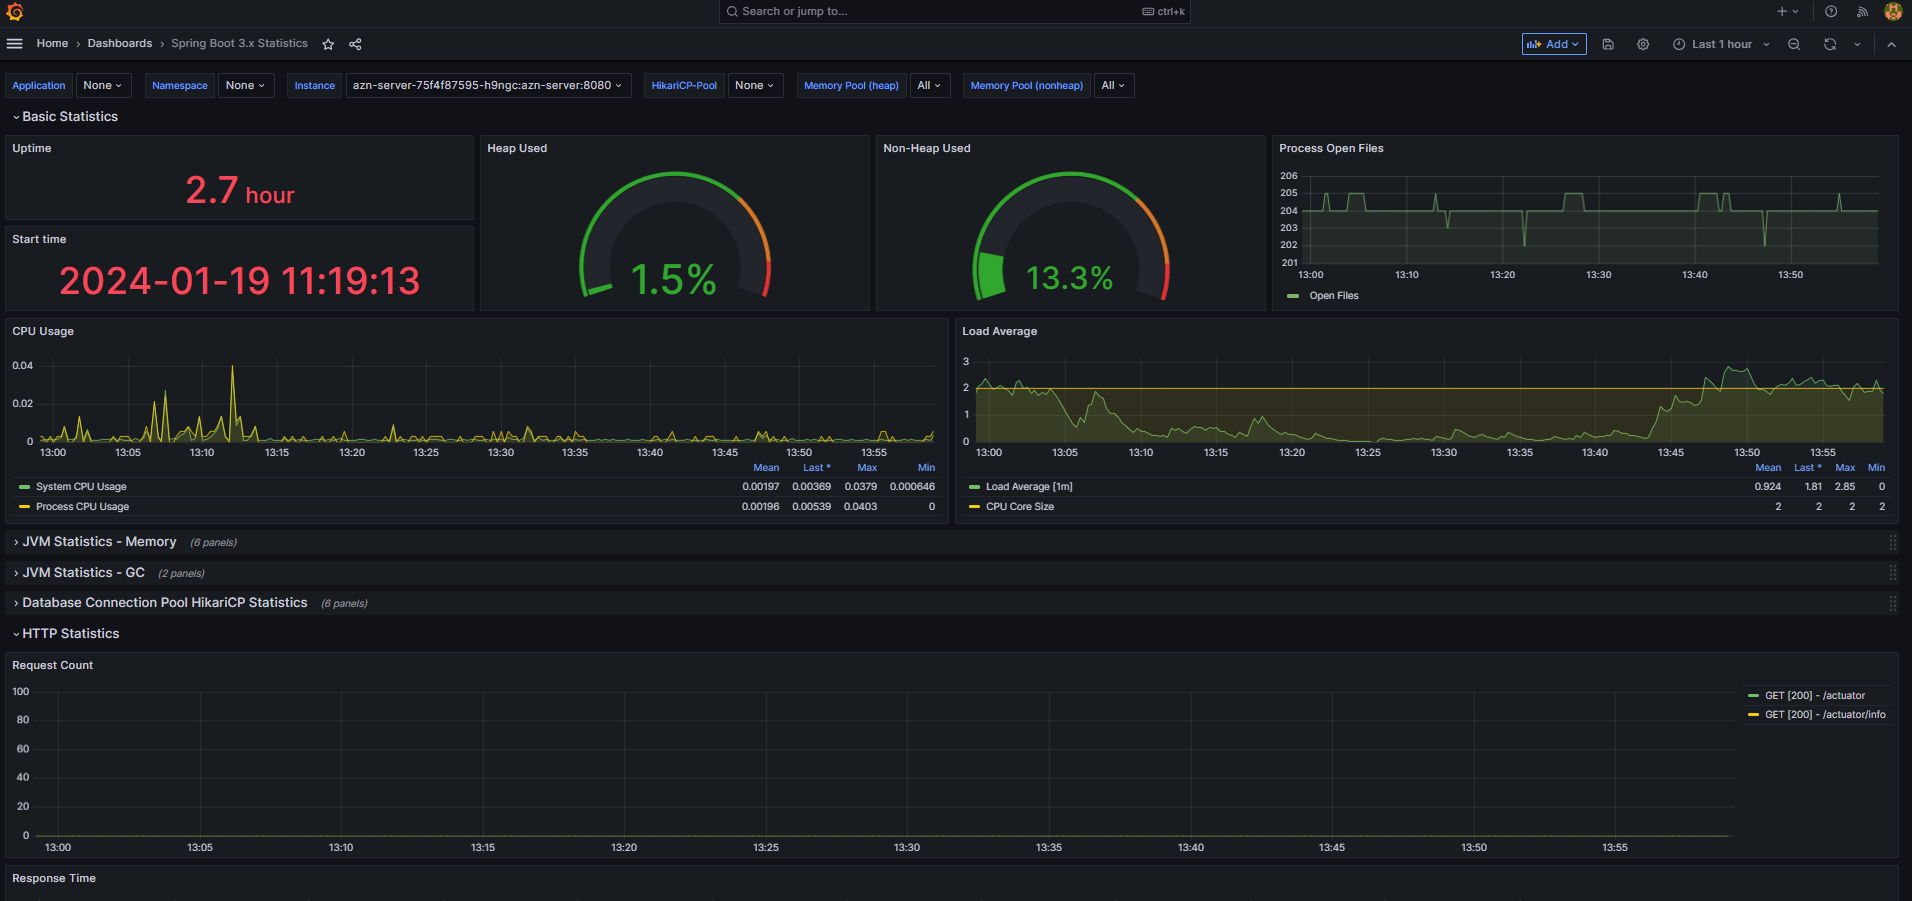
This dashboard provides more in-depth information about services including the following:
- JVM statistic like heap and non-heap memory usage, and details of garbage collection
- Load average and open files
- Database connection pool statistics (for HikariCP)
- HTTP request statistics
- Logging (logback) statistics
You may adjust the time period and to drill down into issues, and search the logs for particular messages. This dashboard is designed for Spring Boot 3.x applications. Some features may work for Spring Boot 2.x applications.
Here is an example of this dashboard displaying data for a simple application:
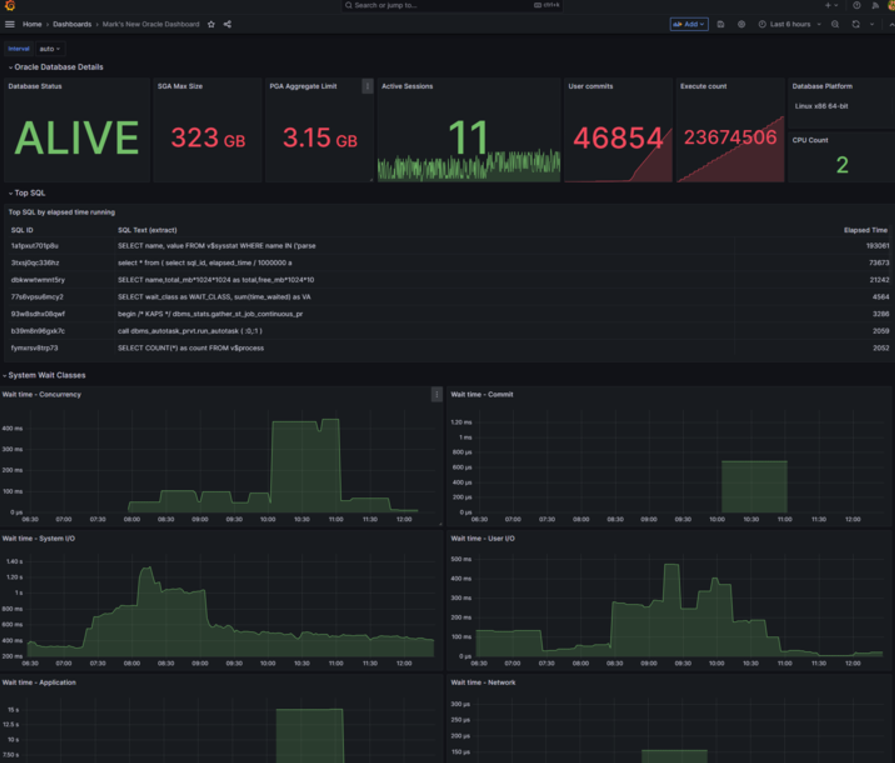
This dashboard provides details about the Oracle Database including:
- SGA and PGA size
- Active sessions
- User commits
- Execute count
- CPU count and platform
- Top SQL
- Wait time statistics by class
Here is an example of this dashboard:
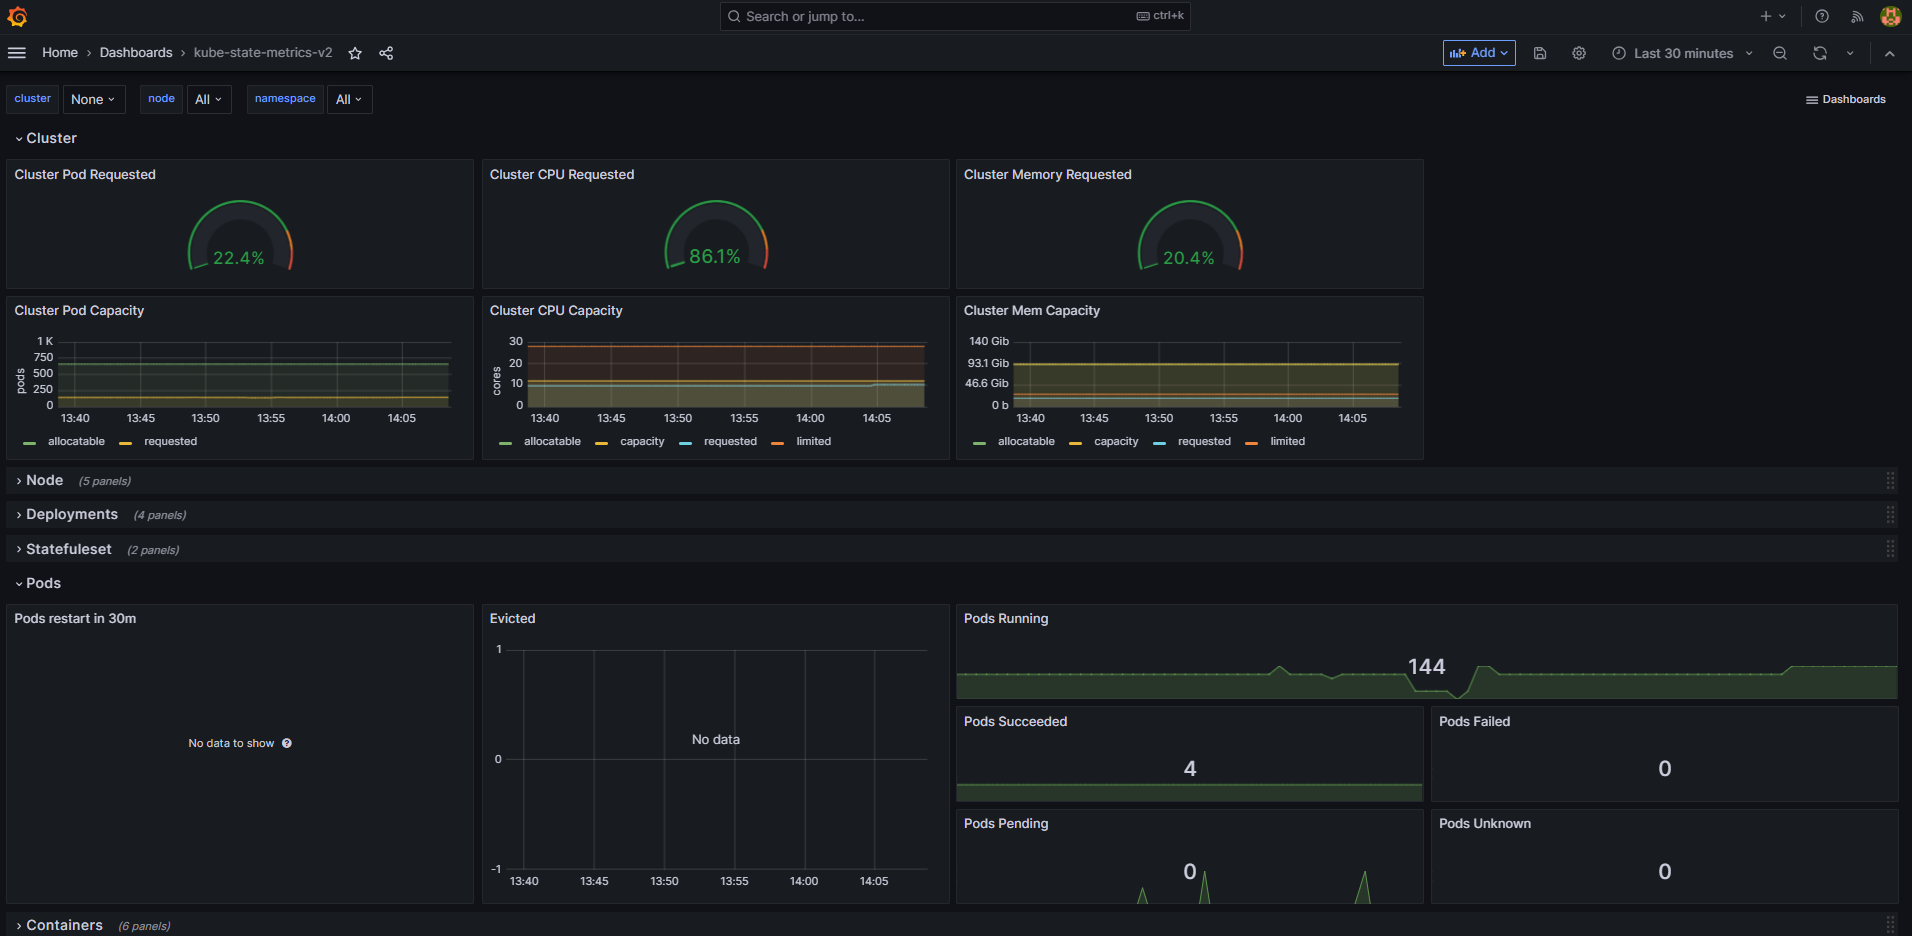
This dashboard provides details of the Kubernetes cluster including:
- Pod capacity and requests for CPU and memory
- Node availability
- Deployment, Stateful Set, Pod, Job and Container statistics
- Details of horizontal pod autoscalers
- Details of persistent volume claims
Here is an example of this dashboard:
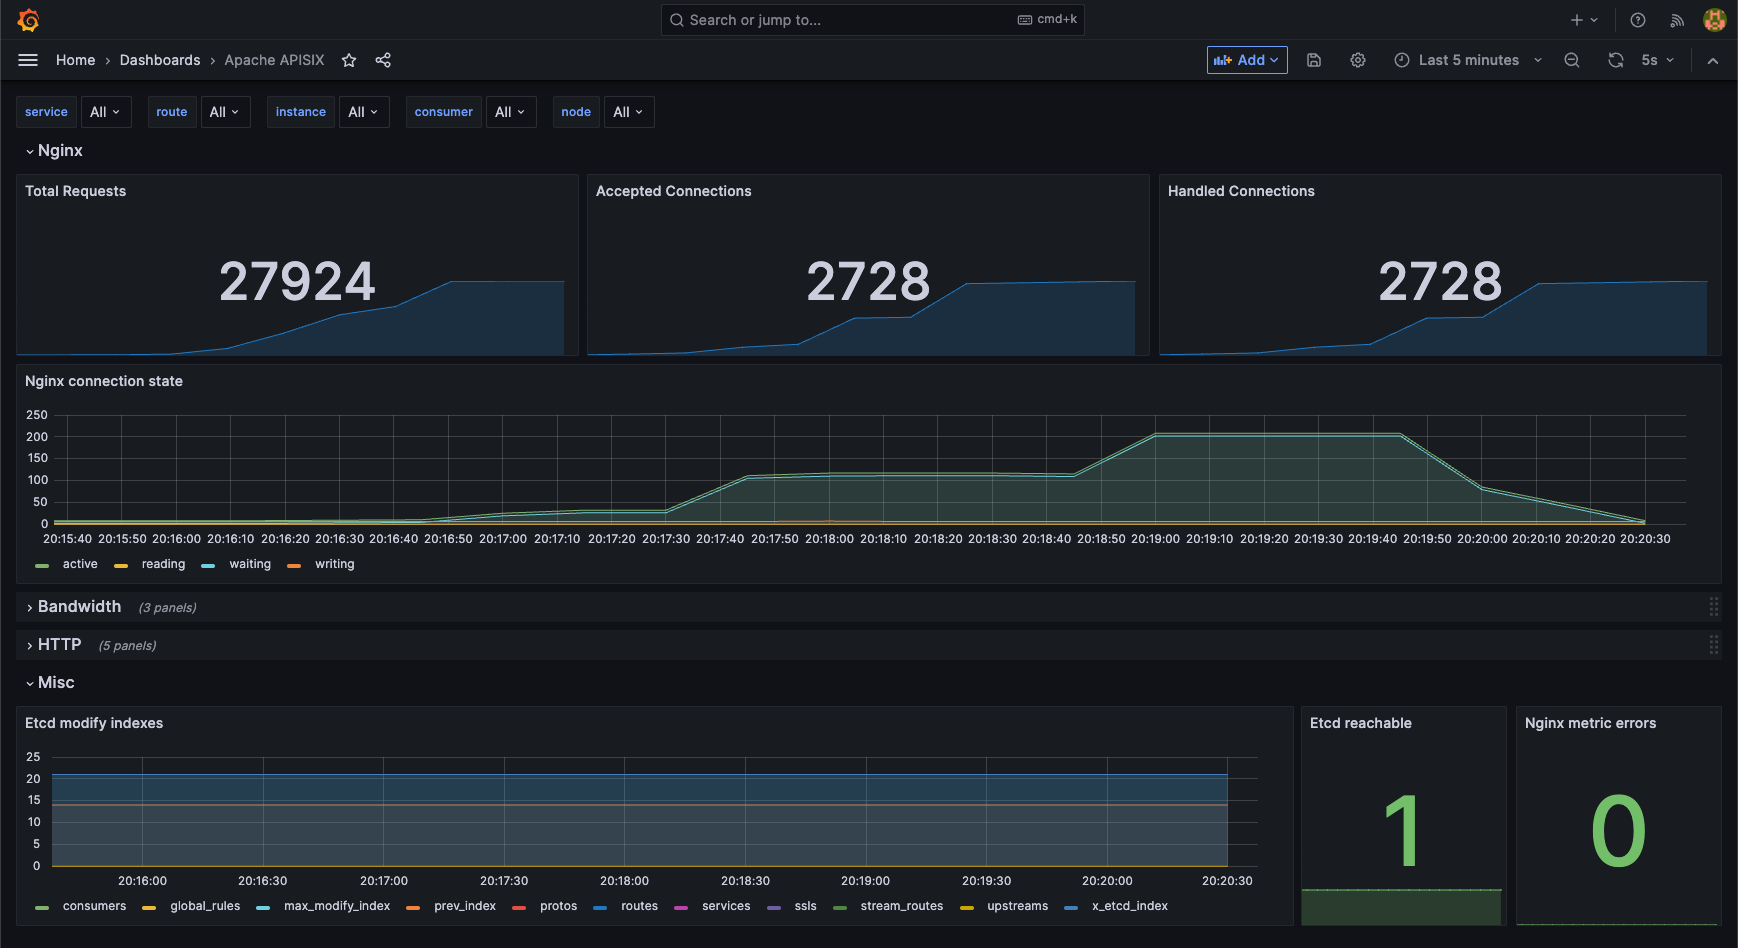
This dashboard provides details of the APISIX API Gateway including:
- Total Requests
- NGINX Connection State
- Etcd modifications
Here is an example of this dashboard:
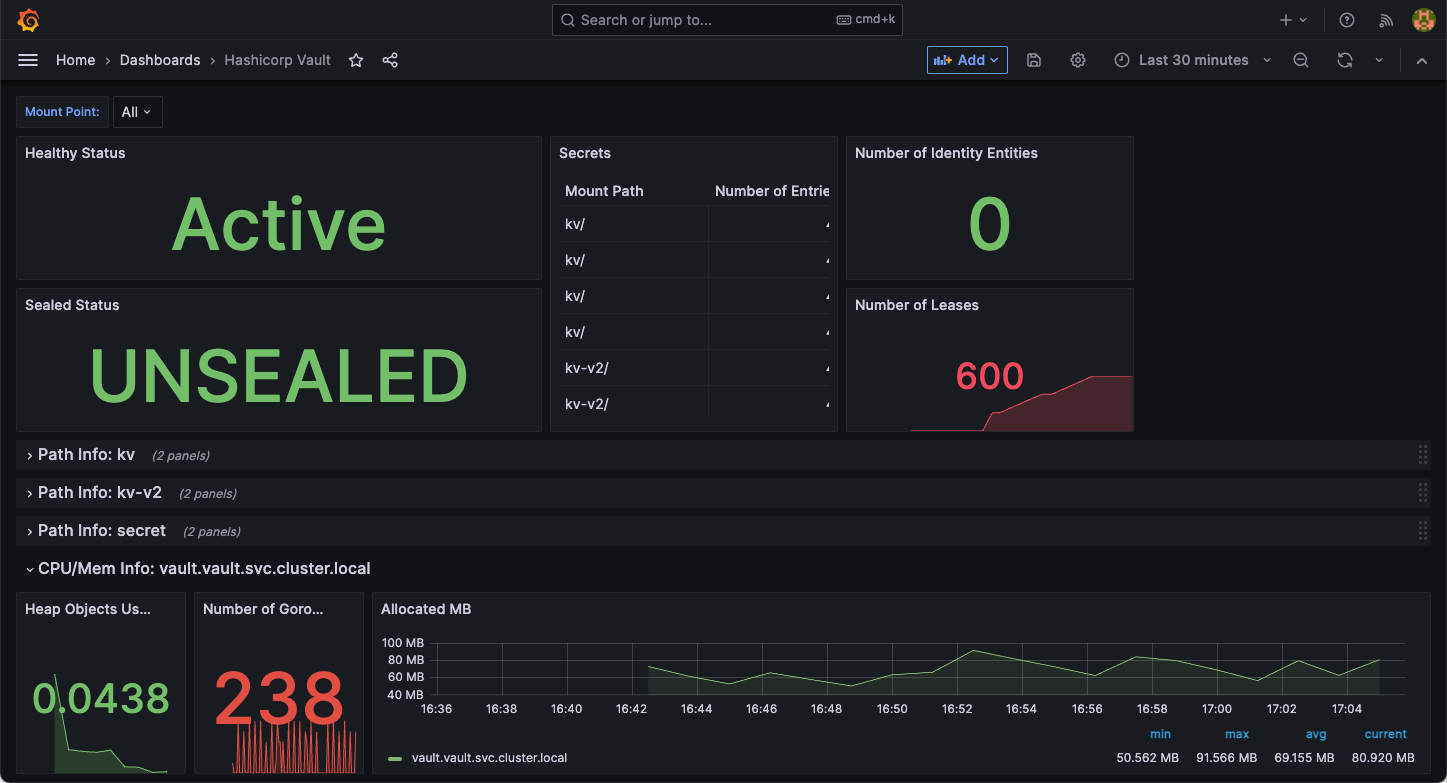
This dashboard provides details of the HashiCorp Vault including:
- Health and seal status
- Number of secrets
- Number of operations
Here is an example of this dashboard:
When you deploy an application with Oracle Backend for Microservices and AI CLI or Visual Code Extension, provided you included the Eureka Discovery Client and Actuator in your application, Prometheus will automatically find your application (using the service registry) and start collecting metrics. These metrics will be included in both the Spring Boot Observability dashboard and the Spring Boot Statistic dashboard automatically.
To include the Eureka Discovery client in your application, add the following dependencies to your Maven POM or equivalent:
<dependency>
    <groupId>org.springframework.cloud</groupId>
    <artifactId>spring-cloud-starter-netflix-eureka-client</artifactId>
</dependency>
<dependency>
    <groupId>org.springframework.boot</groupId>
    <artifactId>spring-boot-starter-actuator</artifactId>
</dependency>
You must also add the following configuration to your Spring application.yaml:
spring:
  application:
    name: my-app

eureka:
  instance:
    hostname: ${spring.application.name}
    preferIpAddress: true
  client:
    service-url:
      defaultZone: ${eureka.service-url}
    fetch-registry: true
    register-with-eureka: true
    enabled: true

management:
  endpoint:
    health:
      show-details: always
  endpoints:
    web:
      exposure:
        include: "*"
  metrics:
    tags:
      application: ${spring.application.name}
Alternatively, if you do not want to include the Eureka client, you can instead create a ServiceMonitor resource for your service. This must be created in the namespace where your application is deployed, and you must specify the correct port and the path for Spring Boot Actuator. Your application must have Actuator and the prometheus endpoint enabled, as described above.
Here is an example of a ServiceMonitor for an application:
apiVersion: monitoring.coreos.com/v1
kind: ServiceMonitor
metadata:
  labels:
    app: my-app
  name: my-app
  namespace: application
spec:
  endpoints:
  - interval: 20s
    path: /actuator/prometheus
    port: 8080
  selector:
    matchLabels:
      app: my-app
Prometheus is an open source monitoring and alerting system. Prometheus collects and stores metrics as time series data with the timestamp of the time that they are recorded, and optional Key/Value pairs called labels.
-
Expose the Prometheus user interface (UI) using this command:
kubectl port-forward -n prometheus svc/prometheus 9090:9090 -
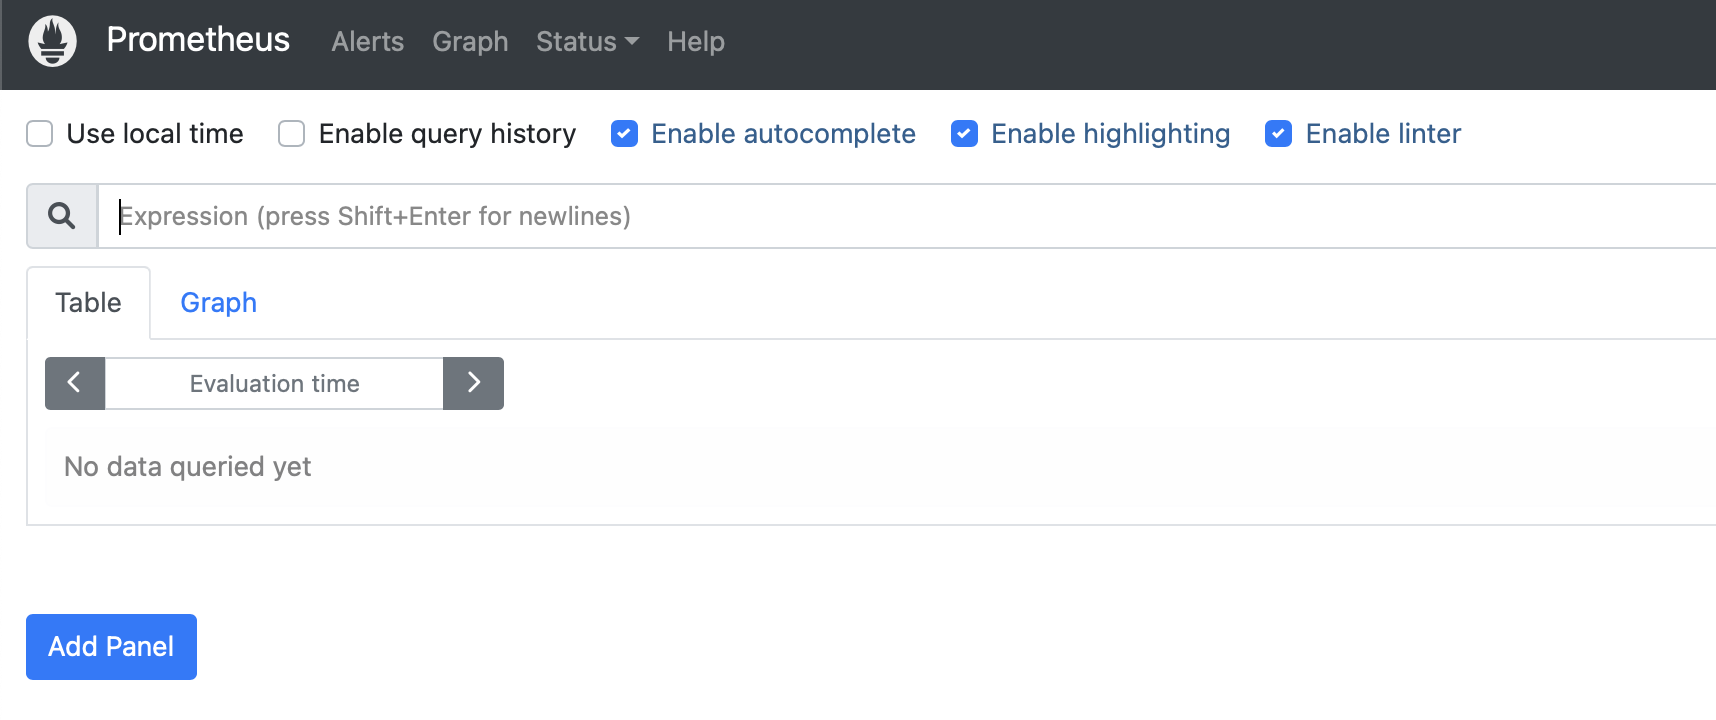
Open the Prometheus web user interface URL: http://localhost:9090

Prometheus UI -
In the Prometheus web user interface, search for metrics:
- In the search bar, search for
application_ready_time_secondsand click on Execute. - You should see metrics for the Sample Applications.
For example:
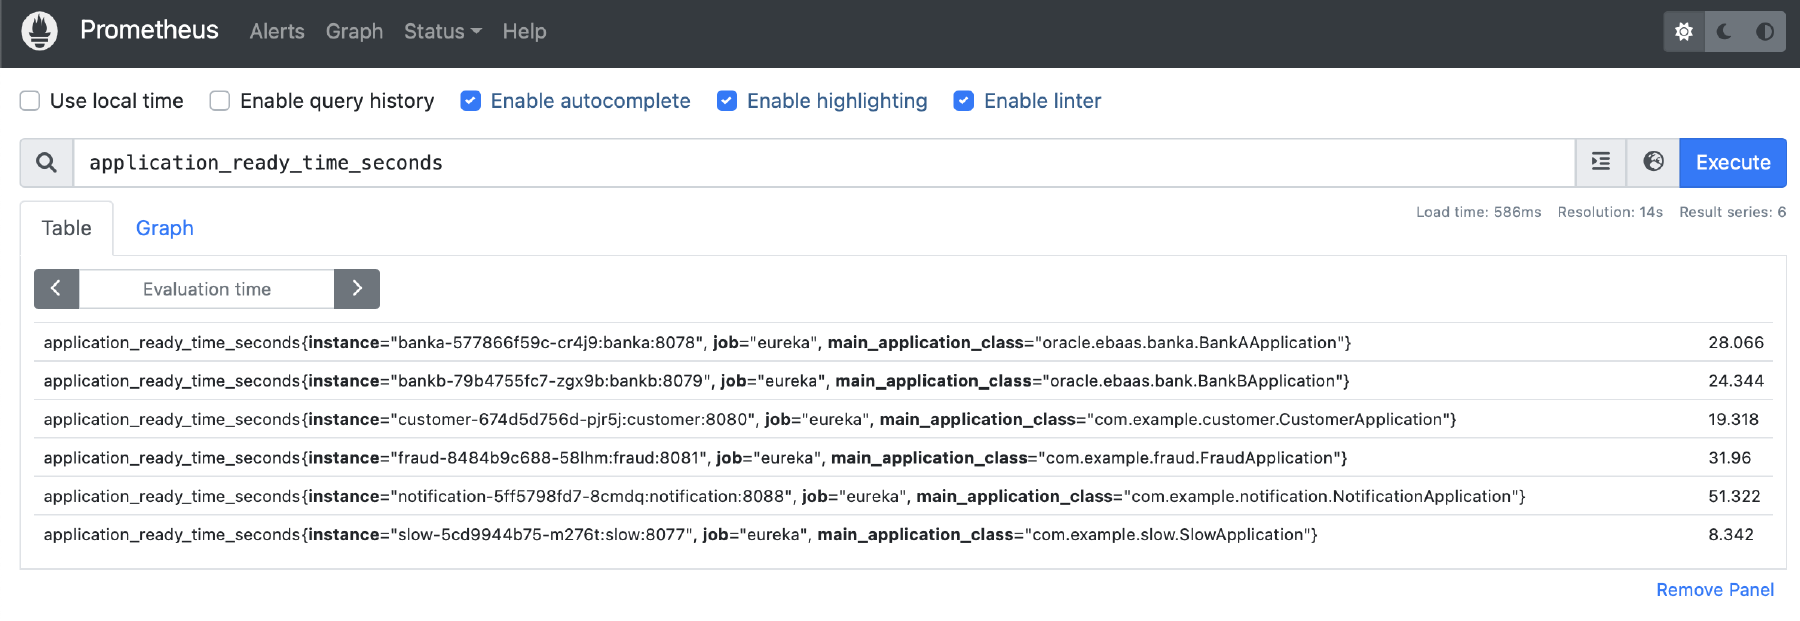
Prometheus Metrics - In the search bar, search for
-
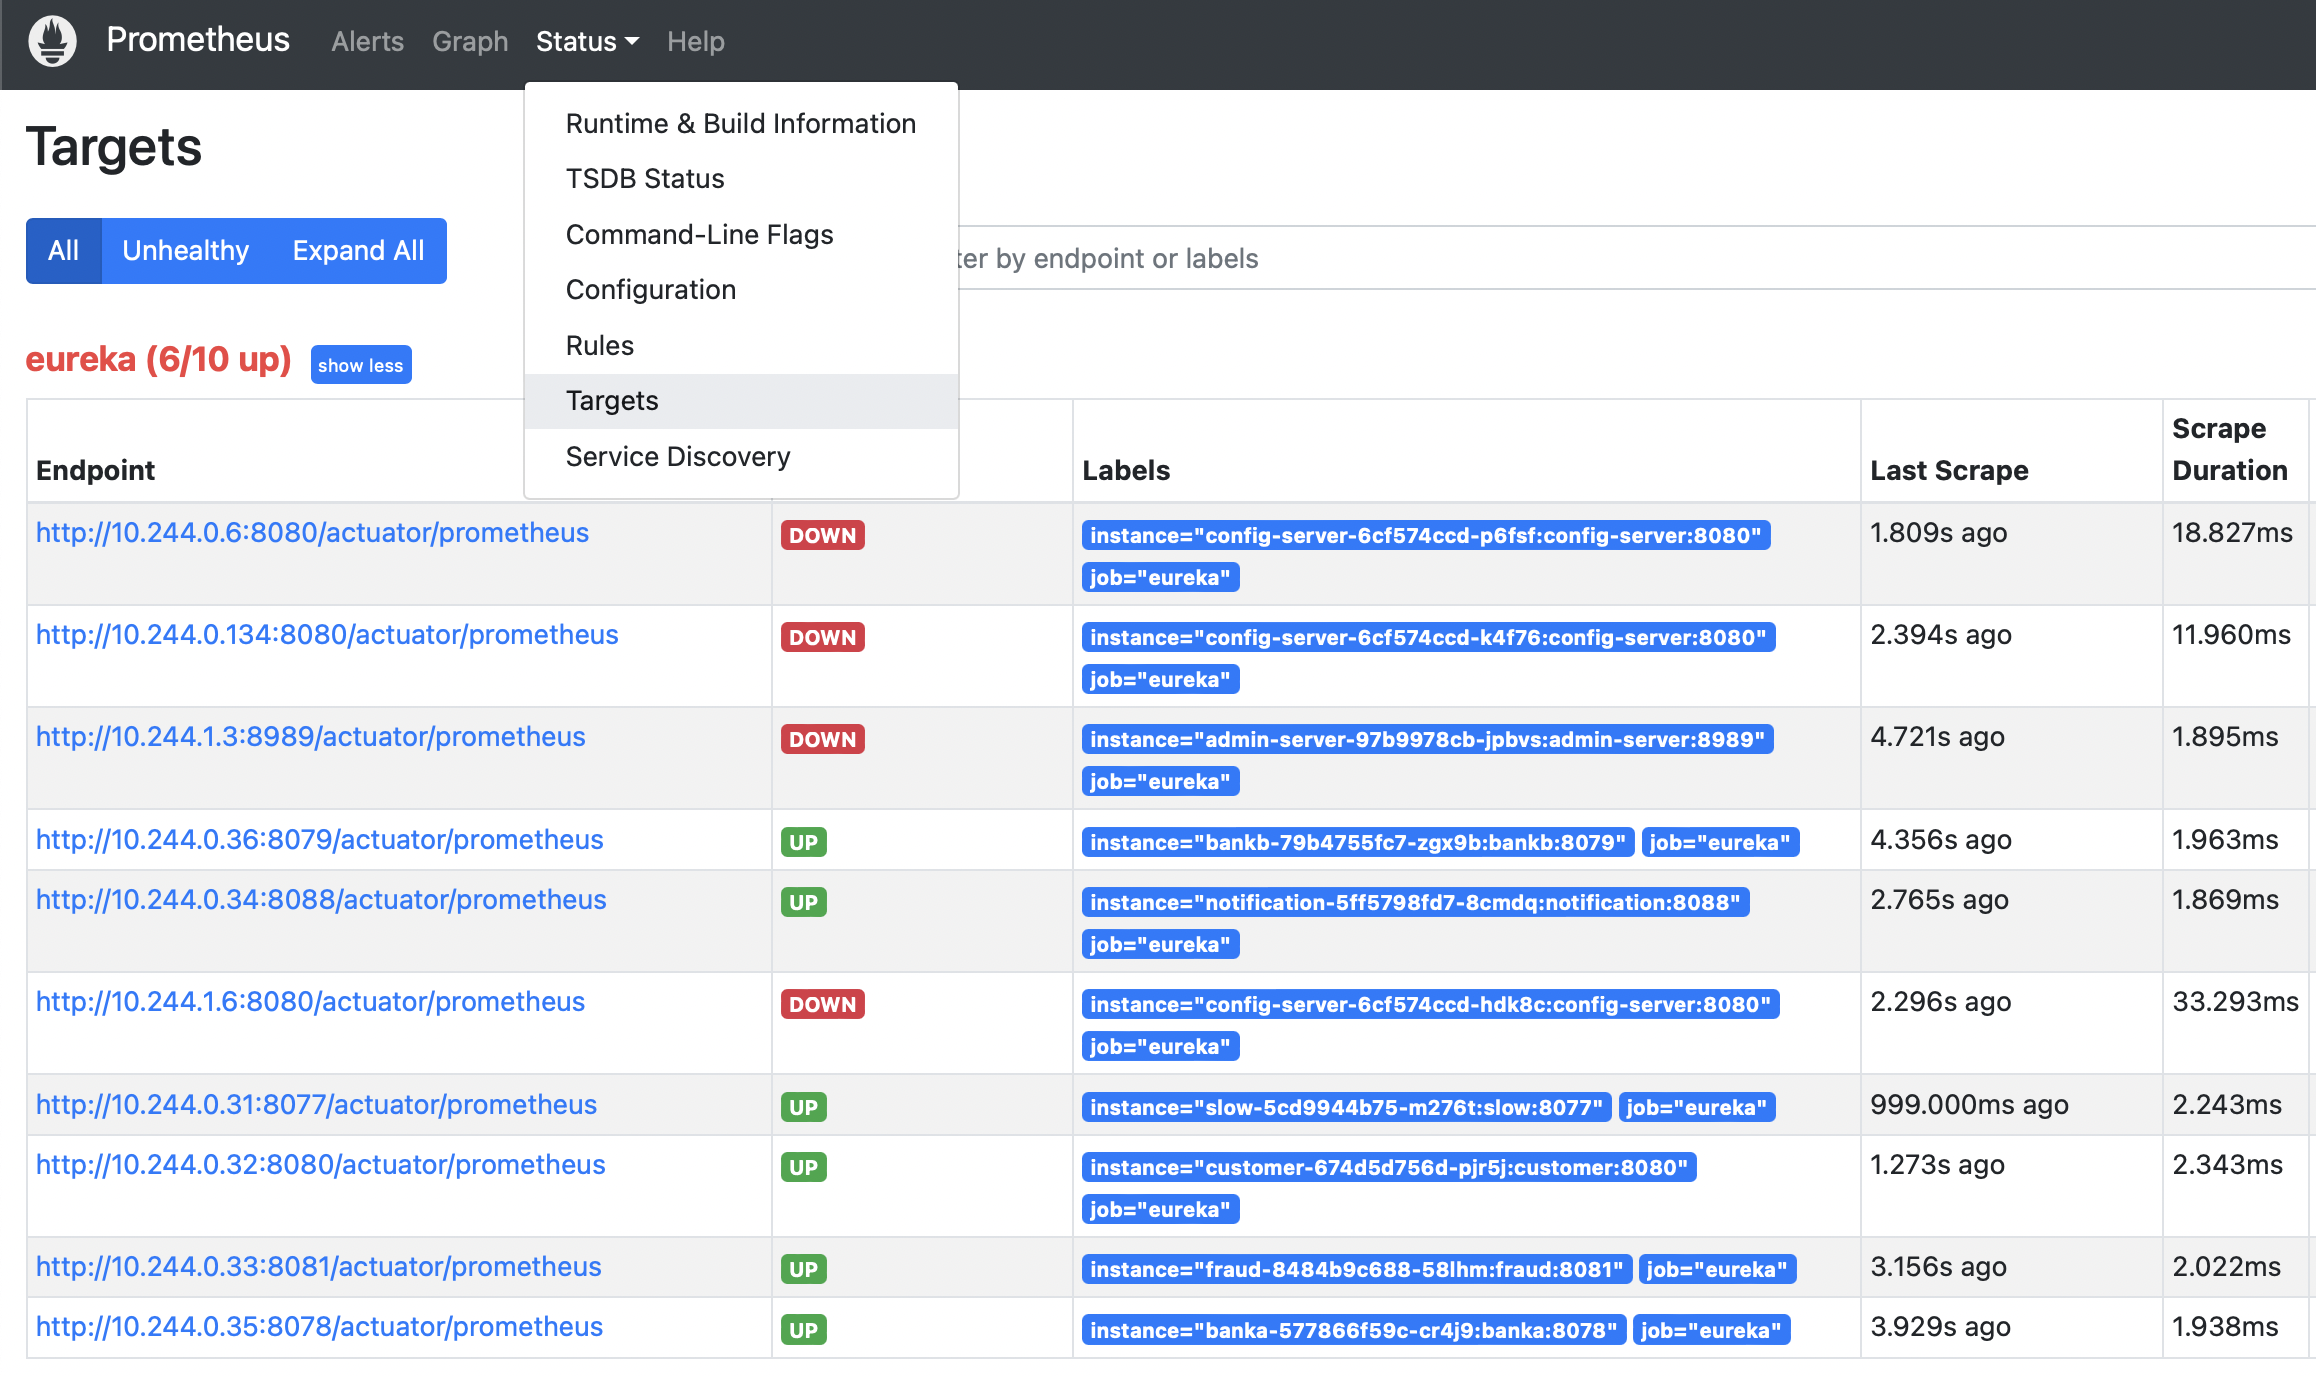
In the Prometheus web user interface, Status allows you to view the targets being monitored by Prometheus:
- In the top menu, choose Status and then Targets.
- Notice that the targets “slow”, “customer” and others are in UP status and others are in DOWN status.
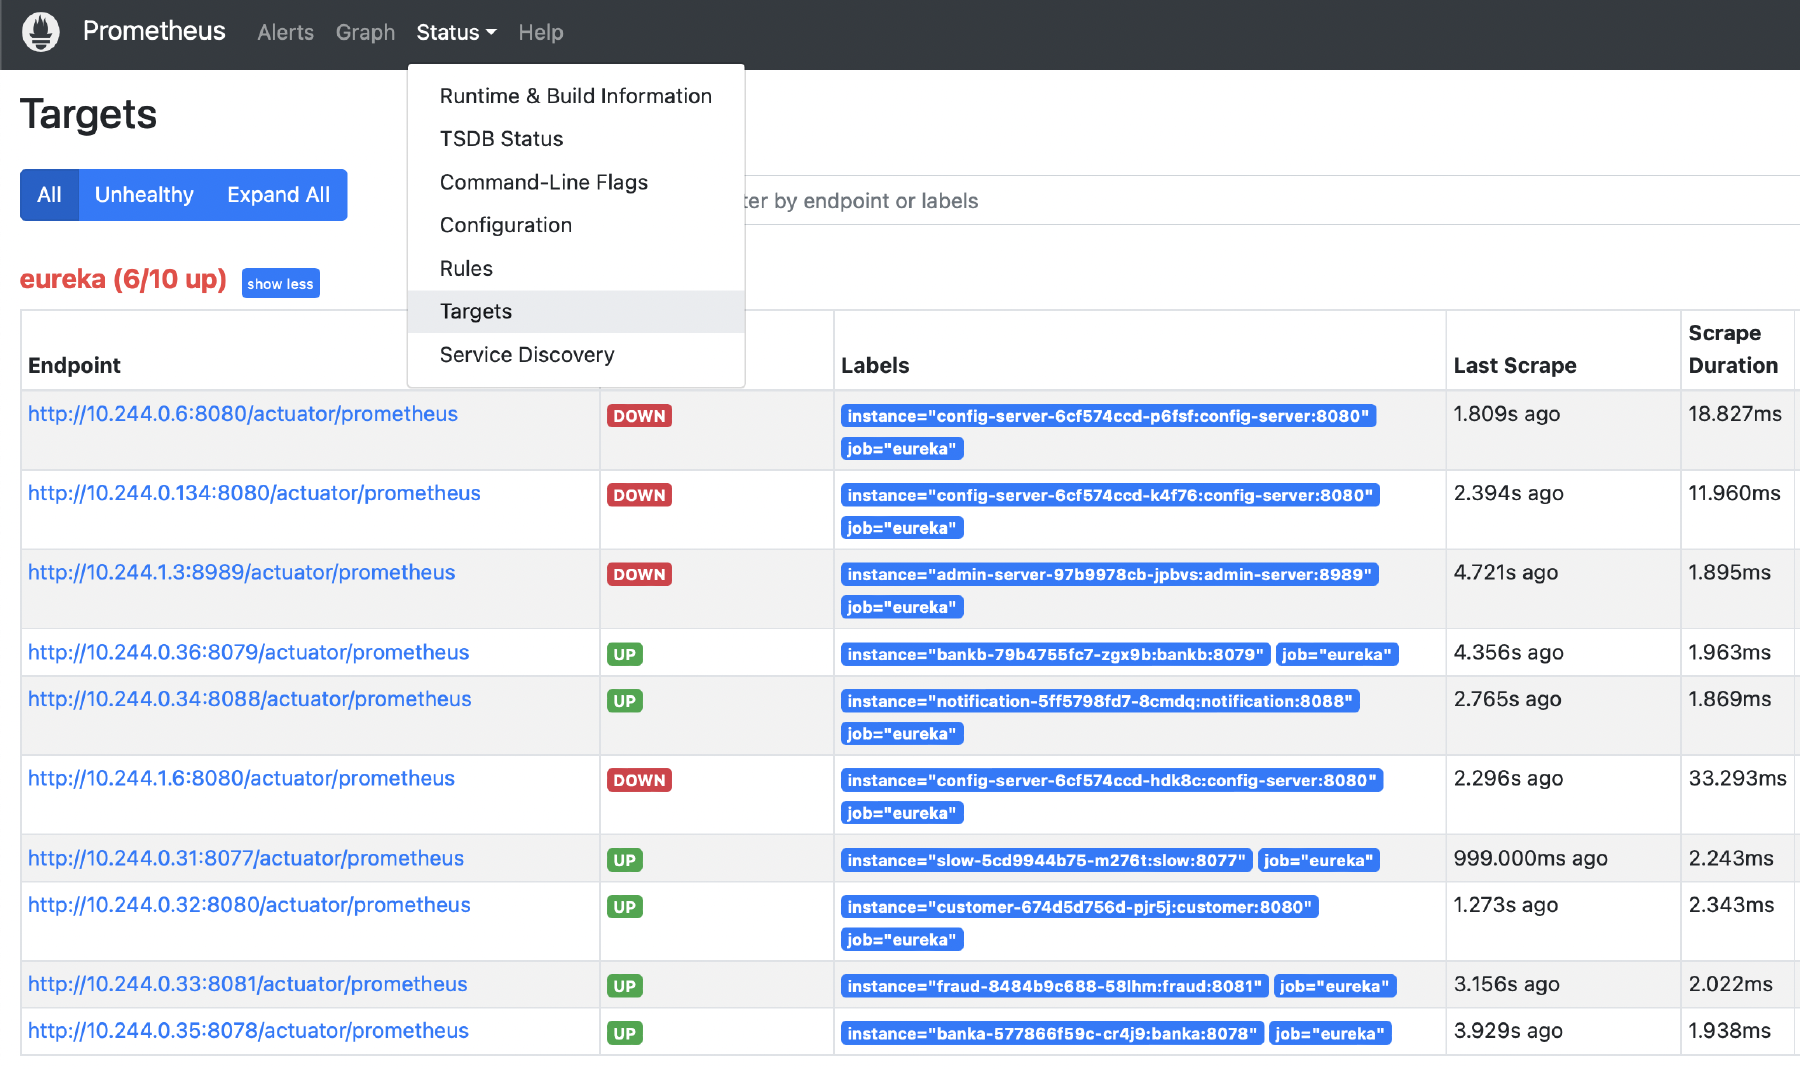
Prometheus Targets

Grafana open source software enables you to query, visualize, alert, and explore your metrics, logs, and traces wherever they are stored. Grafana open source software provides tools that turn your time series database (TSDB) data into insightful graphs and visualizations. Take the following steps:
-
Expose Grafana using this command:
kubectl -n grafana port-forward svc/grafana 8080:80 -
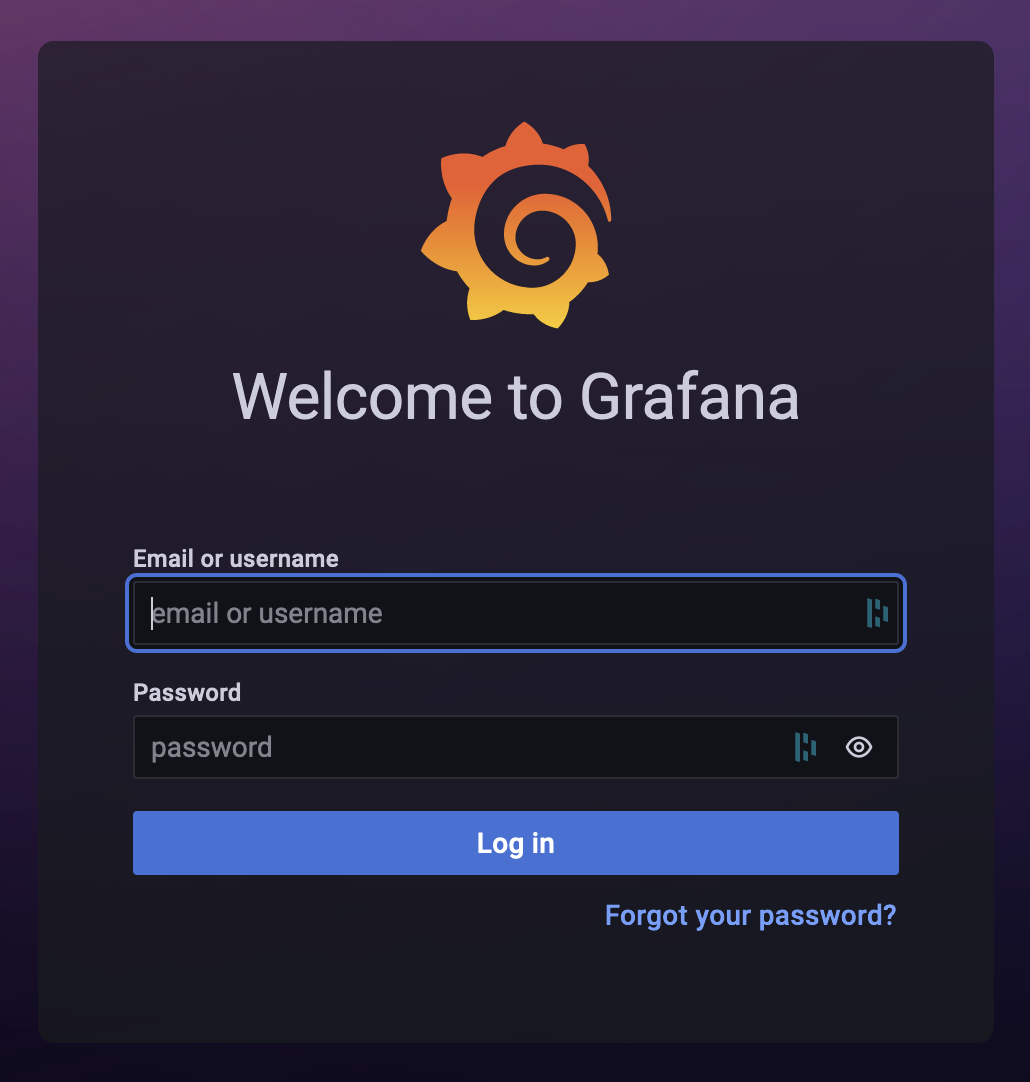
Open the Grafana web user interface URL: http://localhost:8080
-
username:
admin -
To get the password, run this command:
kubectl -n grafana get secret grafana-dashboard-authn -o jsonpath='{.data.password}' | base64 -d; echoNOTE: If you do not have
base64, leave off the last part (| base64 -d) in the command, then copy the output, and use this website to decode it: https://www.base64decode.org/.
If you did not set your own password during installation, then the auto-generated password will be a long string of characters that might be similar to
210BAqNzYkrcWjd58RKC2Xzerx9c0WkZi9LNsG4c. For example:
Grafana Login -