Tracing
In a distributed system, it’s expected that occasional errors are bound to happen when serving requests. A central observability platform helps by capturing application traces/logs and provides an interface to query for a specific request. OpenTelemetry helps in standardizing the process of capturing and exporting telemetry data.
OpenTelemetry (OTEL) is a collection of standardized vendor-agnostic tools, APIs, and SDKs. It’s a CNCF incubating project and is a merger of the OpenTracing and OpenCensus projects.
OpenTracing is a vendor-neutral API for sending telemetry data over to an observability backend. The OpenCensus project provides a set of language-specific libraries that developers can use to instrument their code and send it to any supported backends. OTEL uses the same concept of trace and span to represent the request flow across microservices as used by its predecessor projects.
OTEL allows us to instrument, generate, and collect telemetry data, which helps in analyzing application behavior or performance. Telemetry data can include logs, metrics, and traces. We can either automatically or manually instrument the code for HTTP, DB calls, and more.
To enable tracing for your application you must include the following dependencies to your Maven POM or equivalent.
<dependency>
  <groupId>org.springframework.boot</groupId>
  <artifactId>spring-boot-starter-actuator</artifactId>
</dependency>
<dependency>
  <groupId>io.micrometer</groupId>
  <artifactId>micrometer-registry-prometheus</artifactId>
</dependency>
<dependency>
  <groupId>io.micrometer</groupId>
  <artifactId>micrometer-tracing-bridge-otel</artifactId>
</dependency>
<dependency>
  <groupId>io.opentelemetry</groupId>
  <artifactId>opentelemetry-exporter-otlp</artifactId>
</dependency>
<dependency>
  <groupId>io.micrometer</groupId>
  <artifactId>micrometer-tracing</artifactId>
</dependency>
If you want to enable tracing for your database calls (Micrometer observability instrumentation for JDBC DataSource) you must include the following dependency too. You can find the latest version here.
<dependency>
  <groupId>net.ttddyy.observation</groupId>
  <artifactId>datasource-micrometer-spring-boot</artifactId>
  <version>1.0.3</version>
</dependency>
You must also add the following to your applications application.yaml file.
spring:
application:
name: customer
management:
endpoint:
health:
show-details: always
endpoints:
web:
exposure:
include: "*"
metrics:
tags:
application: ${spring.application.name}
tracing:
sampling:
probability: 1.0
info:
os:
enabled: true
env:
enabled: true
java:
enabled: true
otlp:
tracing:
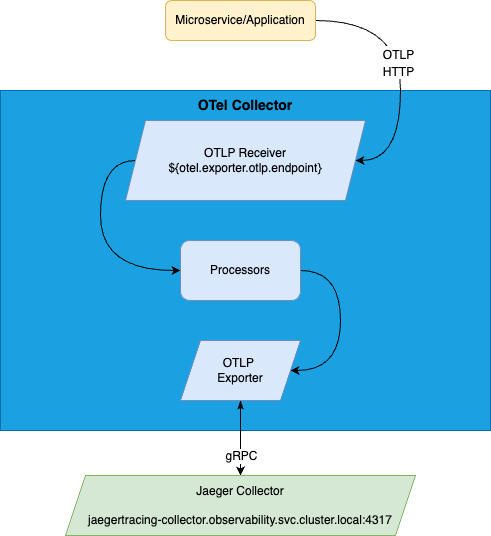
endpoint: ${otel.exporter.otlp.endpoint}
The OpenTelemetry plugin is enabled by default in APISIX. To enable tracing for your routes add the following to the route configuration:
"plugins": {
    "opentelemetry": {
        "sampler": {
            "name": "always_on"
        }
    }
}
For more configuration option for the OpenTelemetry plugin; APISIX Documentation
Jaeger is a distributed tracing system used for monitoring and troubleshooting Microservices. For more information on Jaeger, see the Jaeger website.
-
Expose the Jaeger web user interface using this command:
kubectl -n observability port-forward svc/jaegertracing-query 16686:16686 -
Open the Jaeger web user interface URL: http://localhost:16686
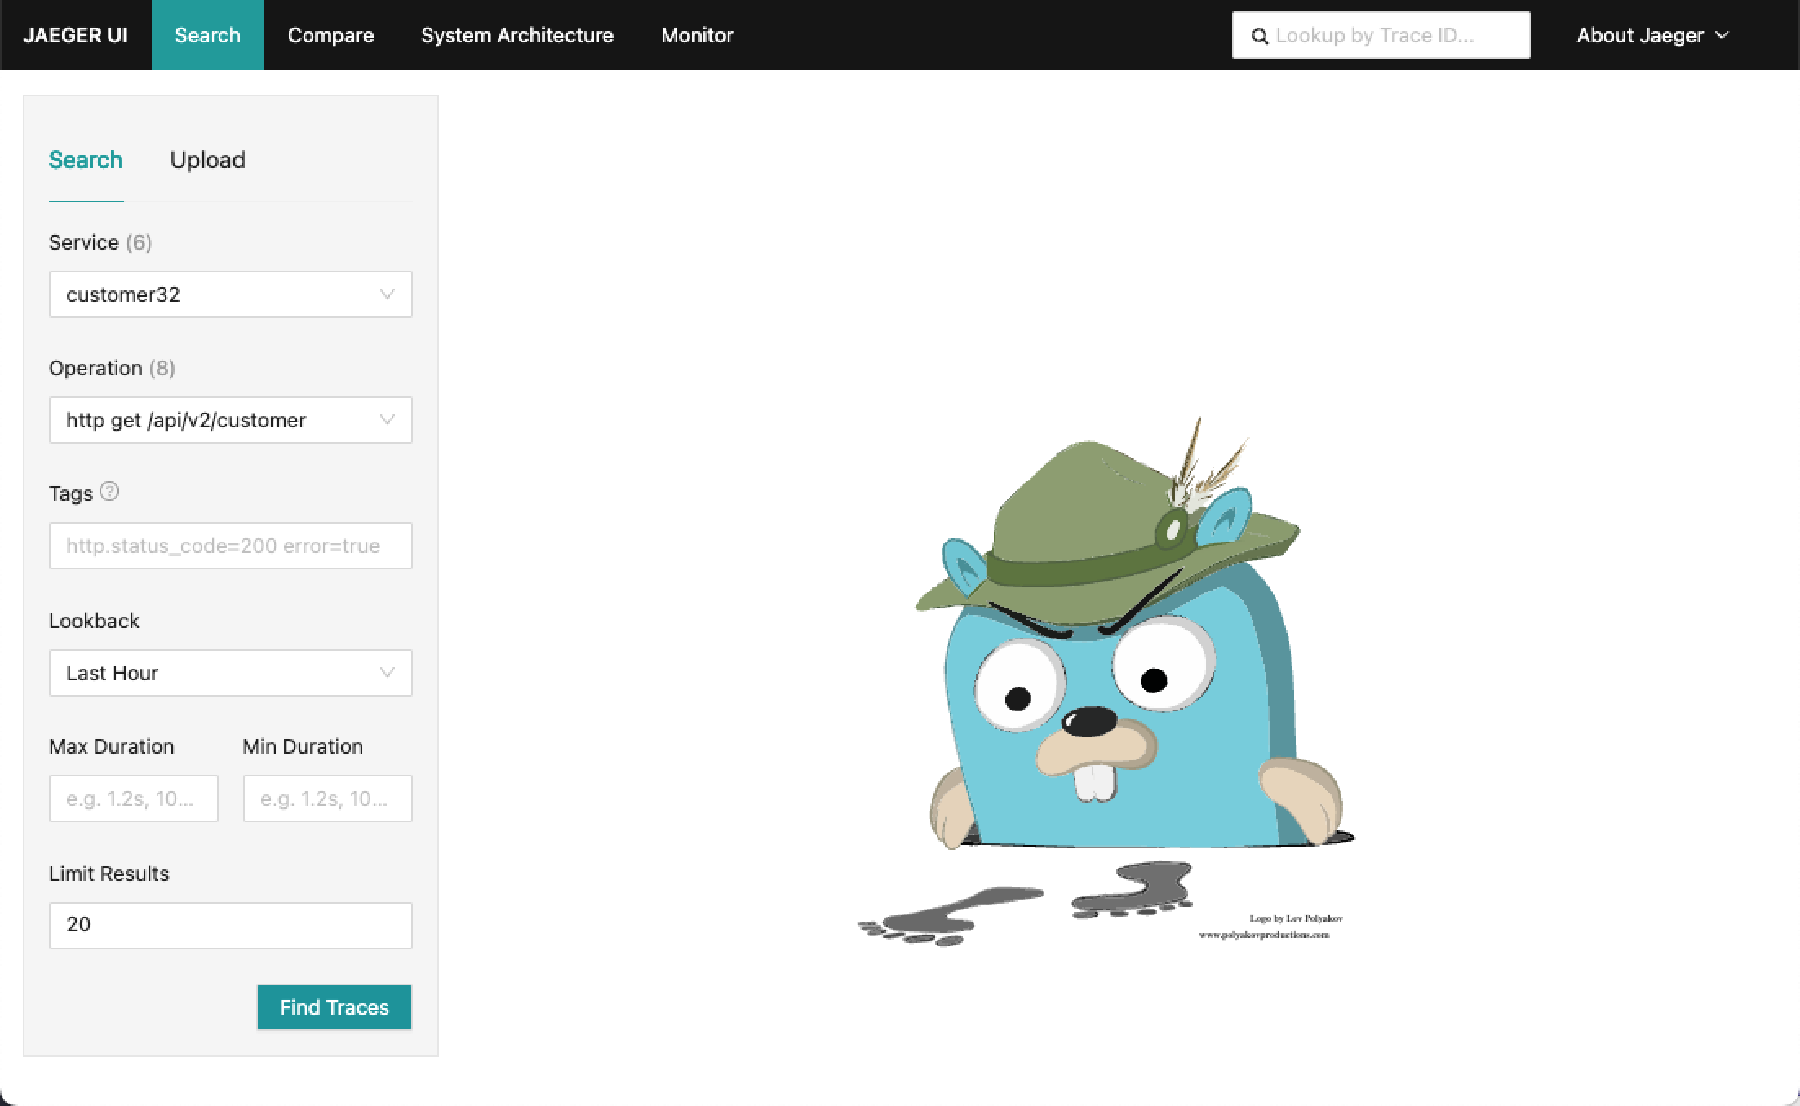
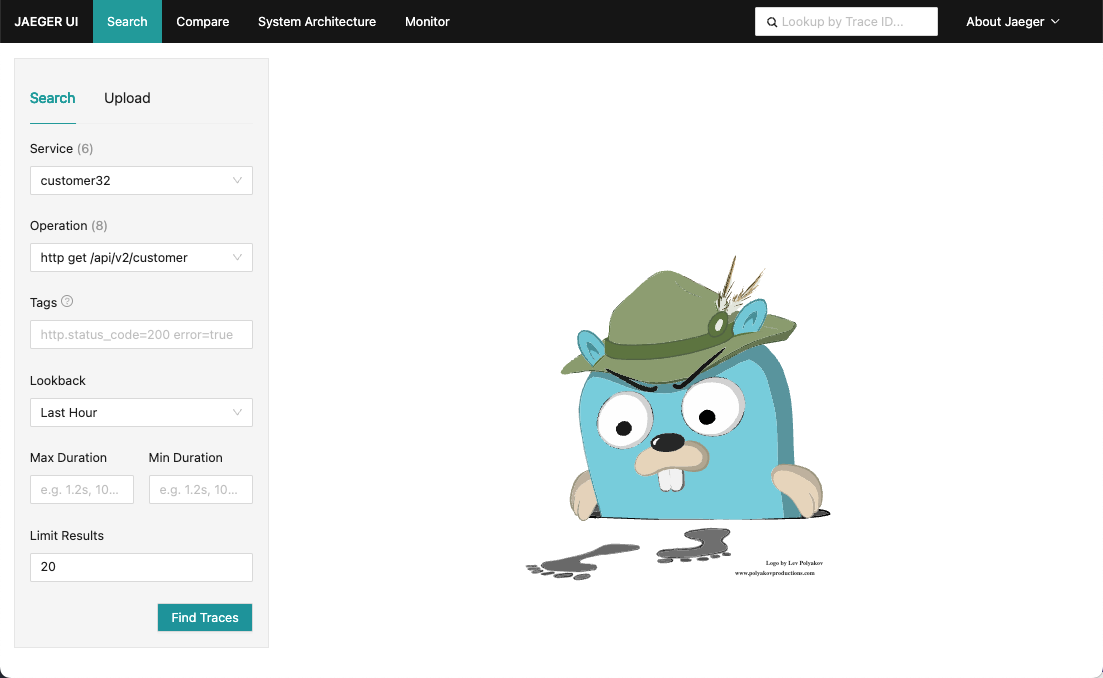
Jaeger UI -
In the Jaeger web user interface, click the Search tab to find tracings using various search criteria. For example, to find traces for the customer Microservice included in the Sample Application:
a. If you deployed the Sample Applications and have accessed the REST endpoints you can find traces for it in Jaeger. For example:
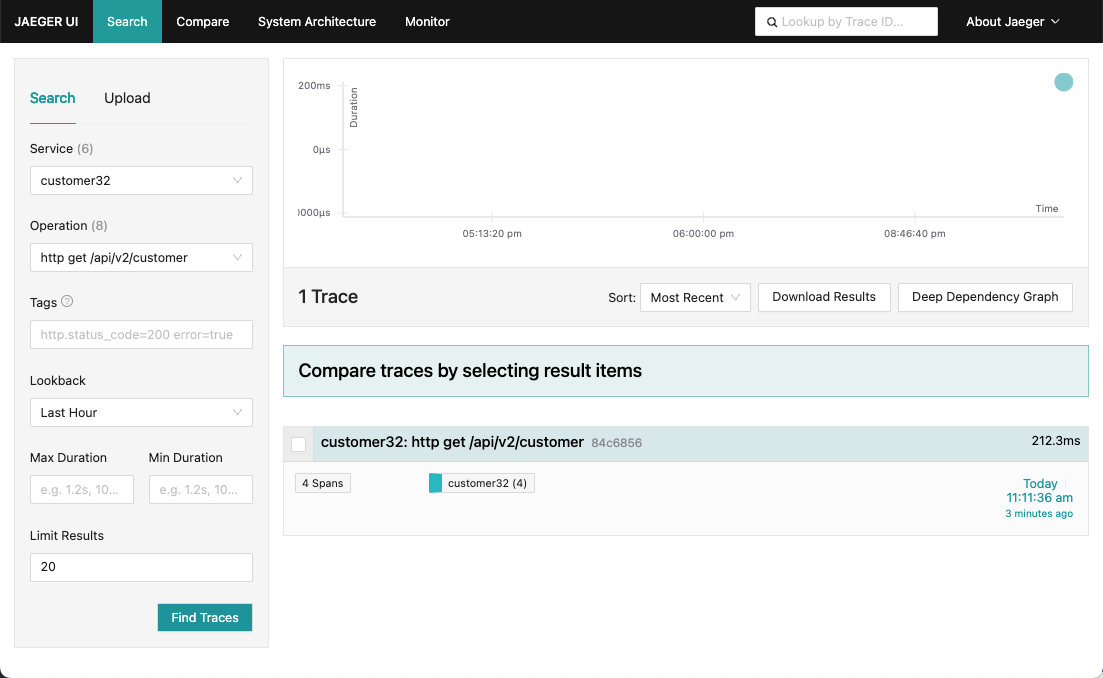
b. Select the Service
customer32and the Operation/api/v2/customers.c. Click on Find Traces. Several traces appear (one for each time that you invoked the service).
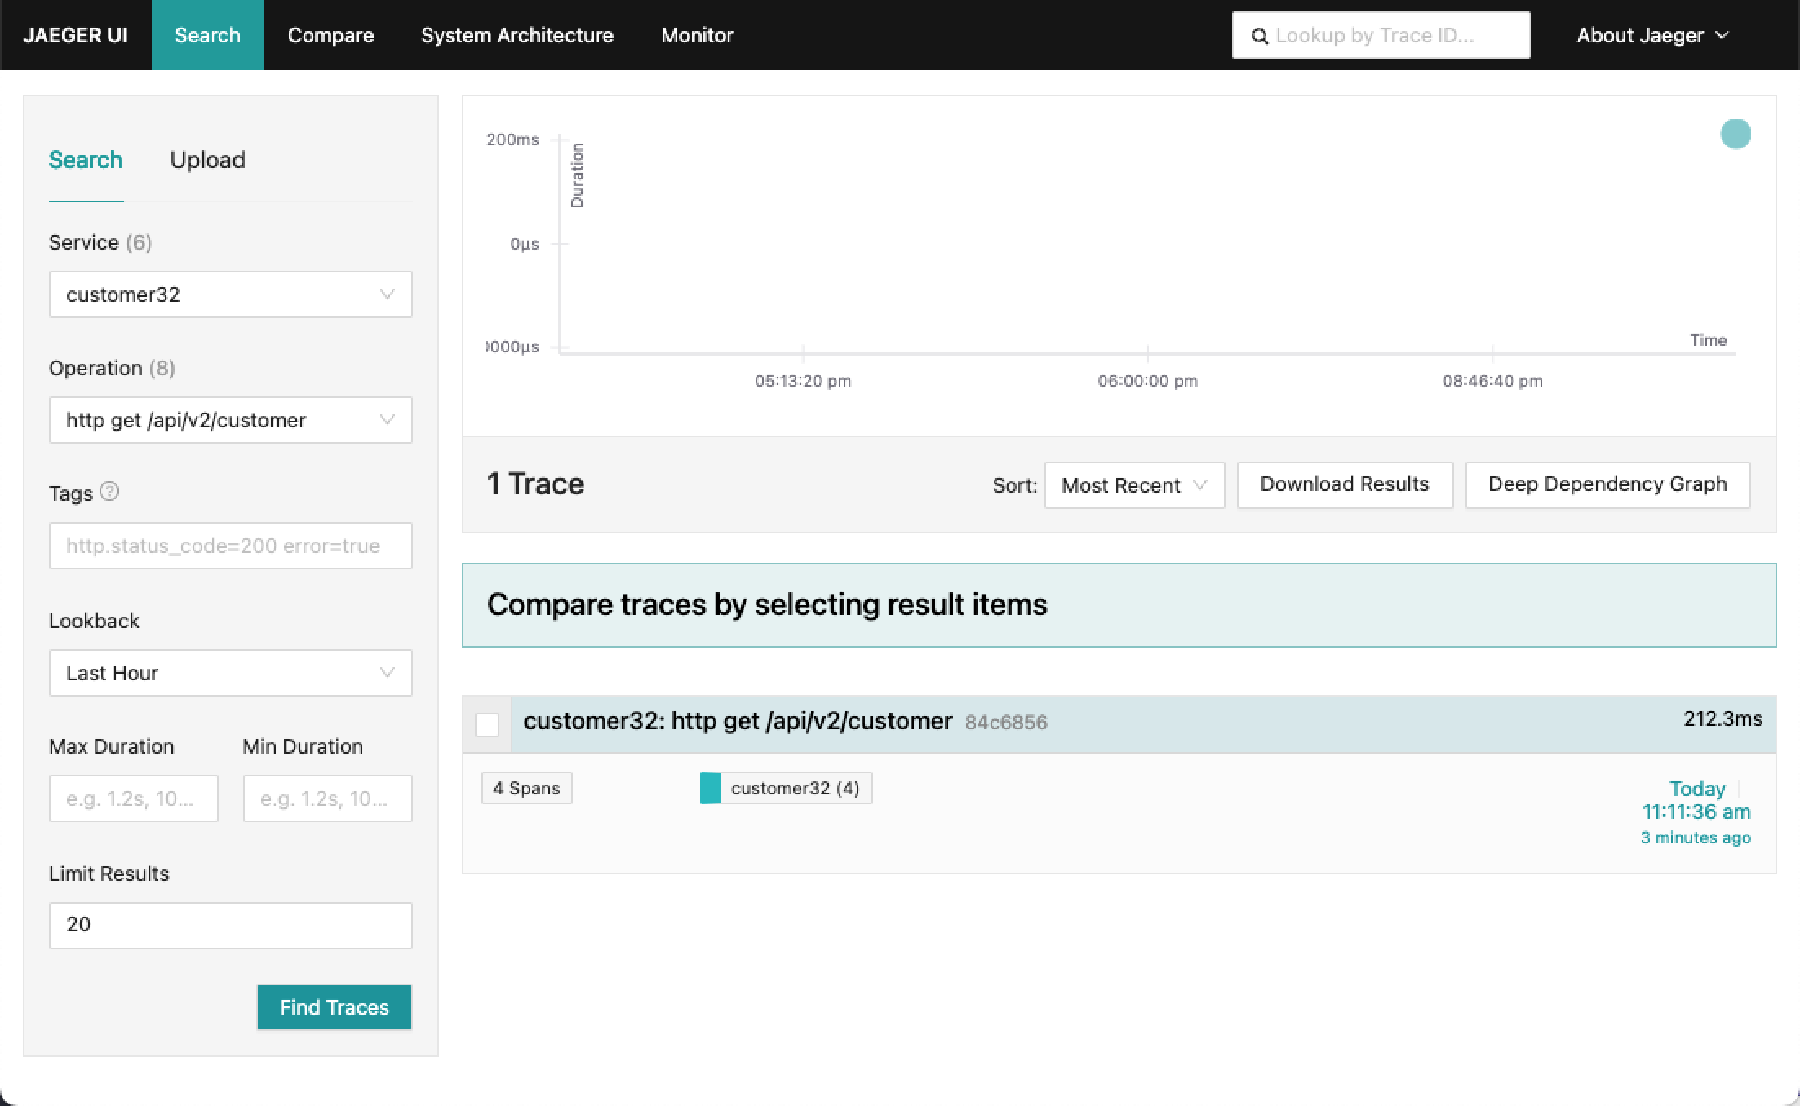
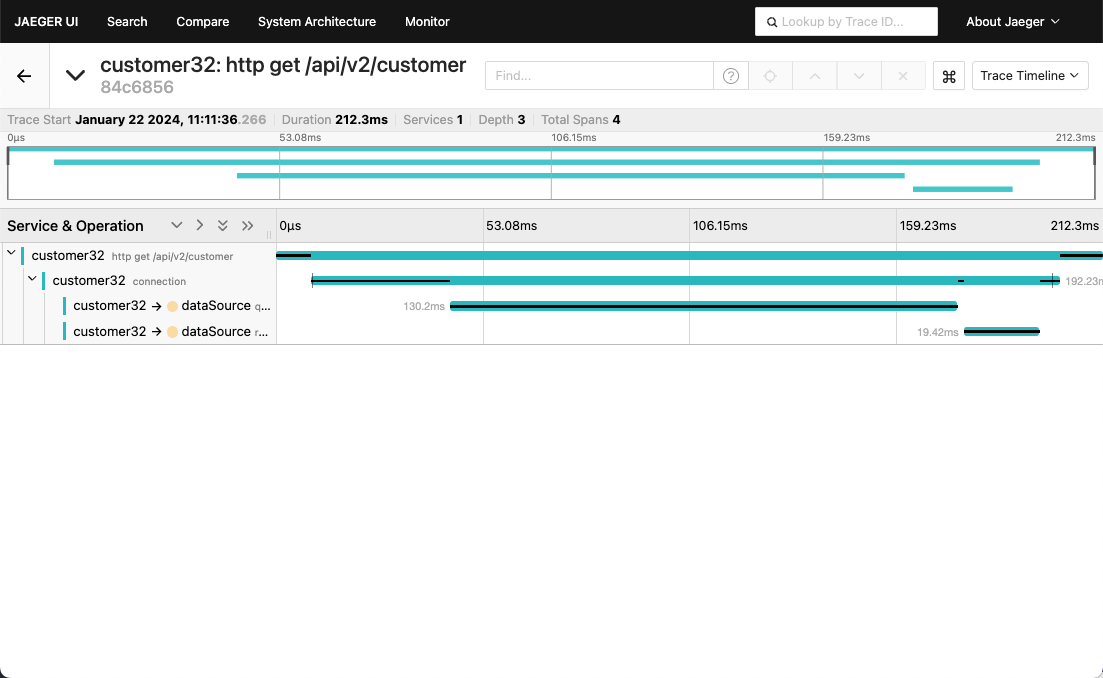
Jaeger Customer Tracing d. Click on any one of them to view the trace that includes multiple services and extends into Oracle Database. For example:

Jaeger Customer Tracing Details