
SigNoz
Oracle Backend for Microservices and AI provides built-in platform services to collect and visualize metrics, logs and traces from system and application workloads.
On this page, you will find the following topics:
- Overview
- How to access SigNoz
- Metrics
- Logs
- Traces
- Pre-installed dashboards
- Configure applications for SigNoz Observability
Oracle Backend for Microservices and AI includes SigNoz which is a observability platform to collect and provide access to logs. metrics and traces for the platform itself and for your applications.
The diagram below provides an overview of the SigNoz:
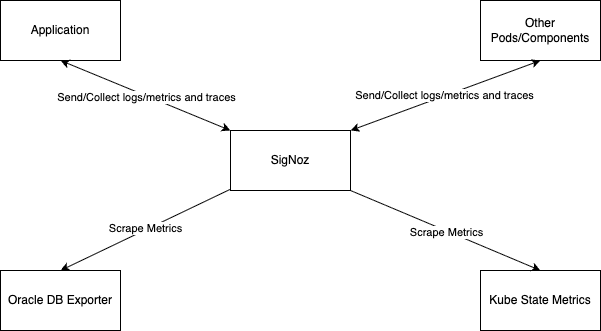
In the diagram above:
-
You may deploy applications into the platform and can either send the metrics, logs and traces to SigNoz OpenTelemetry collector or configure annotations on the application pod fo SigNoz to scrape metrics endpoints from the application pod directly. Similarly traces can be generated and sent to the SigNoz OpenTelemetry collector using the OpenTelemetry SDK. Please refer to OpenTelemetry Collector - architecture and configuration guide for details.
-
The Oracle Database Exporter and Kube State Metrics are pre-installed and SigNoz is configured to collect metrics from them.
-
SigNoz populated with a set of dashboards (some of them are described below).
-
Get the admin email and password for SigNoz
kubectl -n observability get secret signoz-authn -o jsonpath='{.data.email}' | base64 -d kubectl -n observability get secret signoz-authn -o jsonpath='{.data.password}' | base64 -d -
Expose the SigNoz user interface (UI) using this command:
kubectl -n observability port-forward svc/obaas-signoz-frontend 3301:3301 -
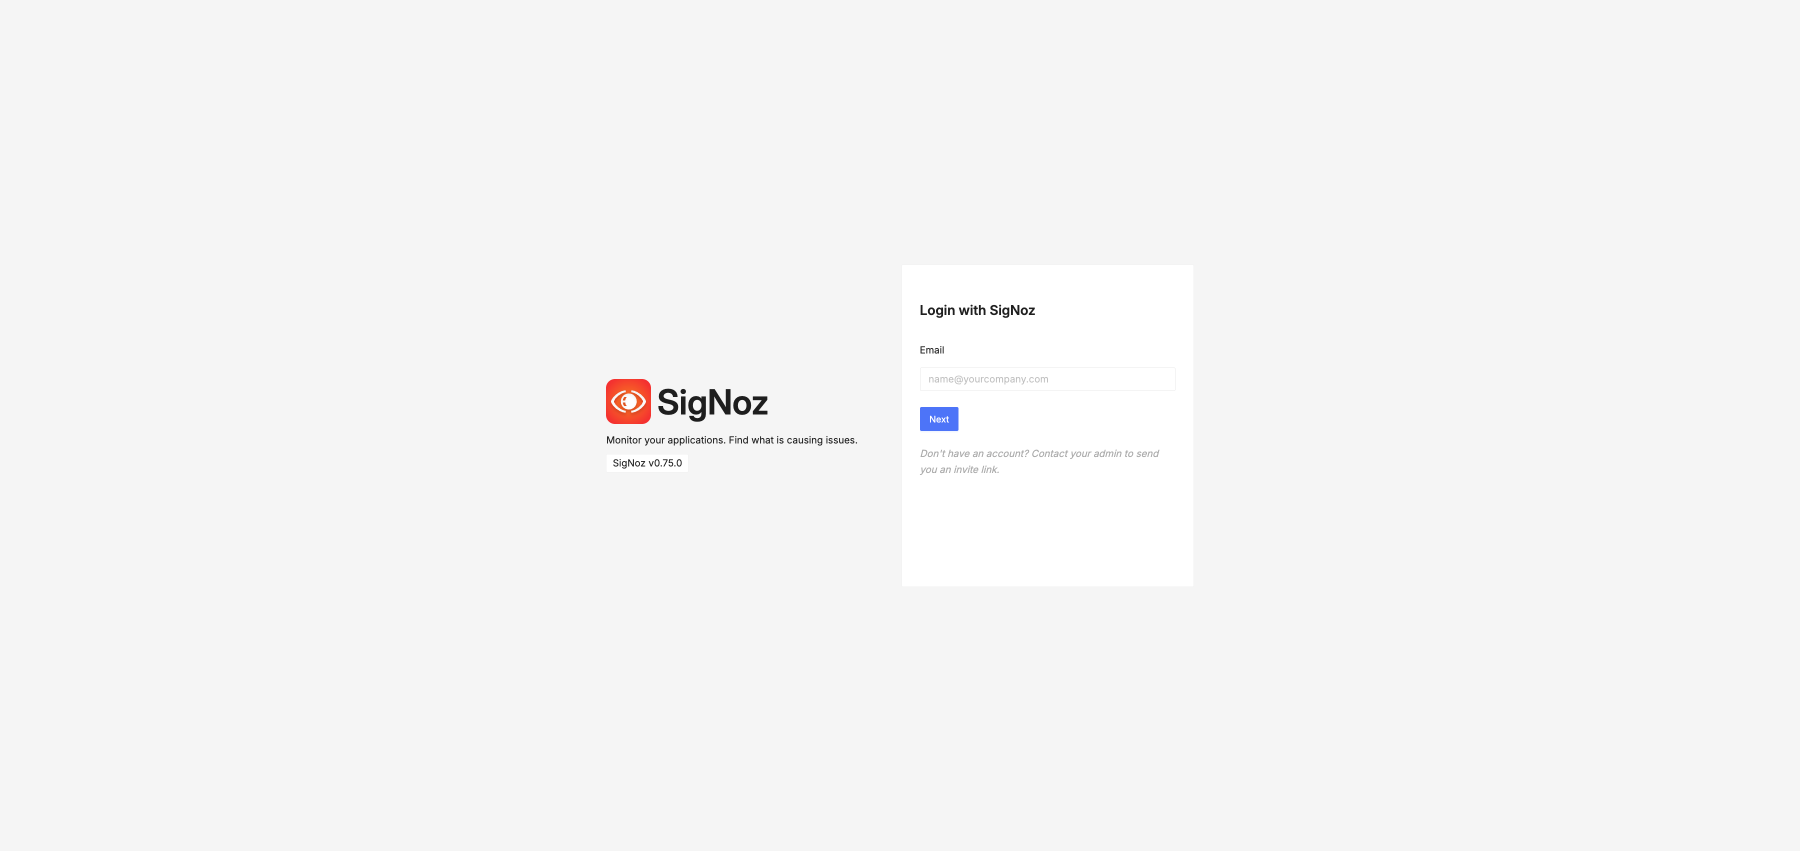
Open SigNoz Login in a browser and login with the admin email and the password you have retrieved.
SigNoz UI

To access metrics in SigNoz, click on Services in the menu to see the list of applications.
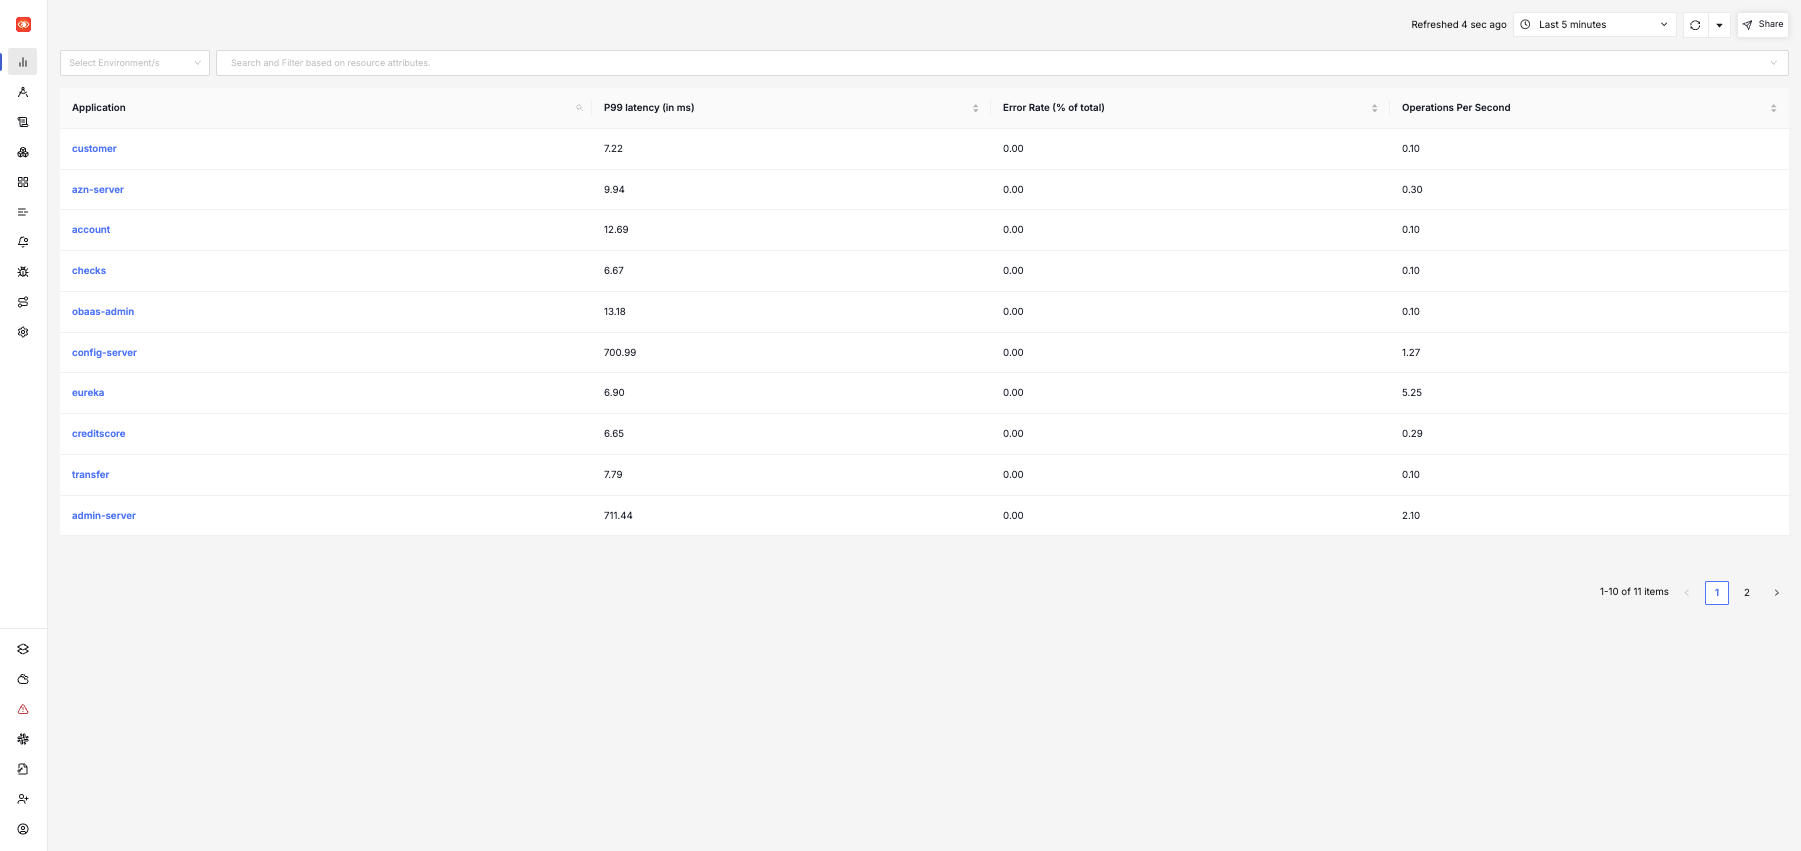
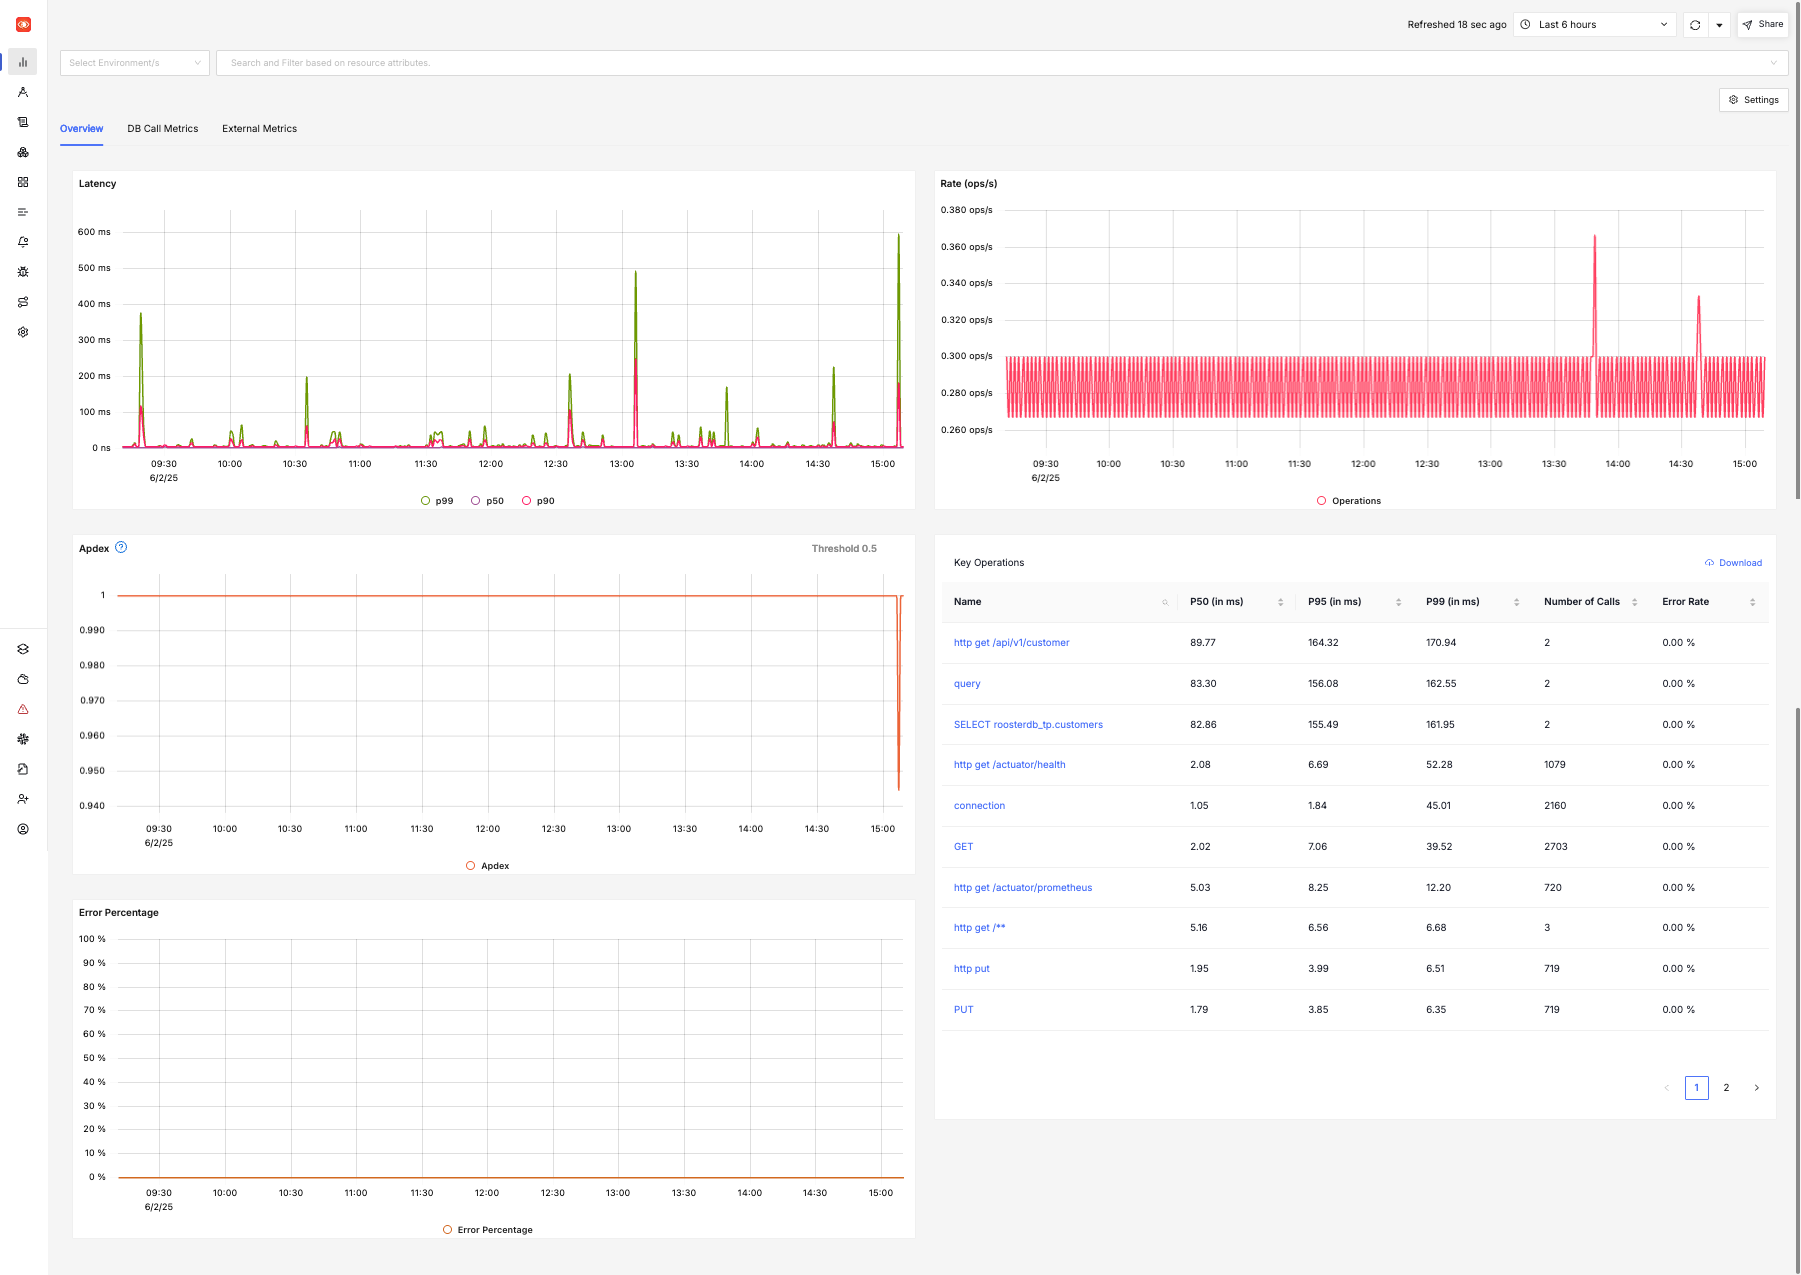
Click on any of the services, to see its metrics in a dashboard.
To access logs in SigNoz, click on Logs in the menu to access the Log Explorer where logs for all the applications and platform services can be accessed.
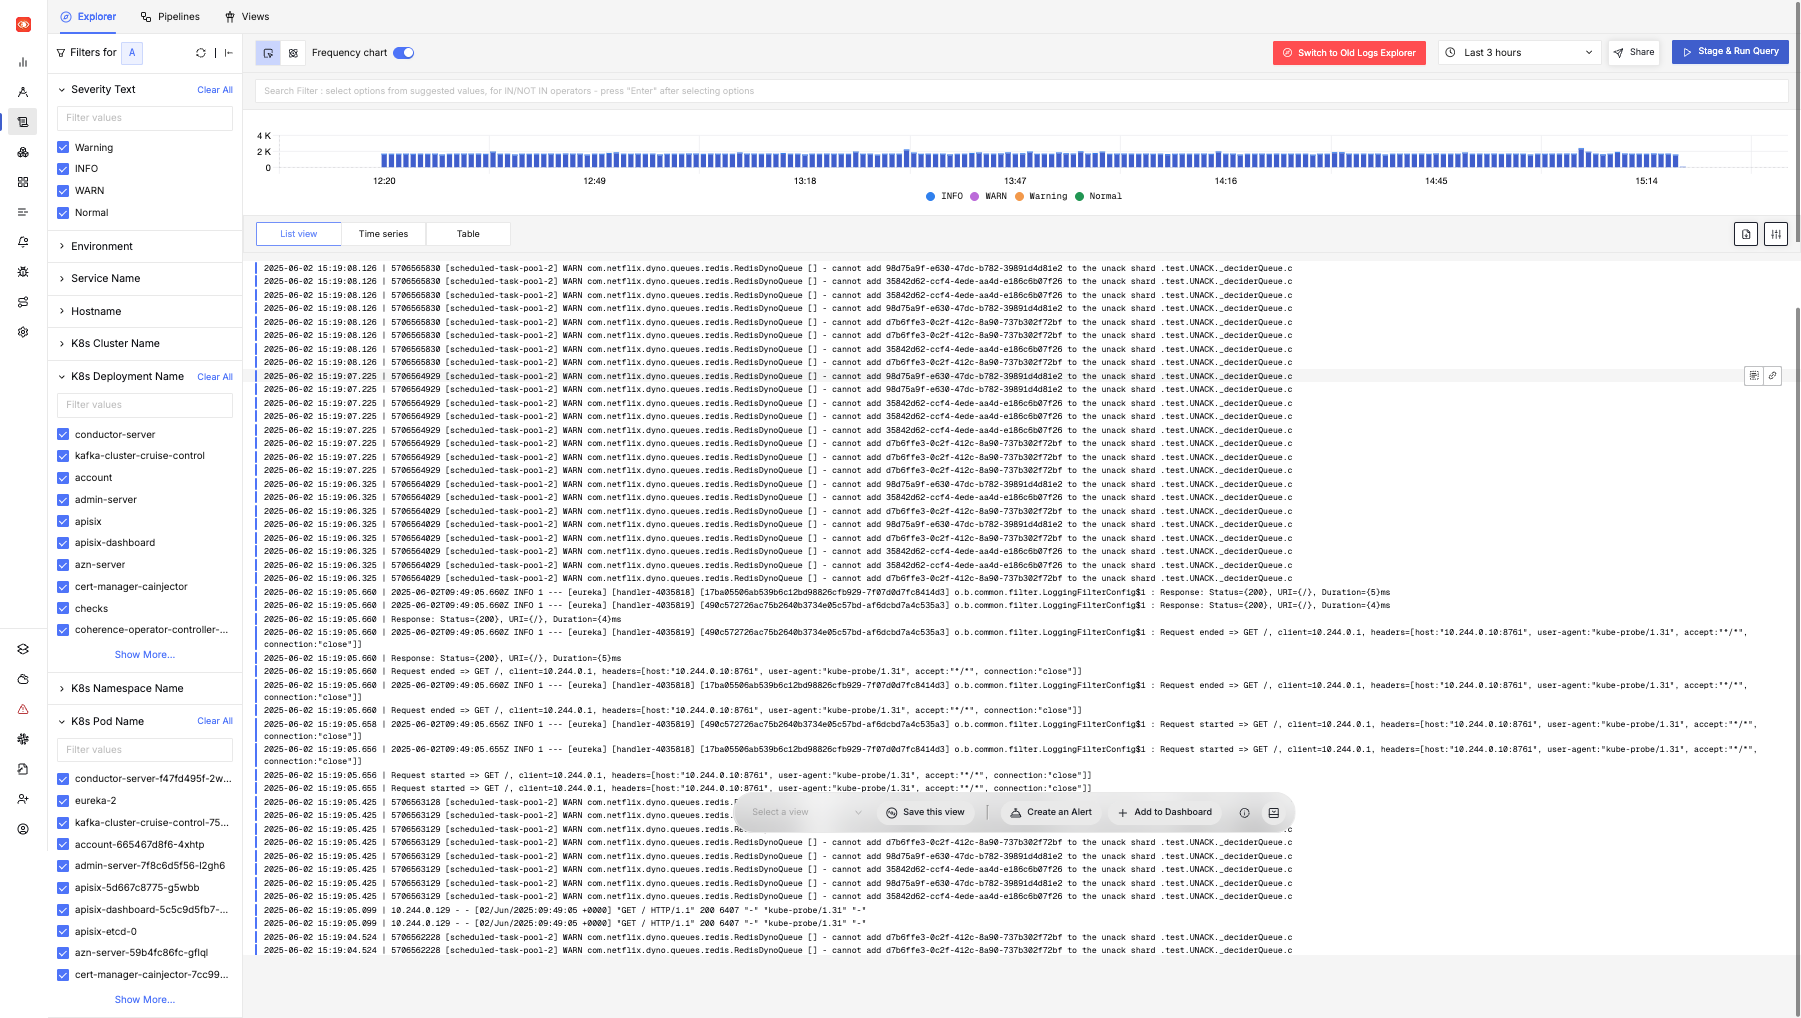
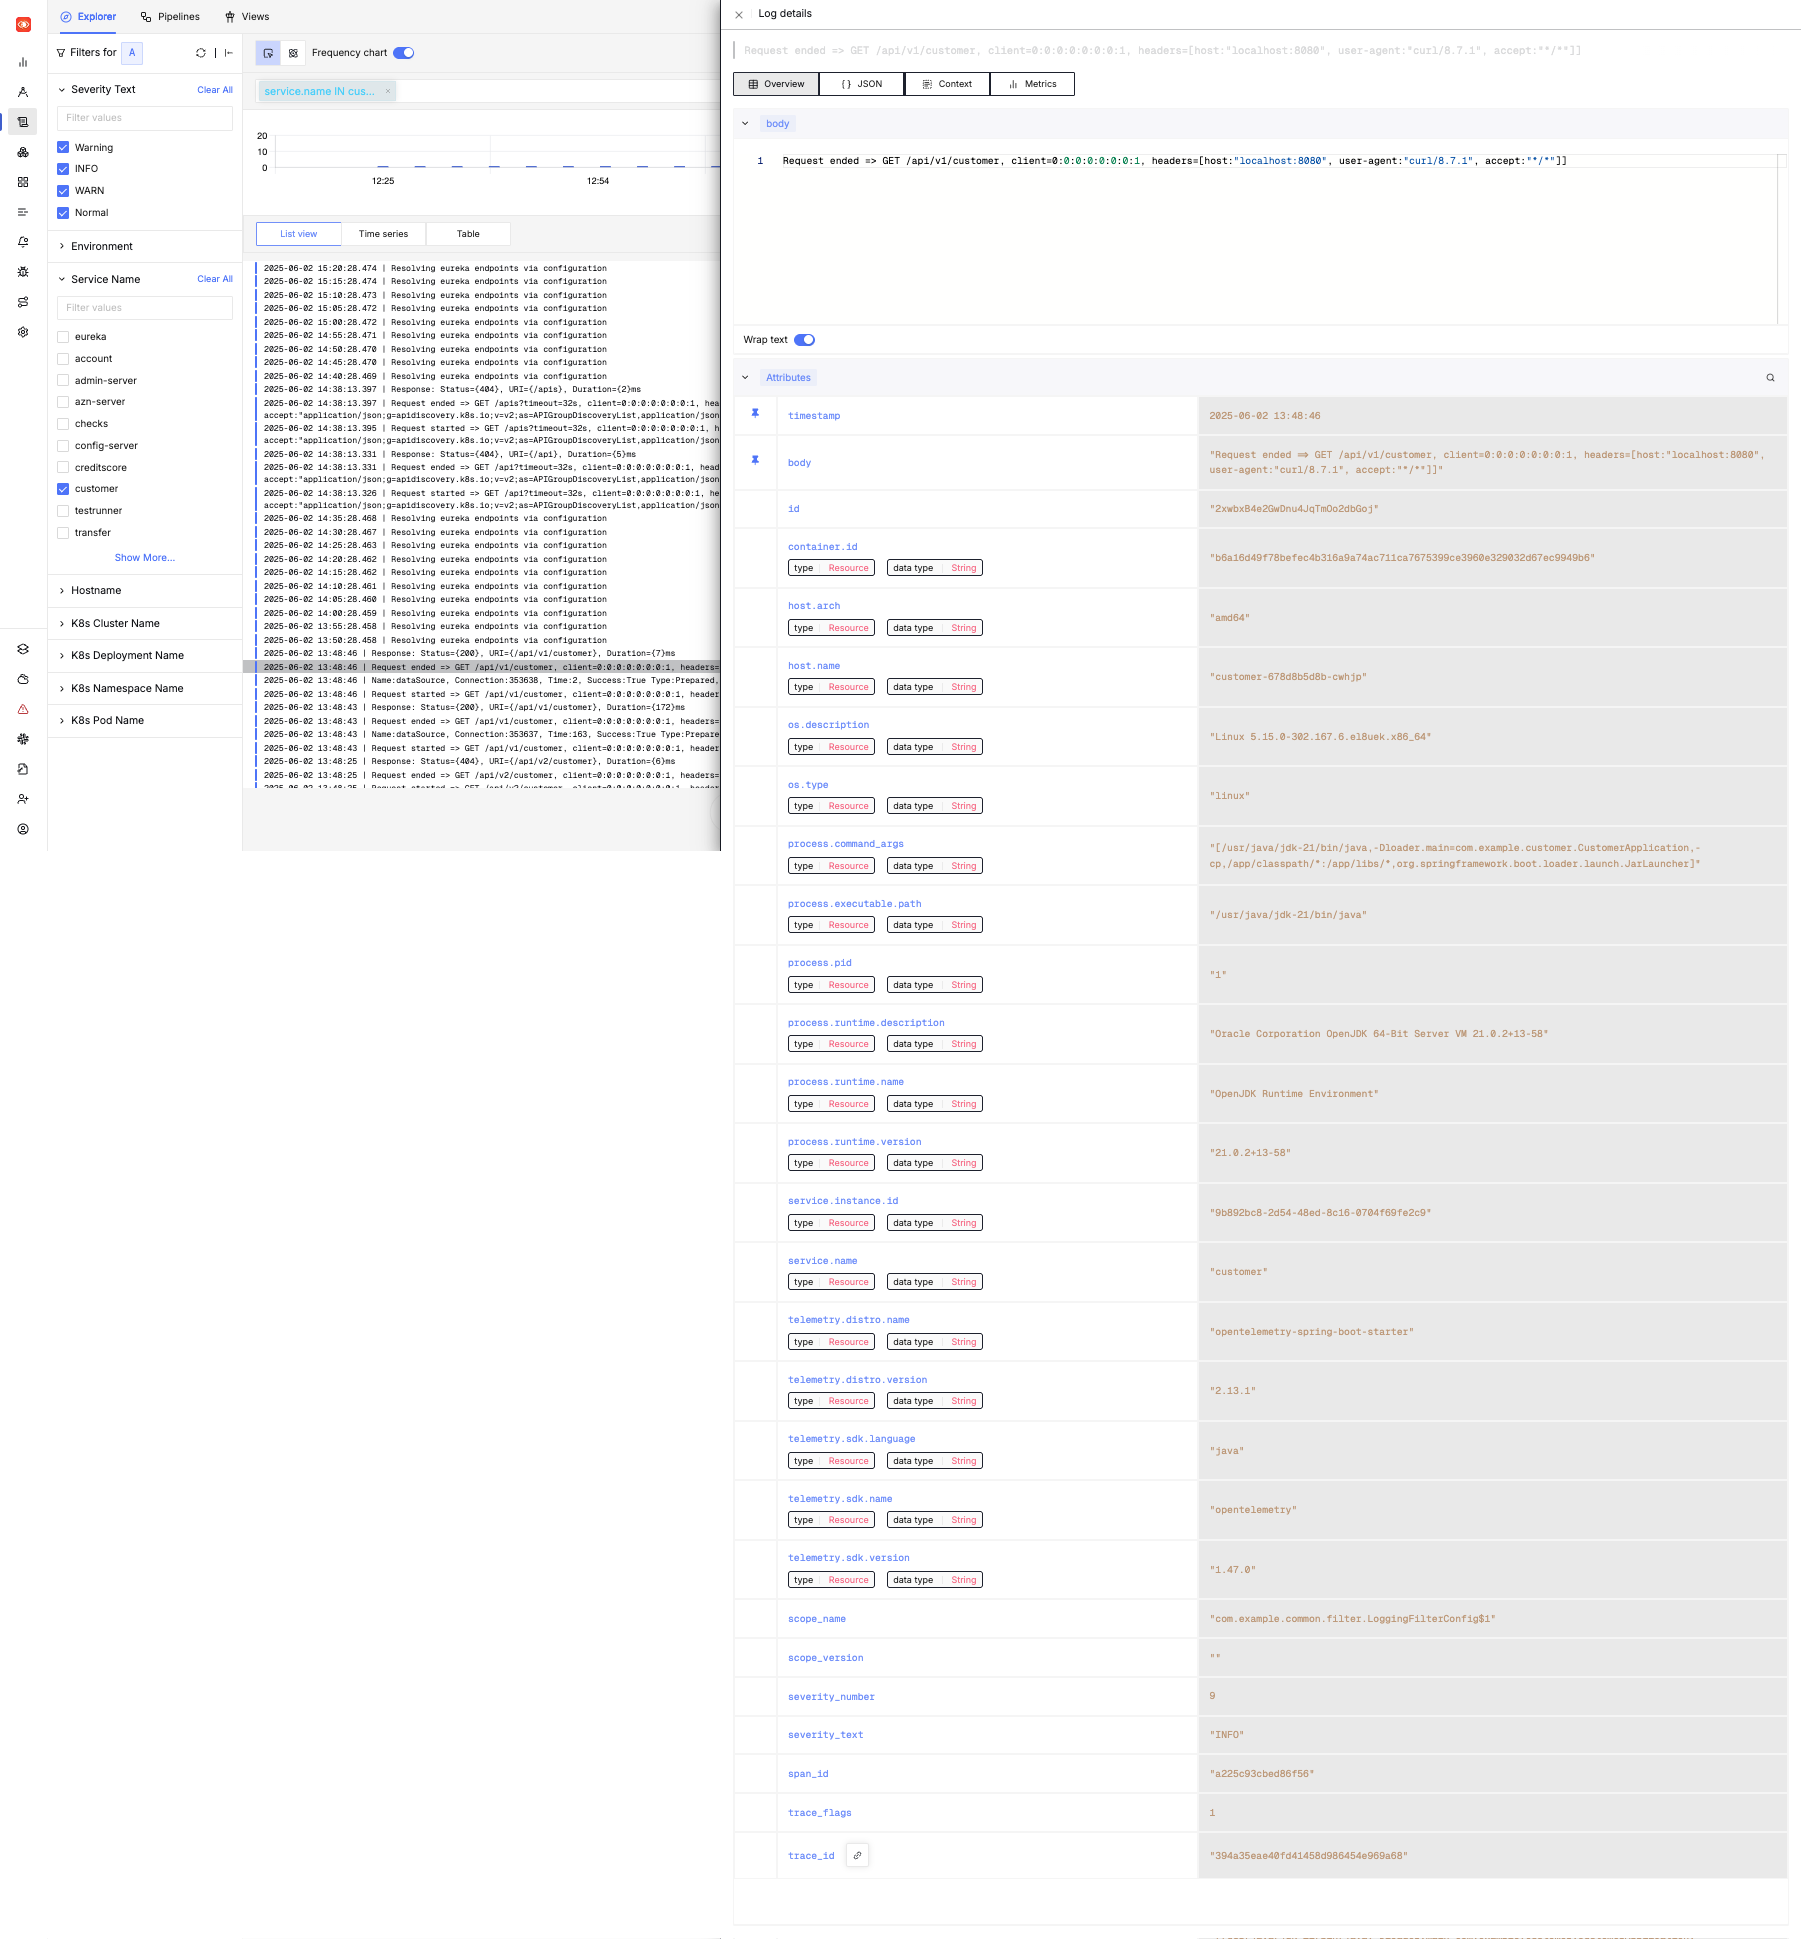
Logs can be filtered based on Namespaces, Deployments, Pods etc. Clicking on any log line will show more details regarding a log event.
To access Traces in SigNoz, click on Traces in the menu to access the Traces view where all trace events can be accessed.
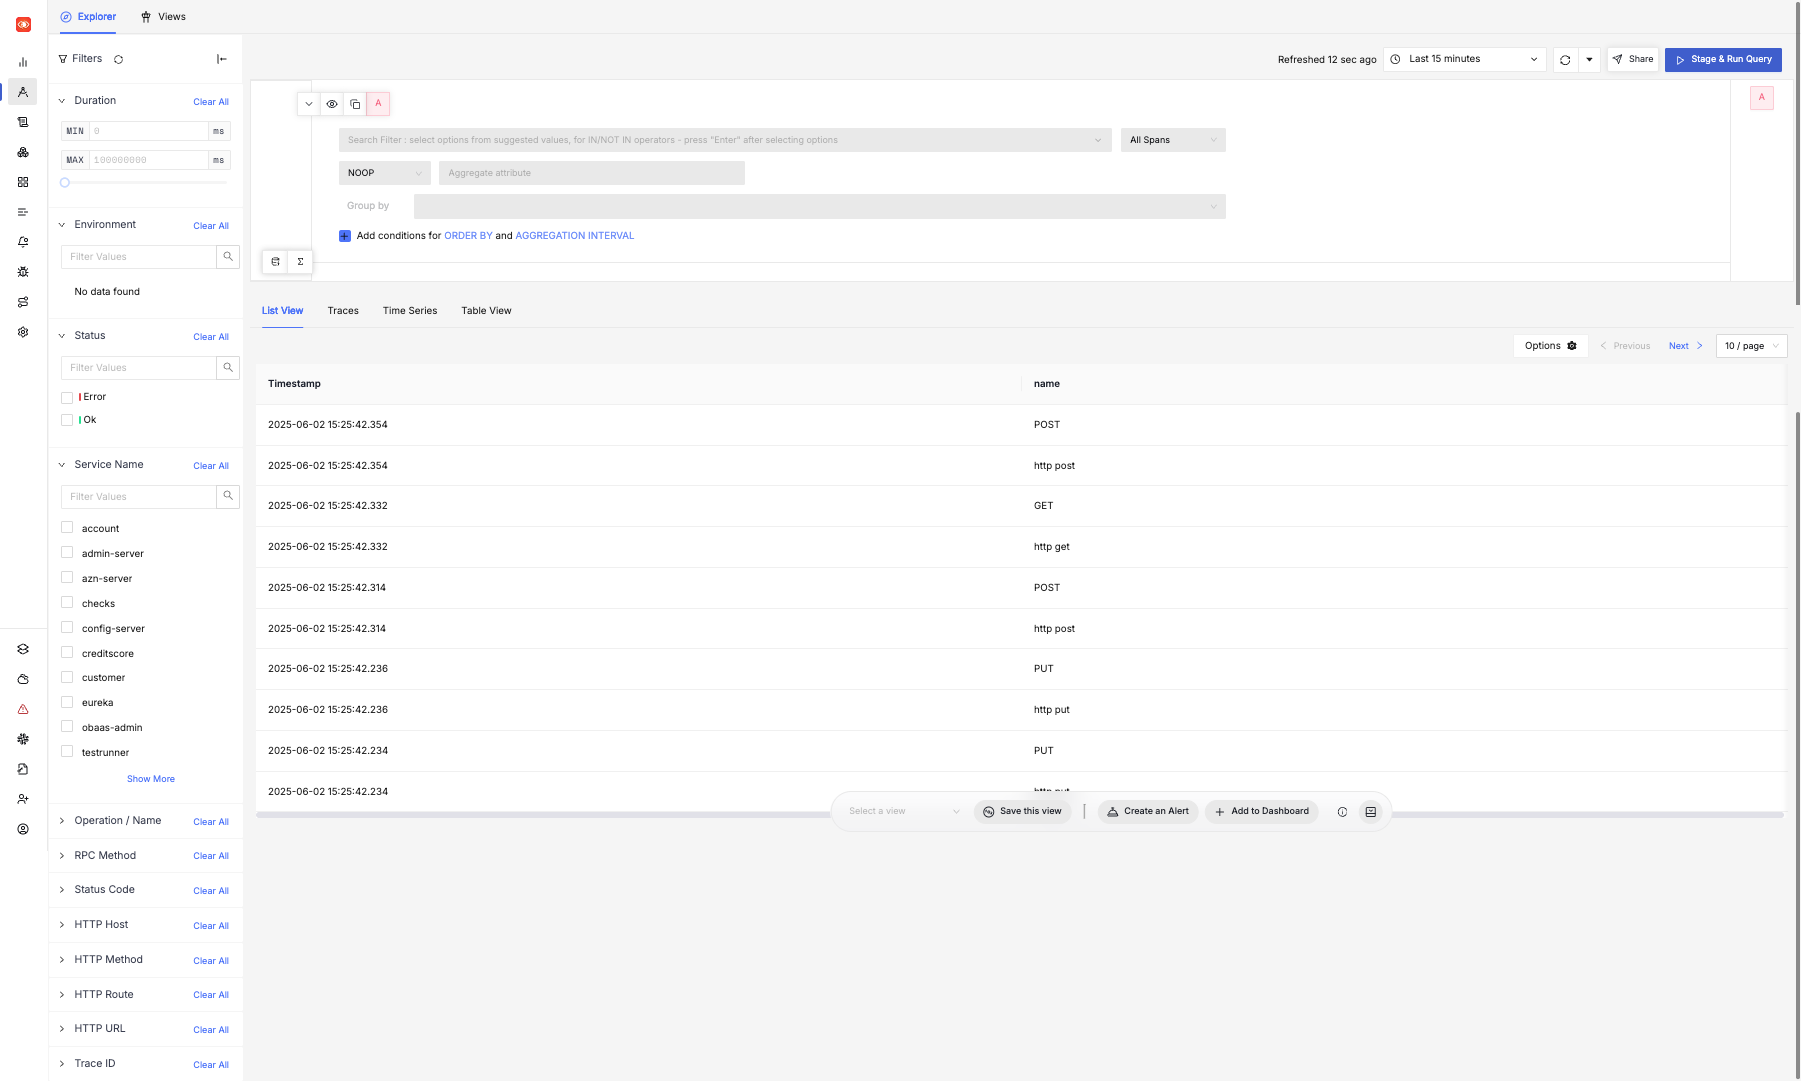
Traces can be filtered based on Service, HTTP Routes etc. Click on a trace to see its details.
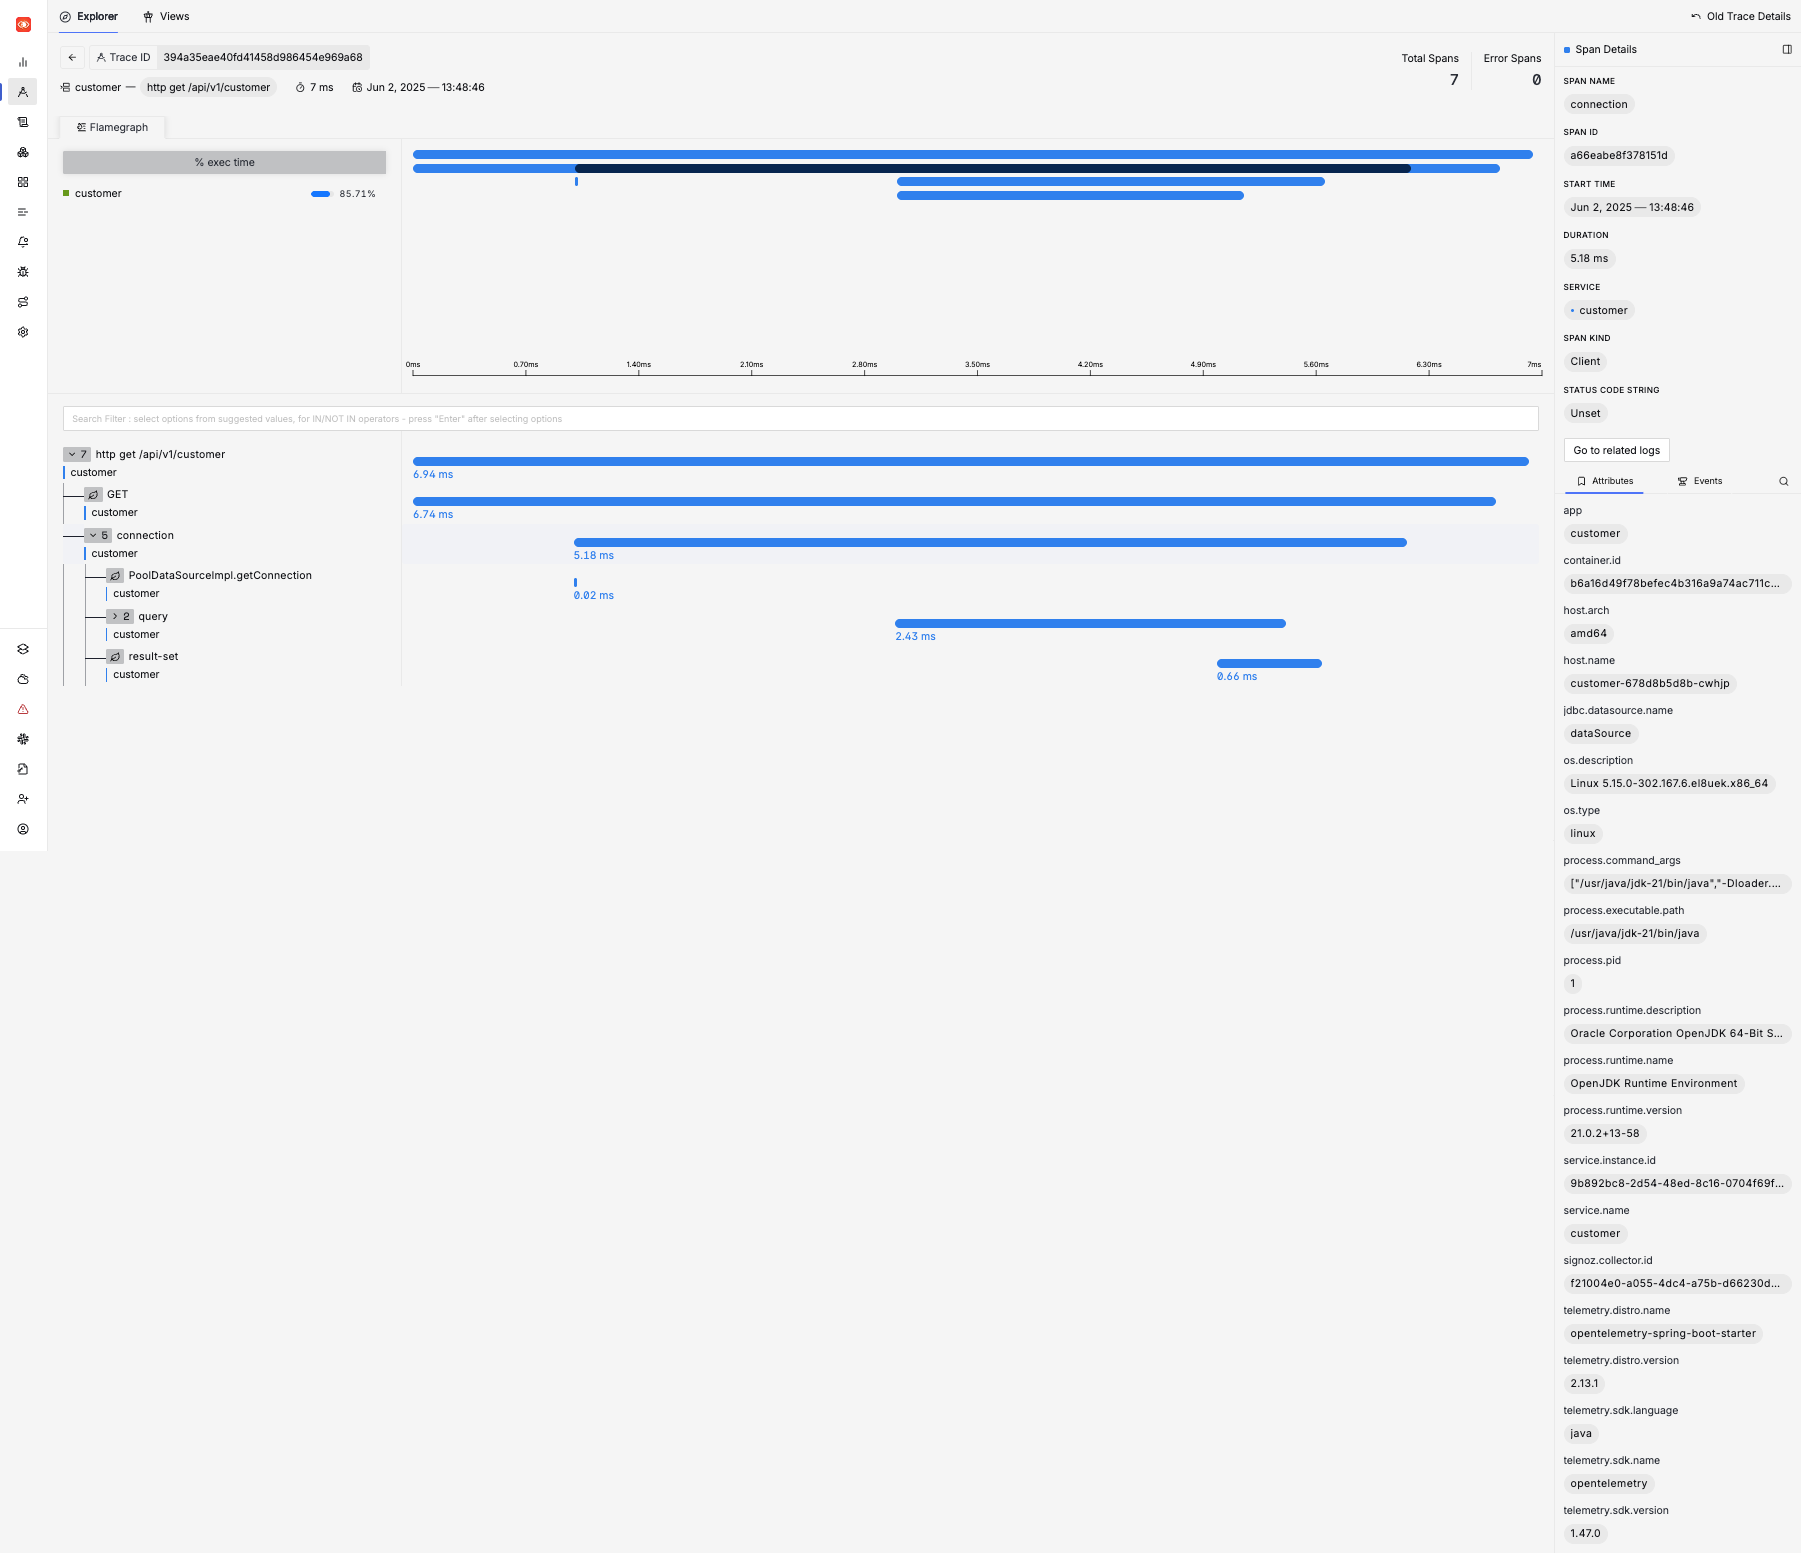
Logs for a trace event can directly be accessed using the Go to related logs link.
The following dashboards are pre-installed in SigNoz:
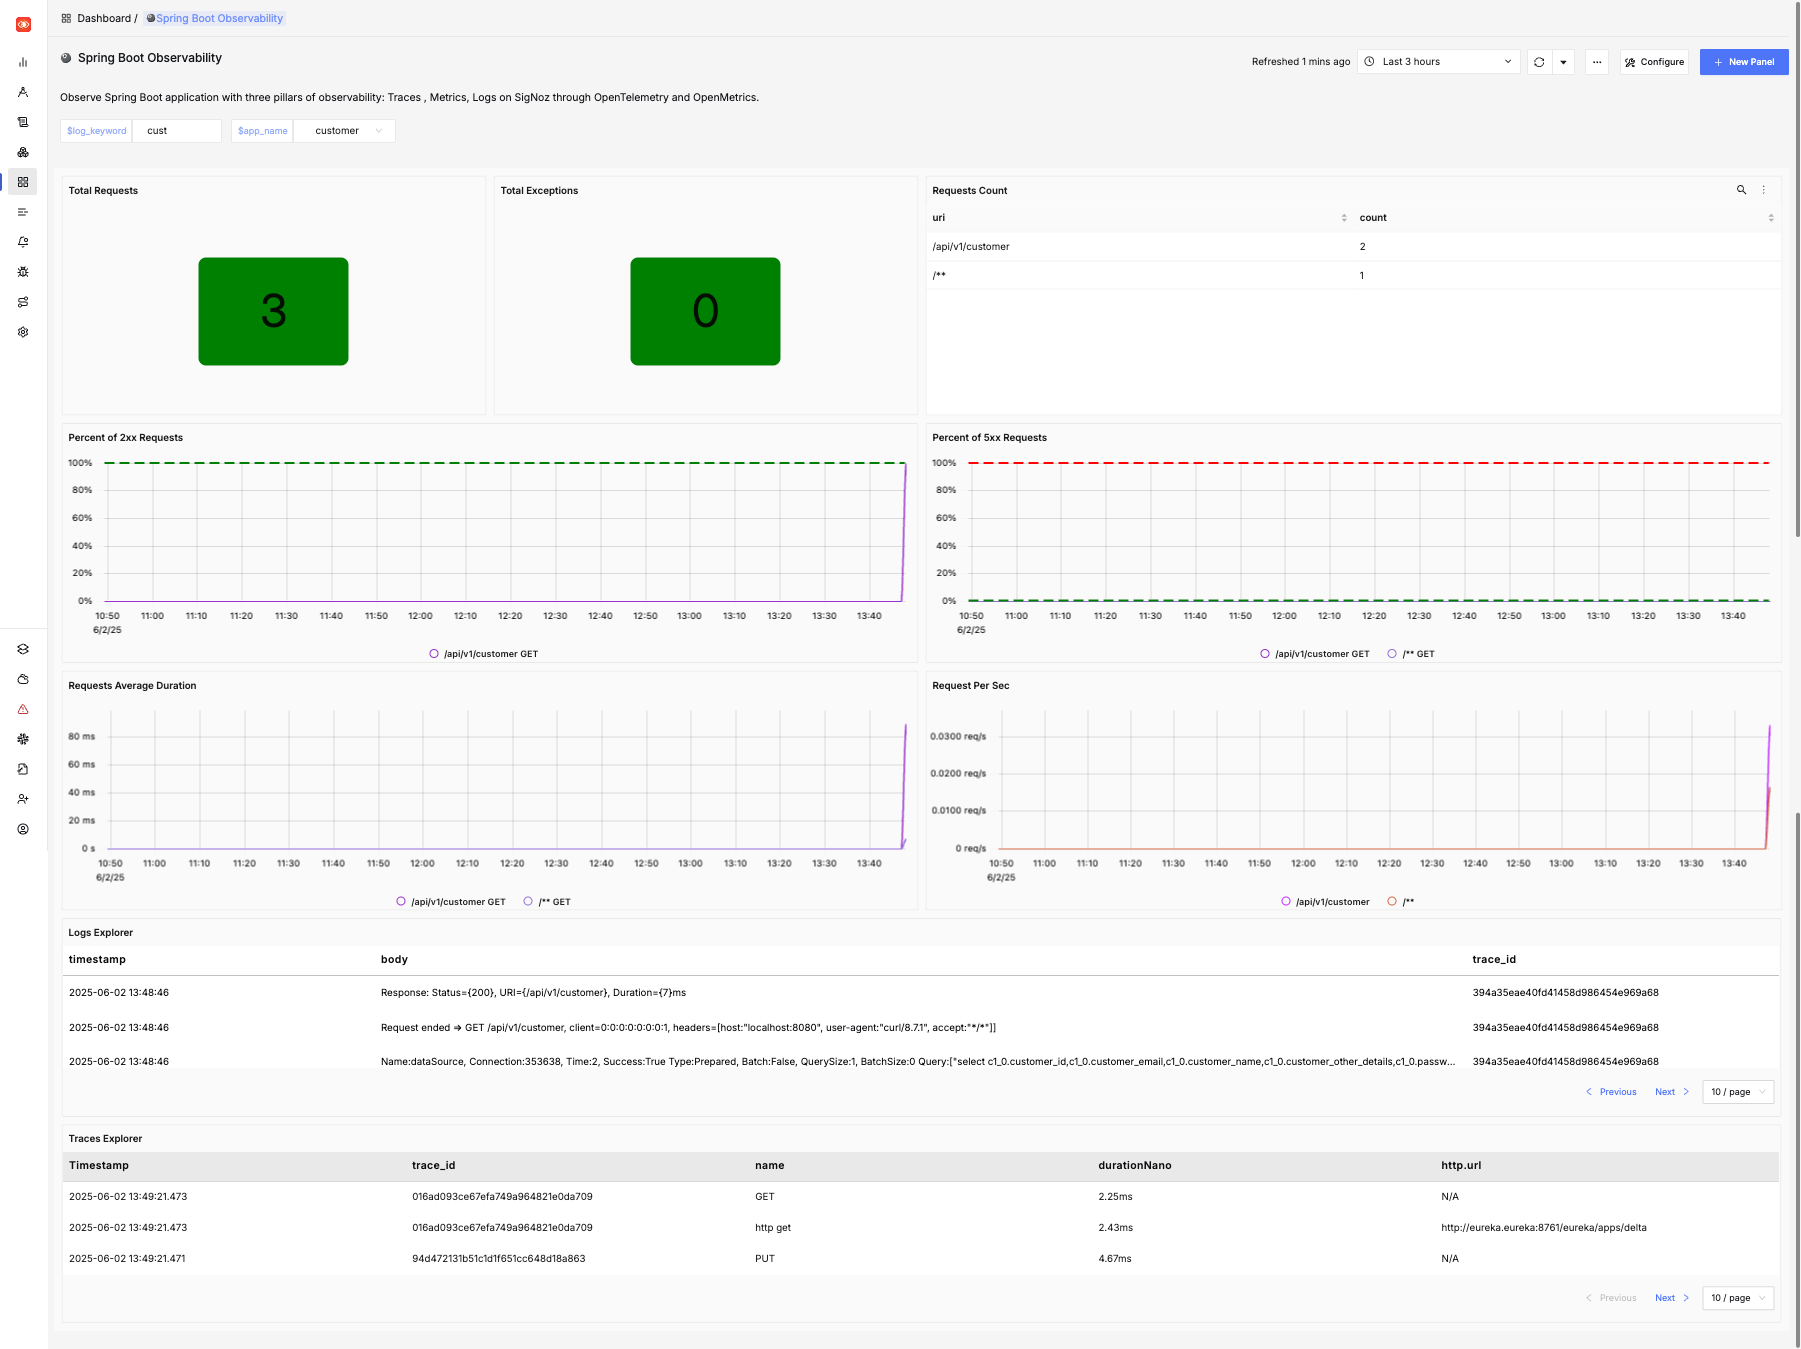
This dashboard provides details of one or more Spring Boot applications including the following:
- The number of HTTP requests received by the application
- A breakdown of which URL paths requests were received for
- The average duration of requests by path
- The number of exceptions encountered by the application
- Details of 2xx (that is, successful) and 5xx (that is, exceptions) requests
- The request rate per second over time, by path
- Log messages from the service
You may adjust the time period and to drill down into issues, and search the logs for particular messages. This dashboard is designed for Spring Boot 3.x applications. Some features may work for Spring Boot 2.x applications.
Here is an example of this dashboard displaying data for a simple application:
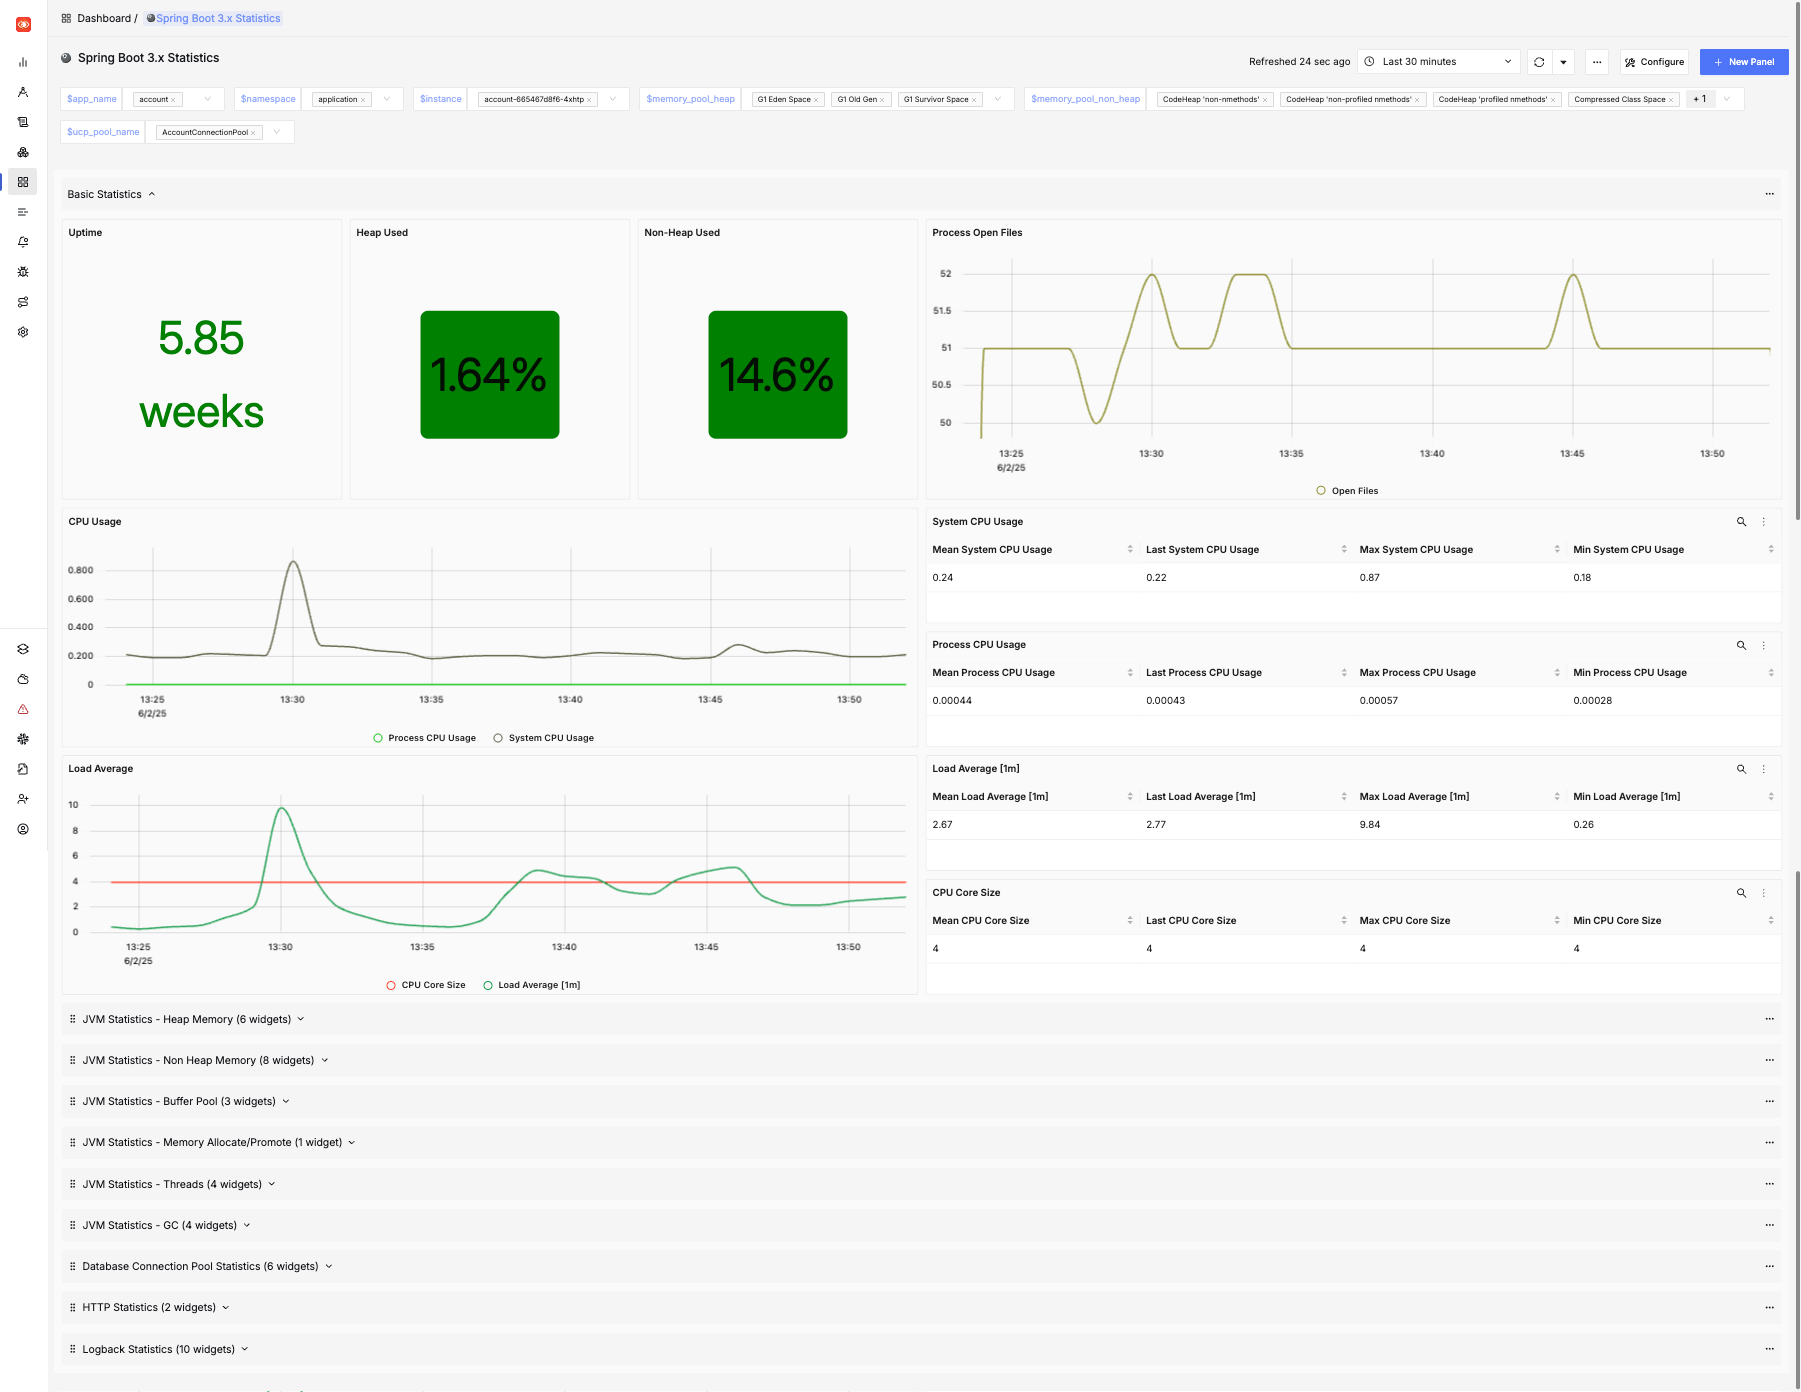
This dashboard provides more in-depth information about services including the following:
- JVM statistic like heap and non-heap memory usage, and details of garbage collection
- Load average and open files
- Database connection pool statistics (for HikariCP)
- HTTP request statistics
- Logging (logback) statistics
You may adjust the time period and to drill down into issues, and search the logs for particular messages. This dashboard is designed for Spring Boot 3.x applications. Some features may work for Spring Boot 2.x applications.
Here is an example of this dashboard displaying data for a simple application:
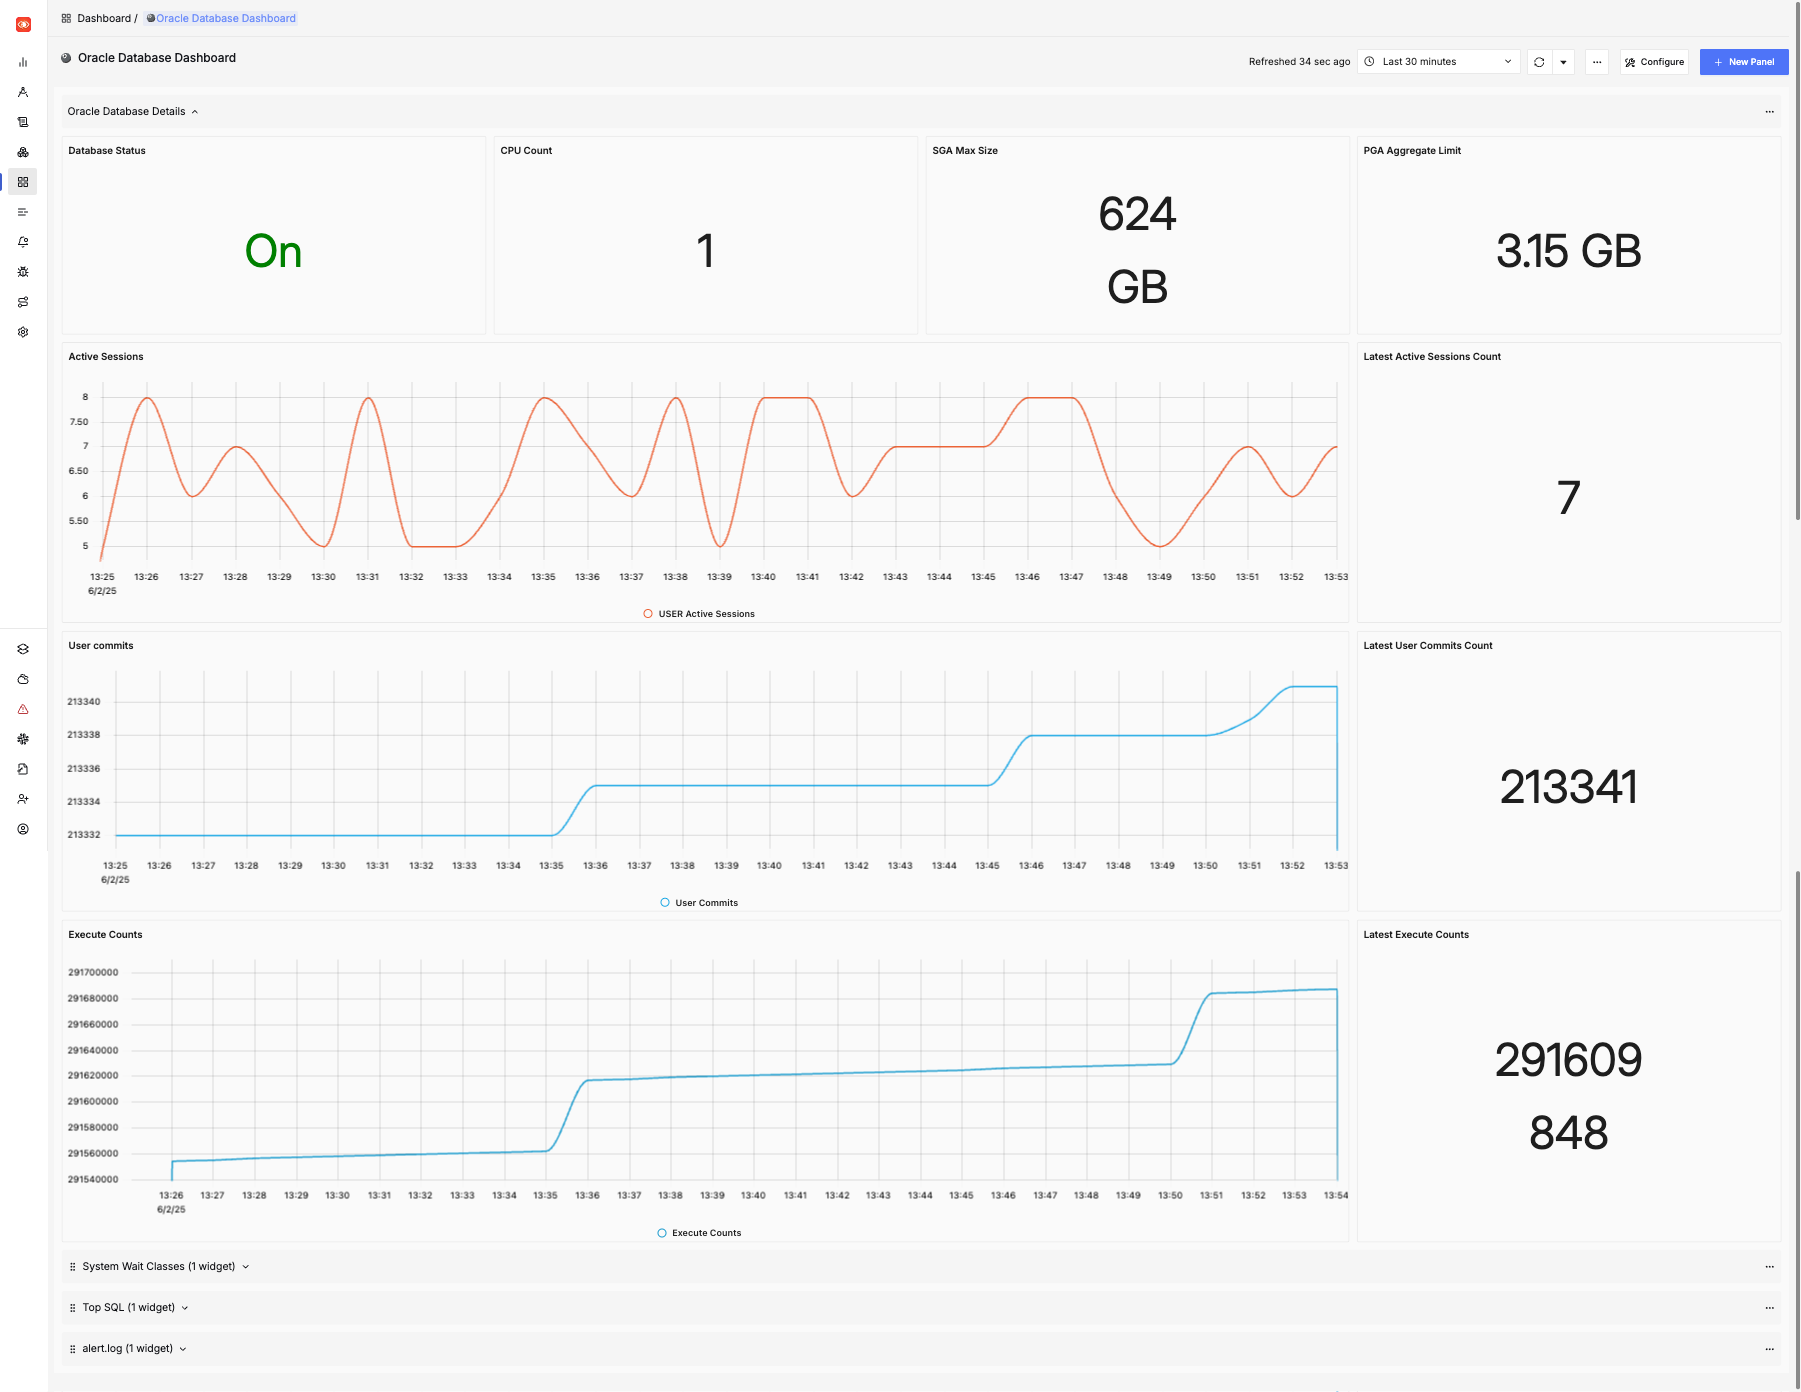
This dashboard provides details about the Oracle Database including:
- SGA and PGA size
- Active sessions
- User commits
- Execute count
- CPU count and platform
- Top SQL
- Wait time statistics by class
Here is an example of this dashboard:
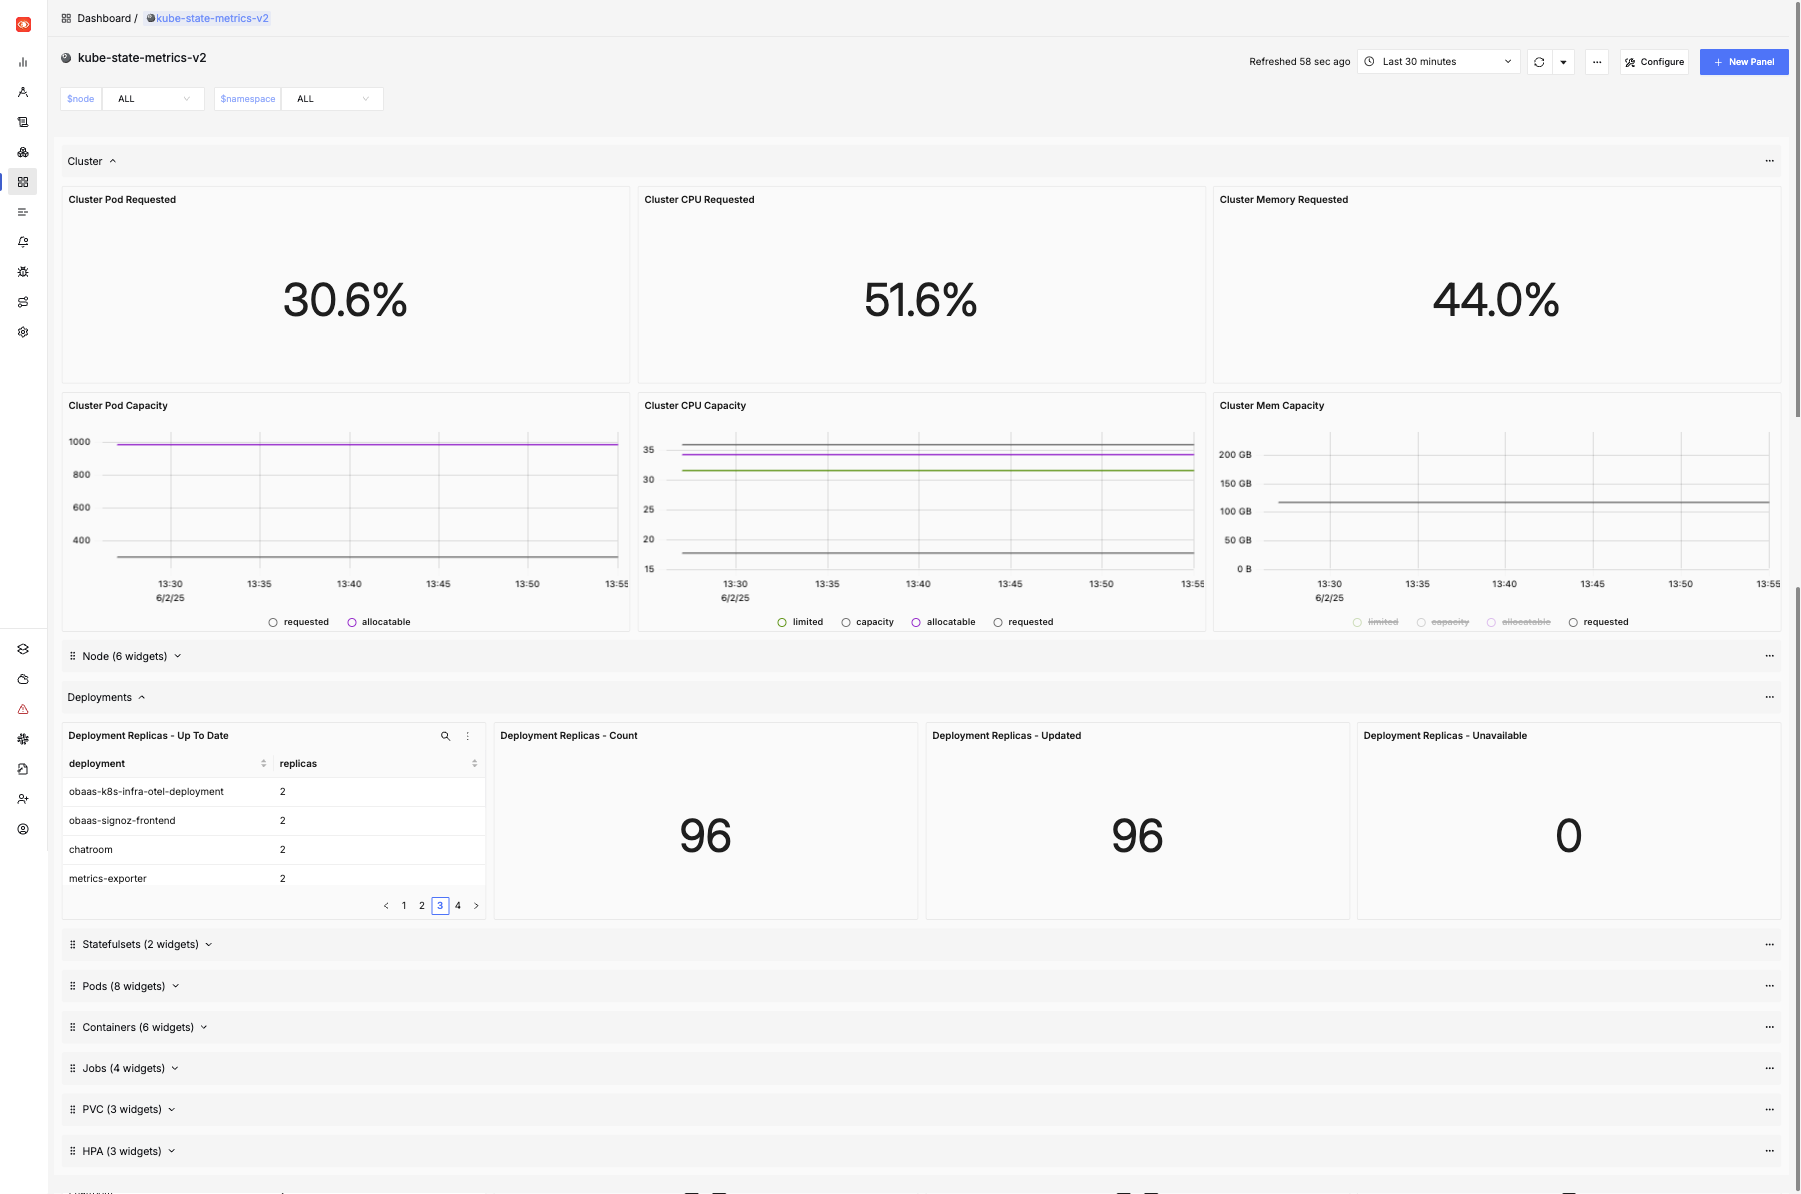
This dashboard provides details of the Kubernetes cluster including:
- Pod capacity and requests for CPU and memory
- Node availability
- Deployment, Stateful Set, Pod, Job and Container statistics
- Details of horizontal pod autoscalers
- Details of persistent volume claims
Here is an example of this dashboard:
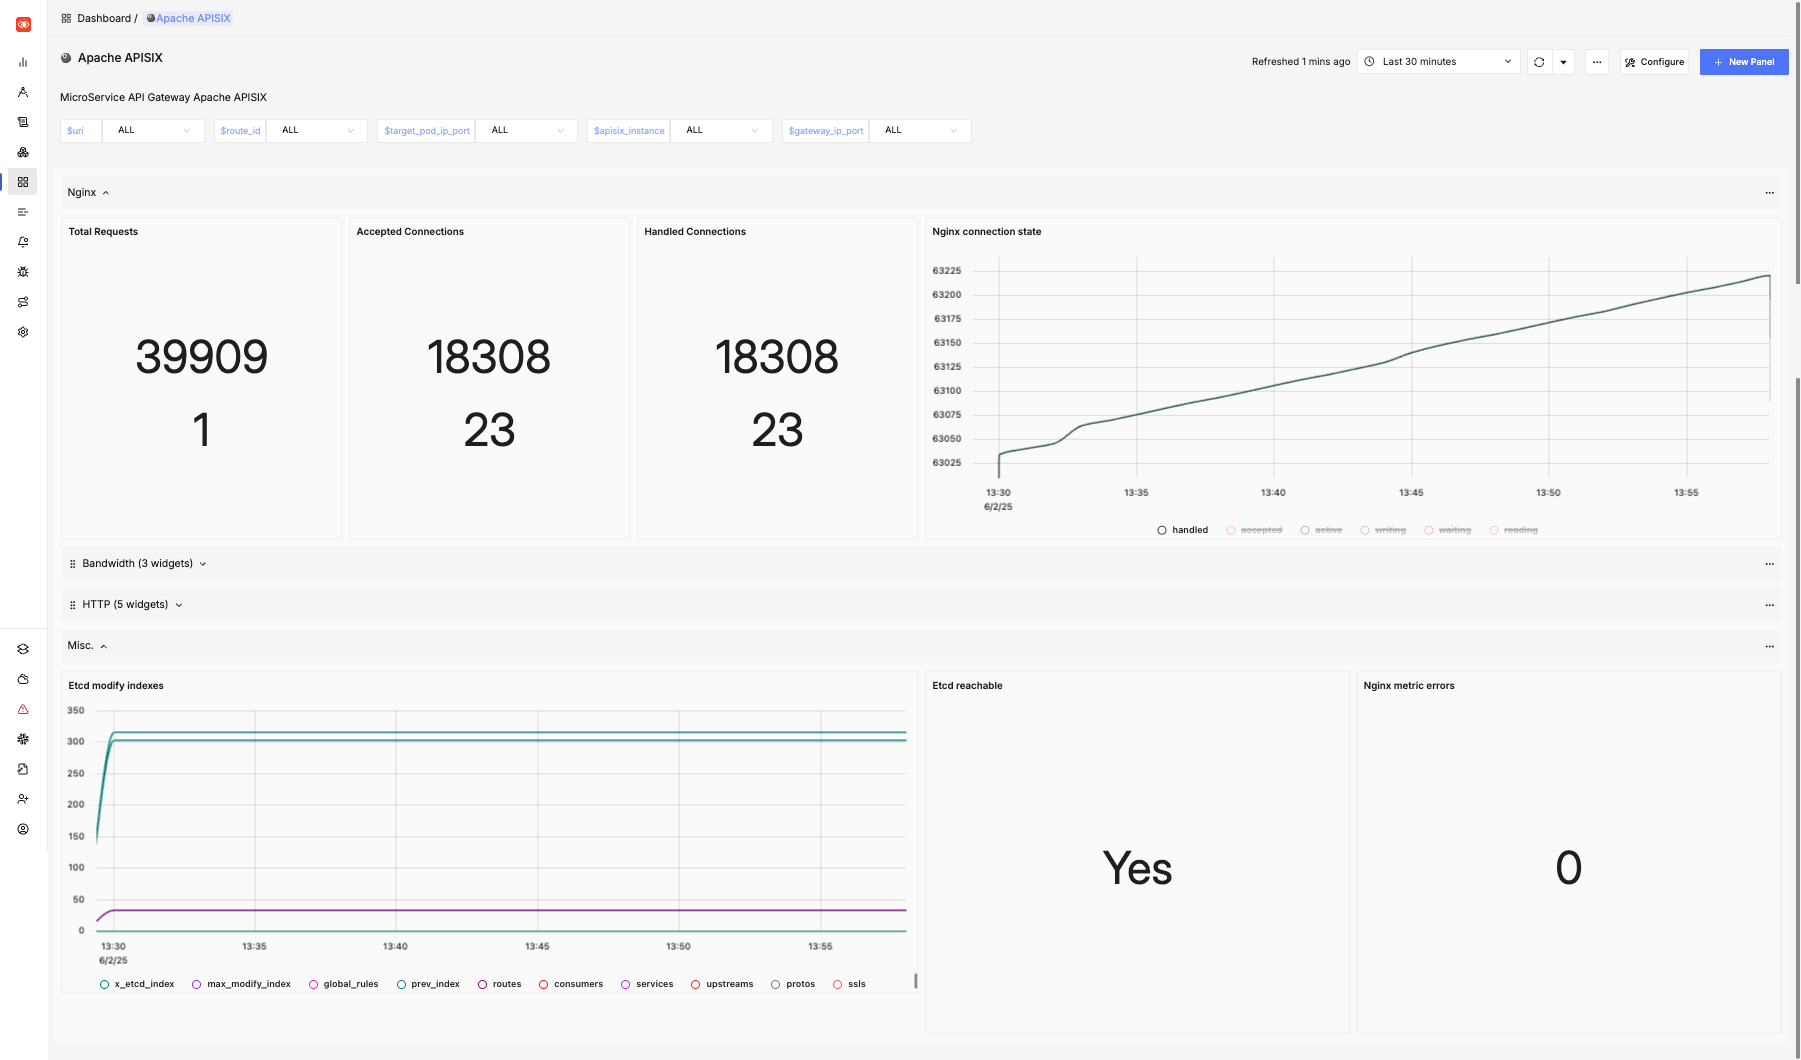
This dashboard provides details of the APISIX API Gateway including:
- Total Requests
- NGINX Connection State
- Etcd modifications
Here is an example of this dashboard:
In order for SigNoz to be able to collect logs, metrics and traces from applications, some configurations are required to be added.
OpenTelemetry zero-code instrumentation enables adding observability to Spring Boot based applications without changing any code. Similarly Micrometer enables instrumentation of JVM based applications and can be configured using Spring Boot starters.
<dependencies>
    <dependency>
        <groupId>io.micrometer</groupId>
        <artifactId>micrometer-core</artifactId>
    </dependency>
    <dependency>
        <groupId>io.micrometer</groupId>
        <artifactId>micrometer-registry-prometheus</artifactId>
    </dependency>
    <dependency>
        <groupId>io.micrometer</groupId>
        <artifactId>micrometer-tracing-bridge-otel</artifactId>
        <exclusions>
            <exclusion>
                <groupId>io.opentelemetry.instrumentation</groupId>
                <artifactId>opentelemetry-instrumentation-api-incubator</artifactId>
            </exclusion>
        </exclusions>
    </dependency>
    <dependency>
        <groupId>io.opentelemetry</groupId>
        <artifactId>opentelemetry-exporter-otlp</artifactId>
    </dependency>
    <dependency>
        <groupId>io.micrometer</groupId>
        <artifactId>micrometer-tracing</artifactId>
    </dependency>
    <dependency>
        <groupId>io.opentelemetry.instrumentation</groupId>
        <artifactId>opentelemetry-spring-boot-starter</artifactId>
    </dependency>
    <dependency>
        <groupId>net.ttddyy.observation</groupId>
        <artifactId>datasource-micrometer-spring-boot</artifactId>
    </dependency>
    <dependency>
        <groupId>com.oracle.database.spring</groupId>
        <artifactId>oracle-spring-boot-starter-ucp</artifactId>
        <type>pom</type>
    </dependency>
    <dependency>
        <groupId>io.opentelemetry.instrumentation</groupId>
        <artifactId>opentelemetry-oracle-ucp-11.2</artifactId>
        <version>2.13.1-alpha</version>
    </dependency>
</dependencies>

<dependencyManagement>
    <dependencies>
        <dependency>
            <groupId>io.opentelemetry.instrumentation</groupId>
            <artifactId>opentelemetry-instrumentation-bom</artifactId>
            <version>2.13.1</version>
            <type>pom</type>
            <scope>import</scope>
        </dependency>
        <dependency>
            <groupId>io.micrometer</groupId>
            <artifactId>micrometer-tracing-bom</artifactId>
            <version>${micrometer-tracing.version}</version>
            <type>pom</type>
            <scope>import</scope>
        </dependency>
    </dependencies>
</dependencyManagement>
datasource-micrometer and Oracle Universal Connection Pool Instrumentation can be configured to enable observability for Database connections and queries.
<dependencies>
    <dependency>
        <groupId>net.ttddyy.observation</groupId>
        <artifactId>datasource-micrometer-spring-boot</artifactId>
    </dependency>
    <dependency>
        <groupId>io.opentelemetry.instrumentation</groupId>
        <artifactId>opentelemetry-oracle-ucp-11.2</artifactId>
        <version>2.13.1-alpha</version>
    </dependency>
</dependencies>
When you deploy an application with Oracle Backend for Microservices and AI CLI or Visual Code Extension, provided you included the Spring Actuator in your application, SigNoz will automatically find your application (using the annotations) and start collecting metrics. These metrics will be included in both the Spring Boot Observability dashboard and the Spring Boot Statistic dashboard automatically.
To include the Actuator in your application, add the following dependencies to your Maven POM or equivalent:
<dependency>
    <groupId>org.springframework.boot</groupId>
    <artifactId>spring-boot-starter-actuator</artifactId>
</dependency>
You must also add the configuration similar to one given below, after customizing it for your application, to your Spring application.yaml
spring:
  threads:
    virtual:
      enabled: true
  jpa:
    hibernate:
      ddl-auto: validate
    properties:
      hibernate:
        dialect: org.hibernate.dialect.OracleDialect
        format_sql: true
    show-sql: true

eureka:
  instance:
    hostname: ${spring.application.name}
    preferIpAddress: true
  client:
    service-url:
      defaultZone: ${eureka.service-url}
    fetch-registry: true
    register-with-eureka: true
    enabled: true

management:
  endpoint:
    health:
      show-details: always
      show-components: always
  endpoints:
    web:
      exposure:
        include: "*"
  metrics:
    tags:
      application: ${spring.application.name}
    distribution:
      percentiles[http.server.requests]: 0.5, 0.90, 0.95, 0.99
      percentiles-histogram[http.server.requests]: true
      slo[http.server.requests]: 100ms, 250ms, 500ms, 1s, 2s, 5s, 10s, 30s
      percentiles[http.client.requests]: 0.5, 0.90, 0.95, 0.99
      percentiles-histogram[http.client.requests]: true
      slo[http.client.requests]: 100ms, 250ms, 500ms, 1s, 2s, 5s, 10s, 30s
  health:
    probes:
      enabled: true
  tracing:
    sampling:
      probability: 1.0
  info:
    os:
      enabled: true
    env:
      enabled: true
    java:
      enabled: true
  observations:
    key-values:
      app: ${spring.application.name}

logging:
  level:
    root: INFO
    com.example: INFO
    org.springframework.web.filter.AbstractRequestLoggingFilter: INFO

jdbc:
  datasource-proxy:
    query:
      enable-logging: true
      log-level: INFO
    include-parameter-values: true
The Oracle Backend for Microservices and AI platform adds following annotations to your application pods for SigNoz to start scraping the actuator endpoint for metrics.
signoz.io/path: /actuator/prometheus
signoz.io/port: "8080"
signoz.io/scrape: "true"
It also adds the OTEL_EXPORTER_OTLP_ENDPOINT to pod environment variables for the OpenTelemetry instrumentation libraries to access the the OpenTelemtry collector of SigNoz.
- name: OTEL_EXPORTER_OTLP_ENDPOINT
  value: http://obaas-signoz-otel-collector.observability:4318