Oracle Fusion Middleware on Kubernetes > Oracle WebCenter Content > Administration Guide > Monitor an Oracle WebCenter Content domain
Monitor an Oracle WebCenter Content domain
You can monitor a WebCenter Content domain using Prometheus and Grafana by exporting the metrics from the domain instance using the WebLogic Monitoring Exporter.
Set up monitoring for OracleWebCenterContent domain
Using the WebLogic Monitoring Exporter you can scrape runtime information from a running Oracle WebCenter Content Suite instance and monitor them using Prometheus and Grafana.
Follow these steps to set up monitoring for an Oracle WebCenter Content Suite instance. For more details on WebLogic Monitoring Exporter, see here.
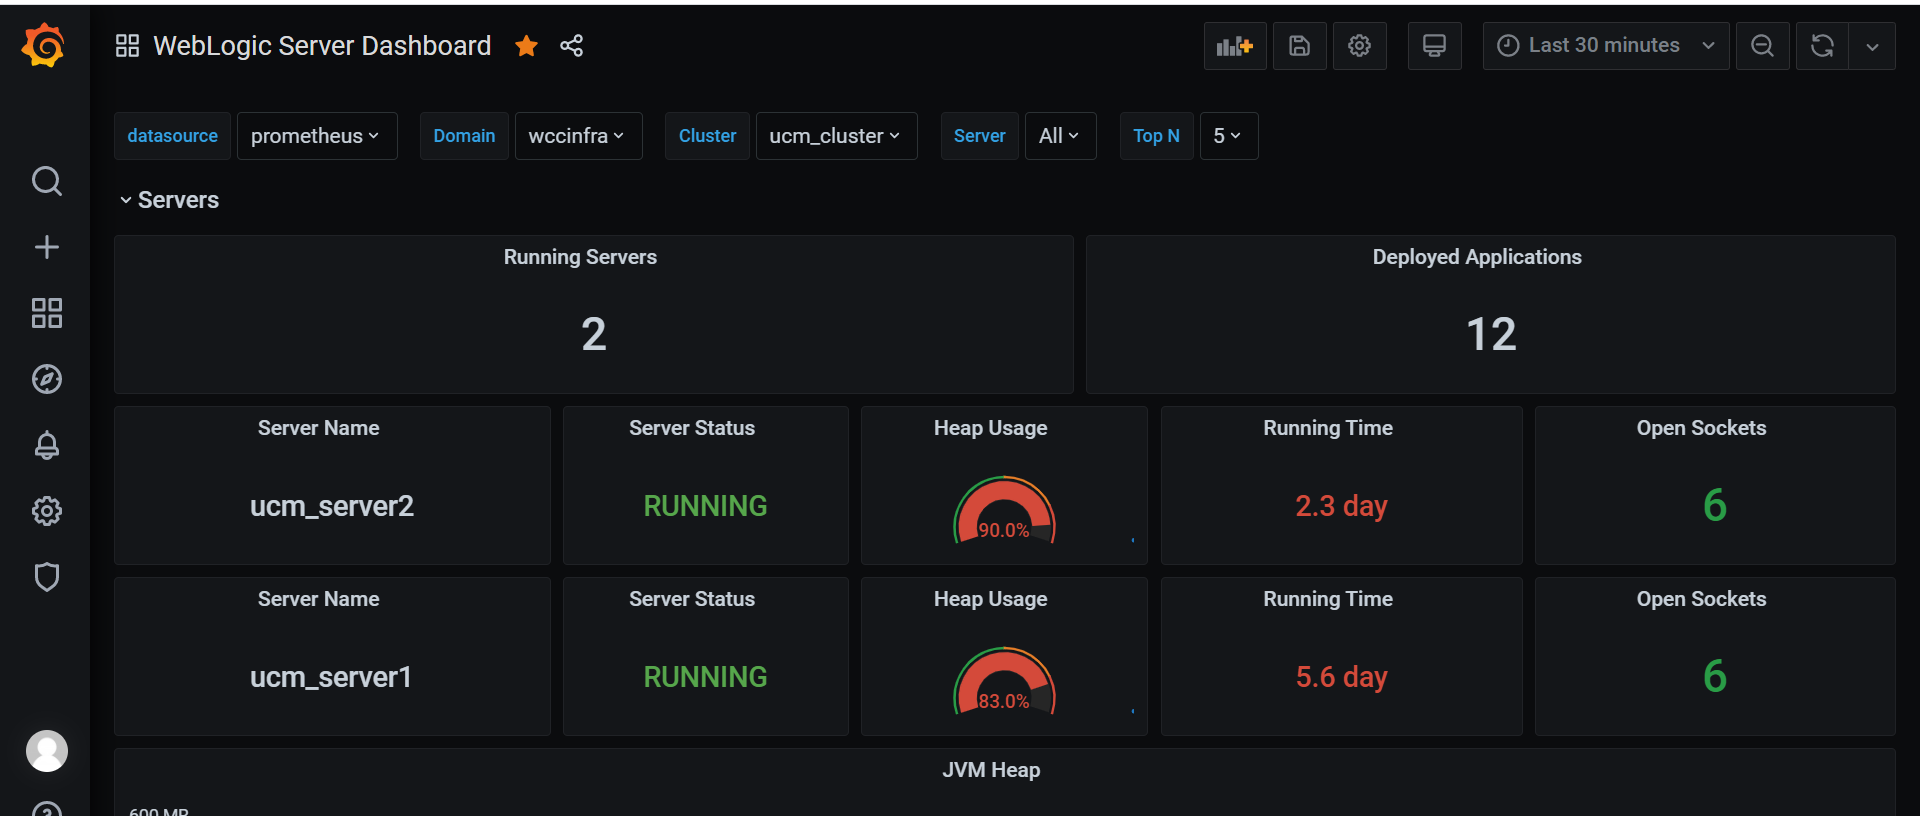
Verify monitoring using Grafana Dashboard
After set-up is complete, to view the domain metrics, you can access the Grafana dashboard at http://mycompany.com:32100/.
This displays the WebLogic Server Dashboard.