Monitoring Transactional Event Queues
Oracle Transactional Event Queues ("TxEventQ") is a fault-tolerant, scalable, real-time messaging backbone offered by converged Oracle AI Database that allows you to build an enterprise-class event-driven architectures.
Access to the real-time broker, producer, and consumer metrics in a single dashboard and receiving alerts for issues allows teams to understand the state of their system.
The exporter includes a set of metrics for monitoring TxEventQ and a pre-built Grafana dashboard.
Note: The metrics are written for Oracle AI Database 21c or later.
How to create some traffic with PL/SQL
If you need to create a topic to monitor, you can use these statements to create and start a topic, and create a subscriber:
declare
    subscriber sys.aq$_agent;
begin
  -- create the topic
  dbms_aqadm.create_transactional_event_queue(
    queue_name => 'my_topic',
    multiple_consumers => true  -- true makes a pub/sub topic
  );

  -- start the topic
  dbms_aqadm.start_queue(
    queue_name => 'my_topic'
  );

  -- create a subscriber
  dbms_aqadm.add_subscriber(
    queue_name => 'my_teq',
    subscriber => sys.aq$_agent(
      'my_subscriber',    -- the subscriber name
      null,               -- address, only used for notifications
      0                   -- protocol
    ),
    rule => 'correlation = ''my_subscriber'''
  );
end;
You can produce a message with these commands:
declare
    enqueue_options    dbms_aq.enqueue_options_t;
    message_properties dbms_aq.message_properties_t;
    message_handle     raw(16);
    message            SYS.AQ$_JMS_TEXT_MESSAGE;
begin
    -- create the message payload
    message := SYS.AQ$_JMS_TEXT_MESSAGE.construct;
    message.set_text('{"orderid": 12345, "username": "Jessica Smith"}');

    -- set the consumer name
    message_properties.correlation := 'my_subscriber';

    -- enqueue the message
    dbms_aq.enqueue(
        queue_name           => 'my_topic',
        enqueue_options      => enqueue_options,
        message_properties   => message_properties,
        payload              => message,
        msgid                => message_handle);

    -- commit the transaction
    commit;
end;
How to create some traffic with Java (Spring Boot)
A simple load generator is provided in this directory which you can use to create some traffic so you can experiment with the sample dashboard.
To run the sample, first update application.yaml with the correct IP address for your database, then start the application as follows:
mvn spring-boot:run
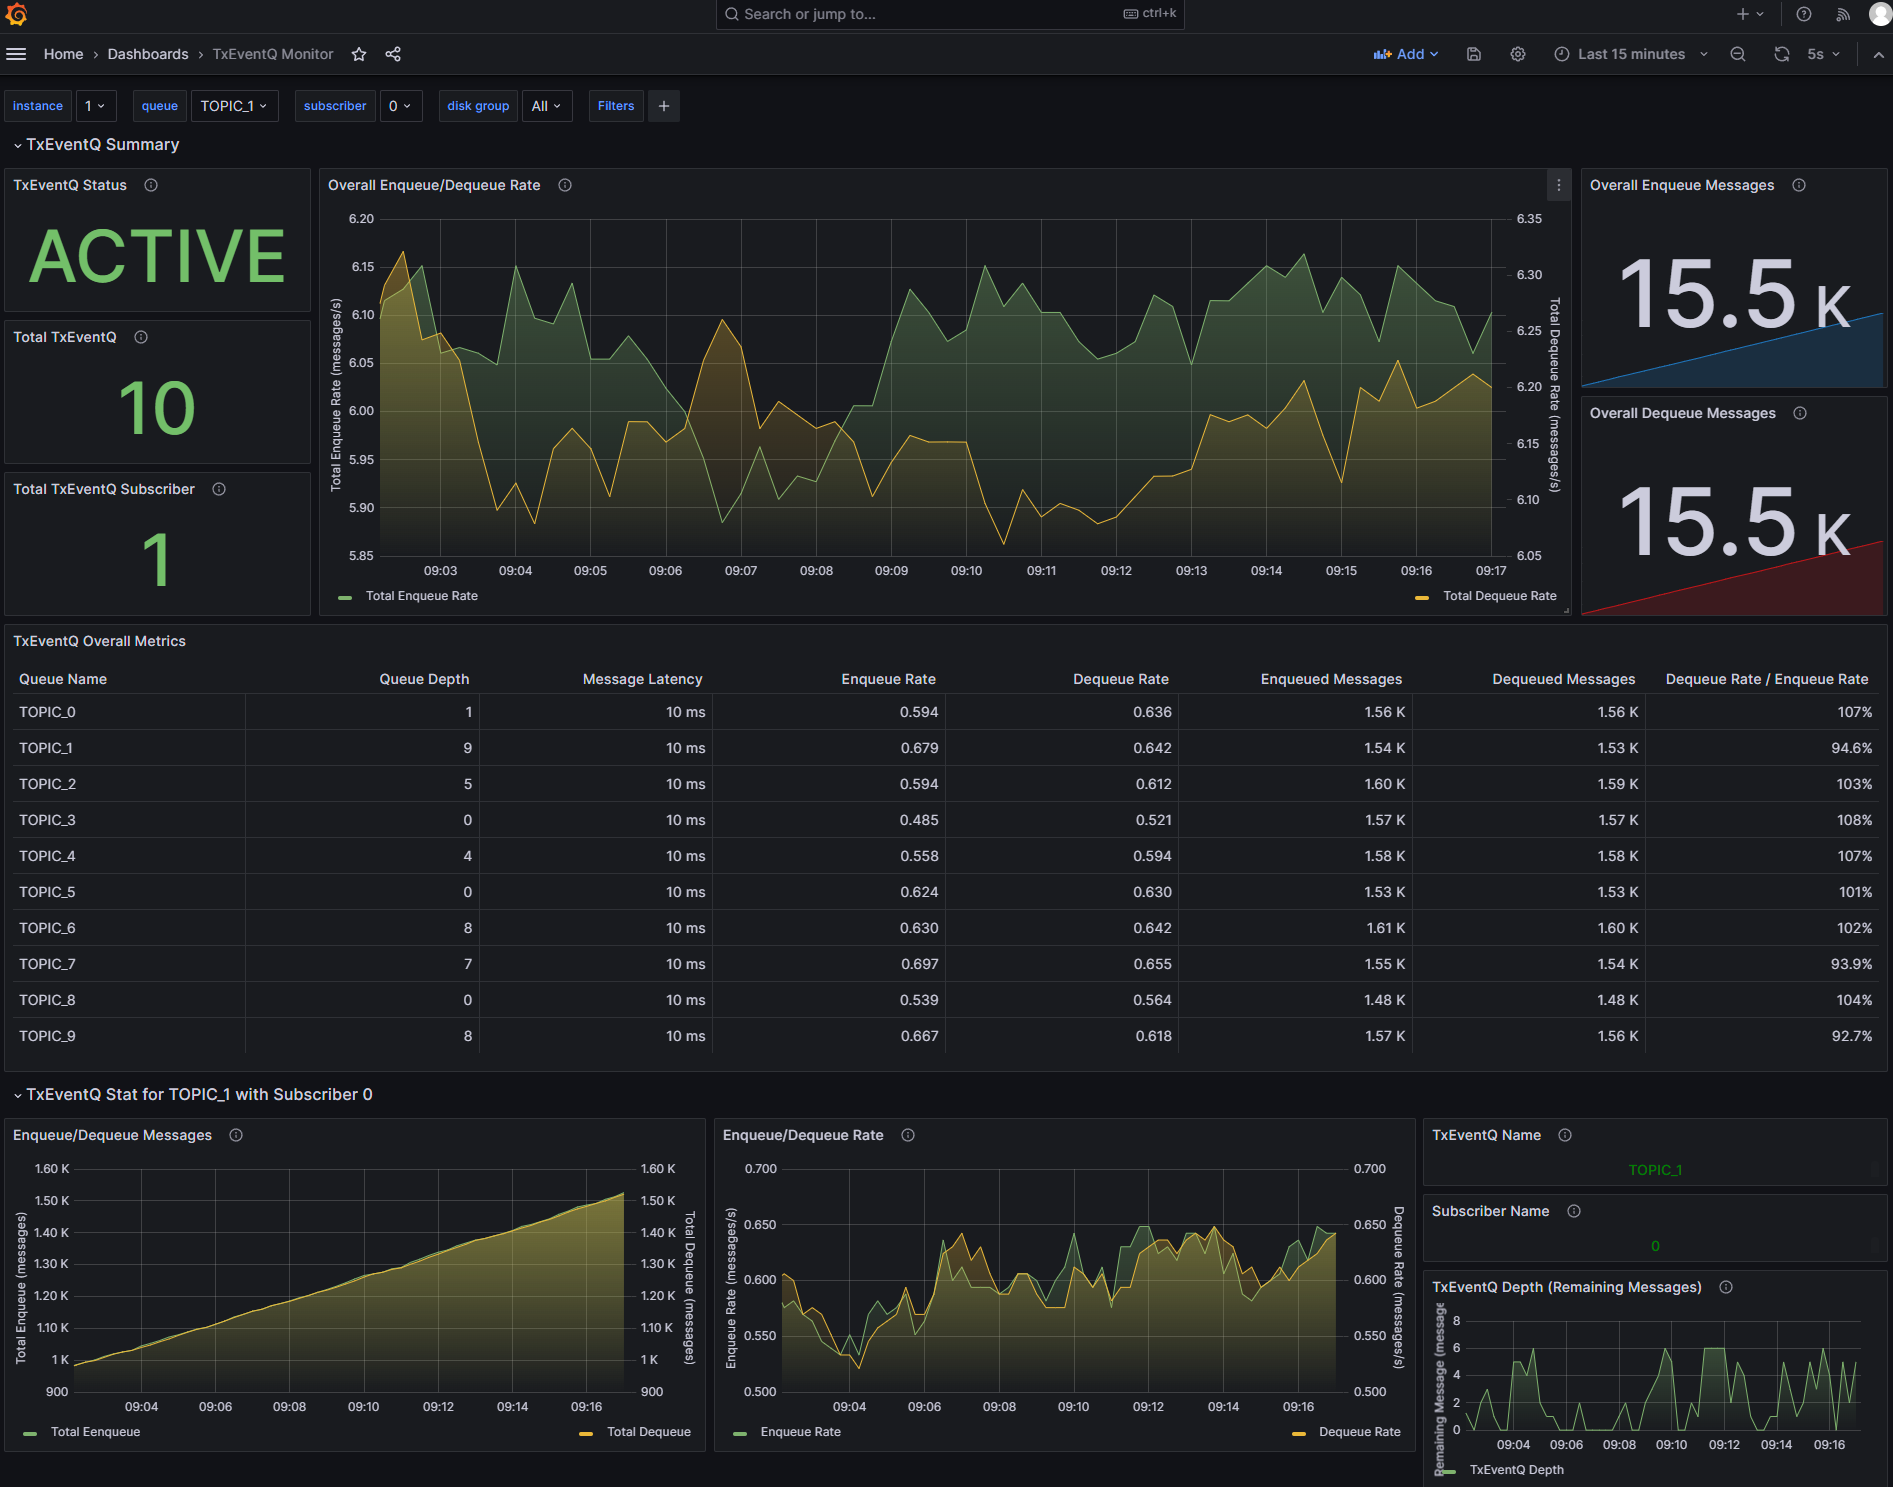
The application will create ten queues names TOPIC_0 through TOPIC_9 and randomly produce and consume messages on those queues. The example dashboard shown below was monitoring traffic produced using this application.
Metrics definitions
The metrics definitions are provided in this file. You need to provide this file to the exporter, e.g., by adding it to your container image, or creating a Kubernetes config map containing the file and mounting that config map as a volume in your deployment. You also need to set the CUSTOM_METRICS environment variable to the location of this file.
Additional database permissions
The database user that the exporter uses to connect to the database will also need additional permissions, which can be granted with these statements. This example assumes the exporter connects with the username "exporter":
grant execute on dbms_aq to exporter;
grant execute on dbms_aqadm to exporter;
grant execute on dbms_aqin to exporter;
grant execute on dbms_aqjms_internal to exporter;
grant execute on dbms_teqk to exporter;
grant execute on DBMS_RESOURCE_MANAGER to exporter;
grant select_catalog_role to exporter;
grant select on sys.aq$_queue_shards to exporter;
grant select on user_queue_partition_assignment_table to exporter;
Grafana dashboard
A Grafana dashboard for Transactional Event Queues is provided in this file. This can be imported into your Grafana environment. Choose the Prometheus datasource that is collecting metrics from the exporter.
Note: You may not see any activity on the dashboard unless there are clients producing and consuming messages from topics.
The dashboard will look like this:
