Database Monitoring Exporter
The Oracle Database Metrics Exporter is a standalone application that provides observability into Oracle Database instances and is designed to run on-premises or in the cloud. This section covers configuring the database exporter for Oracle Database Transactional Event Queues.
To get started with the database exporter, see the installation section.
Exporting TxEventQ Metrics
The database exporter supports custom metric definitions in the form of TOML files. The TxEventQ custom metrics file contains metrics definitions for queue information like total number of queues, enqueued messages, dequeued messages, and more. You can include the TxEventQ metrics in the database exporter by using the custom.metrics program argument and passing the file location:
--custom.metrics=txeventq-metrics.tomlOr, set the CUSTOM_METRICS environment variable to point to custom metric files:
CUSTOM_METRICS=txeventq-metrics.tomlTo add more TxEventQ metrics, you can create a custom metrics file based on the views described in the TxEventQ Administrative Views section and then provide that file to the database exporter.
Sample Grafana Dashboard
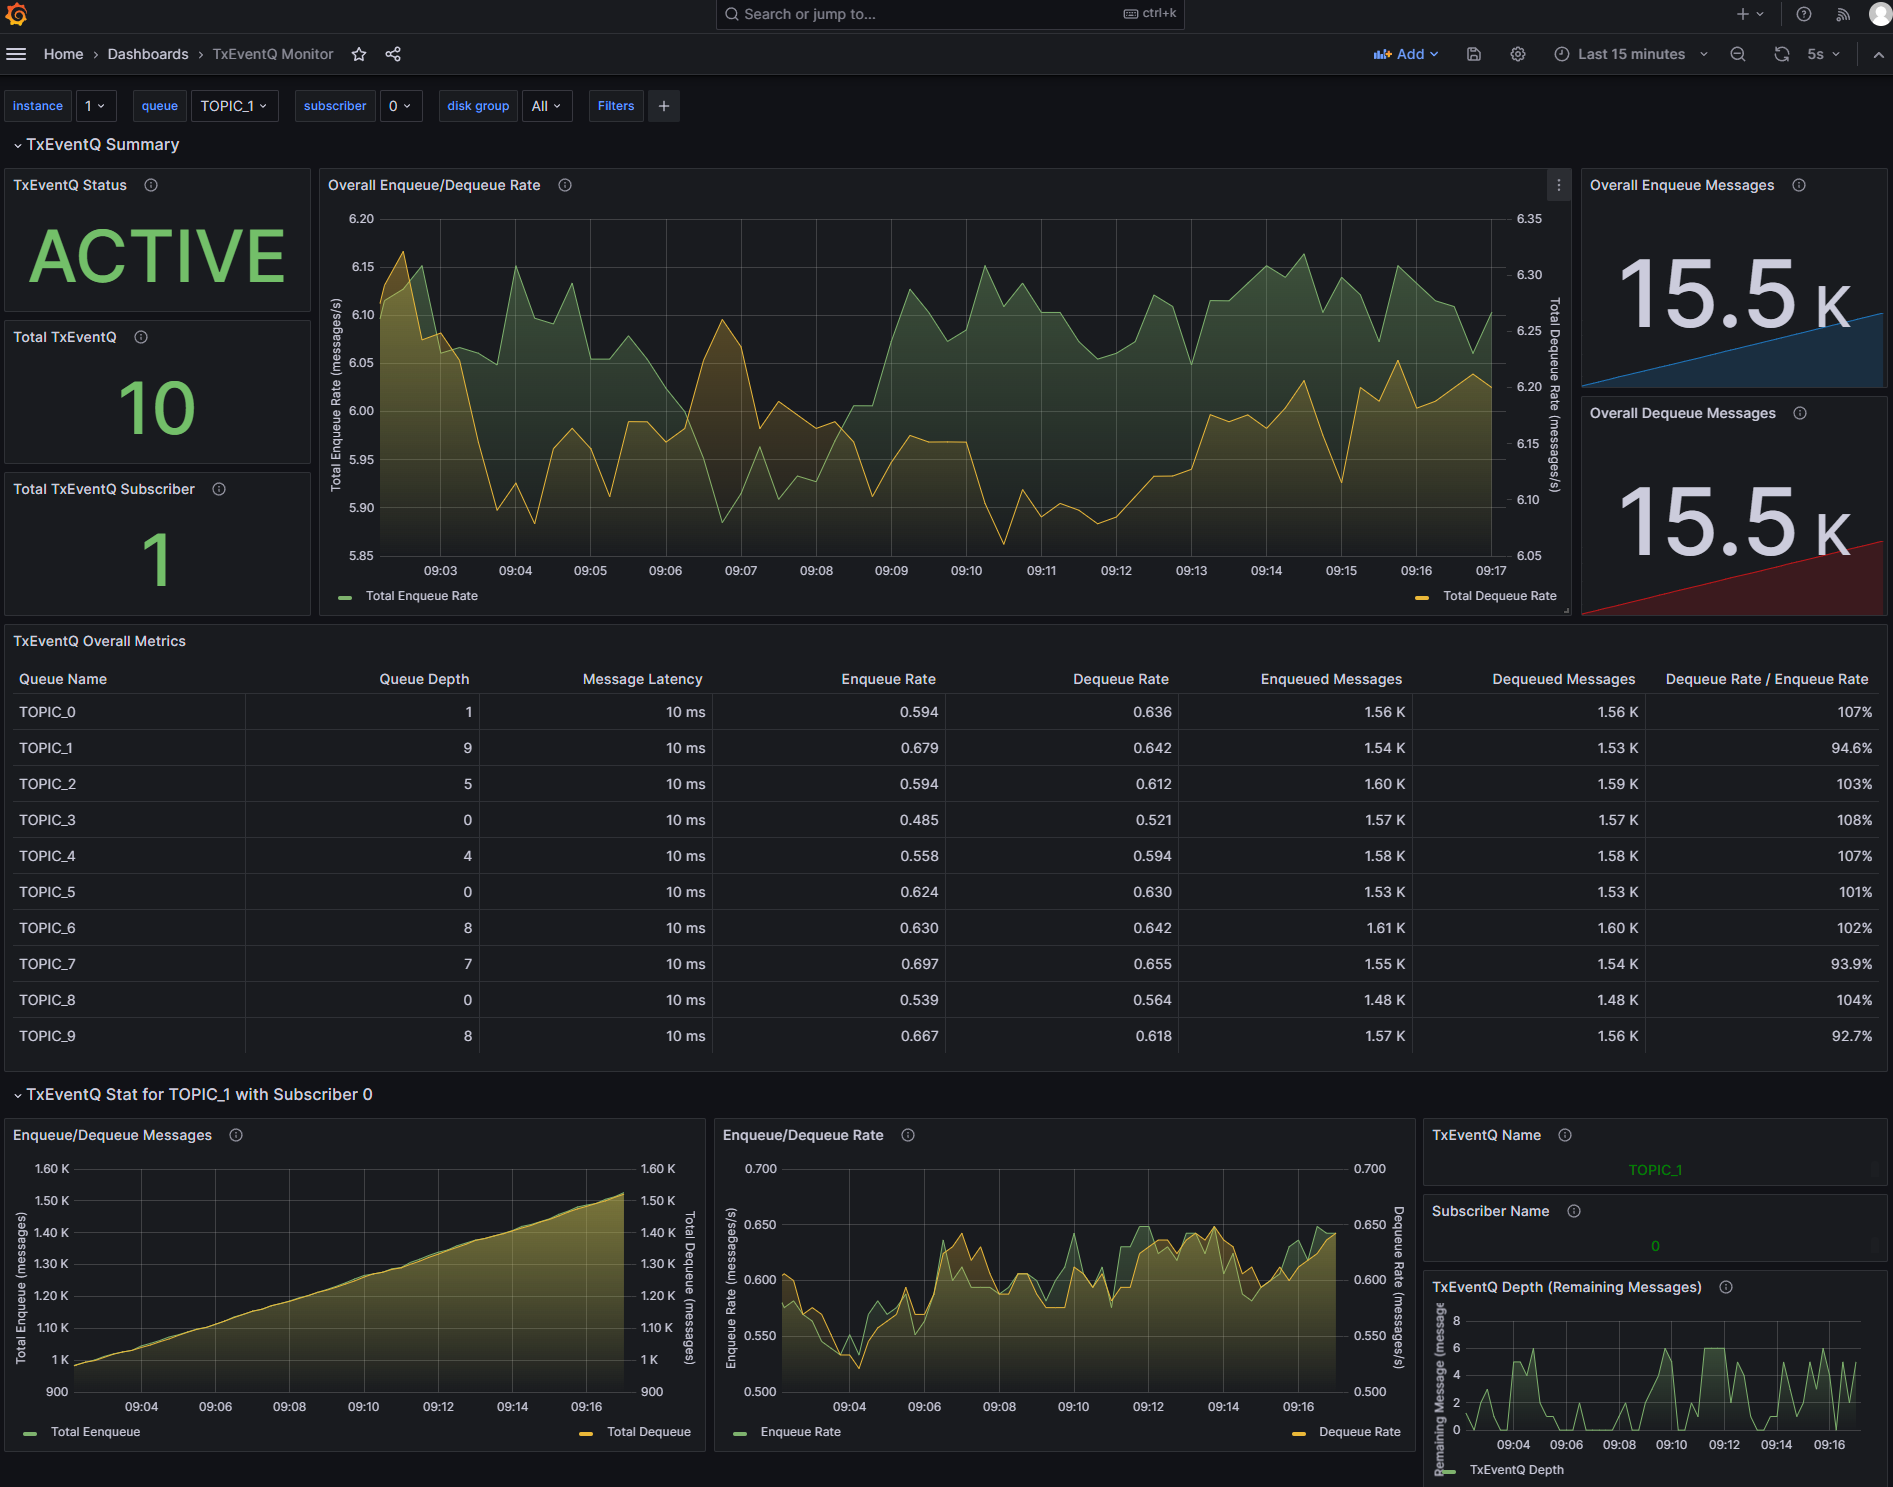
The Sample Dashboard for TxEventQ visualizes metrics related to database queuing, and requires the custom metrics definitions located in the TxEventQ custom metrics file to be loaded into the database exporter.
The dashboard can be loaded into a Grafana instance to visualize TxEventQ status, throughput, and subscriber information for a given queue.
