Explore SigNoz
SigNoz provides an easy way to access the logs, traces and metrics collected in the backend and to view them in dashboards. It can be used to monitor performance, as well as to identify and analyze problems and to create alerts.
-
Explore the pre-installed Spring Boot Dashboard
Get the admin email and password for SigNoz using this command:
$ kubectl -n observability get secret signoz-authn -o jsonpath='{.data.email}' | base64 -d
$ kubectl -n observability get secret signoz-authn -o jsonpath='{.data.password}' | base64 -d
Start the tunnel using this command. You can run this in the background if you prefer.
$ kubectl -n observability port-forward svc/obaas-signoz-frontend 3301:3301Open a web browser to http://localhost:3301/login to view the SigNoz web user interface. It will appear similar to the image below. Log in with the admin email and the password you just got.
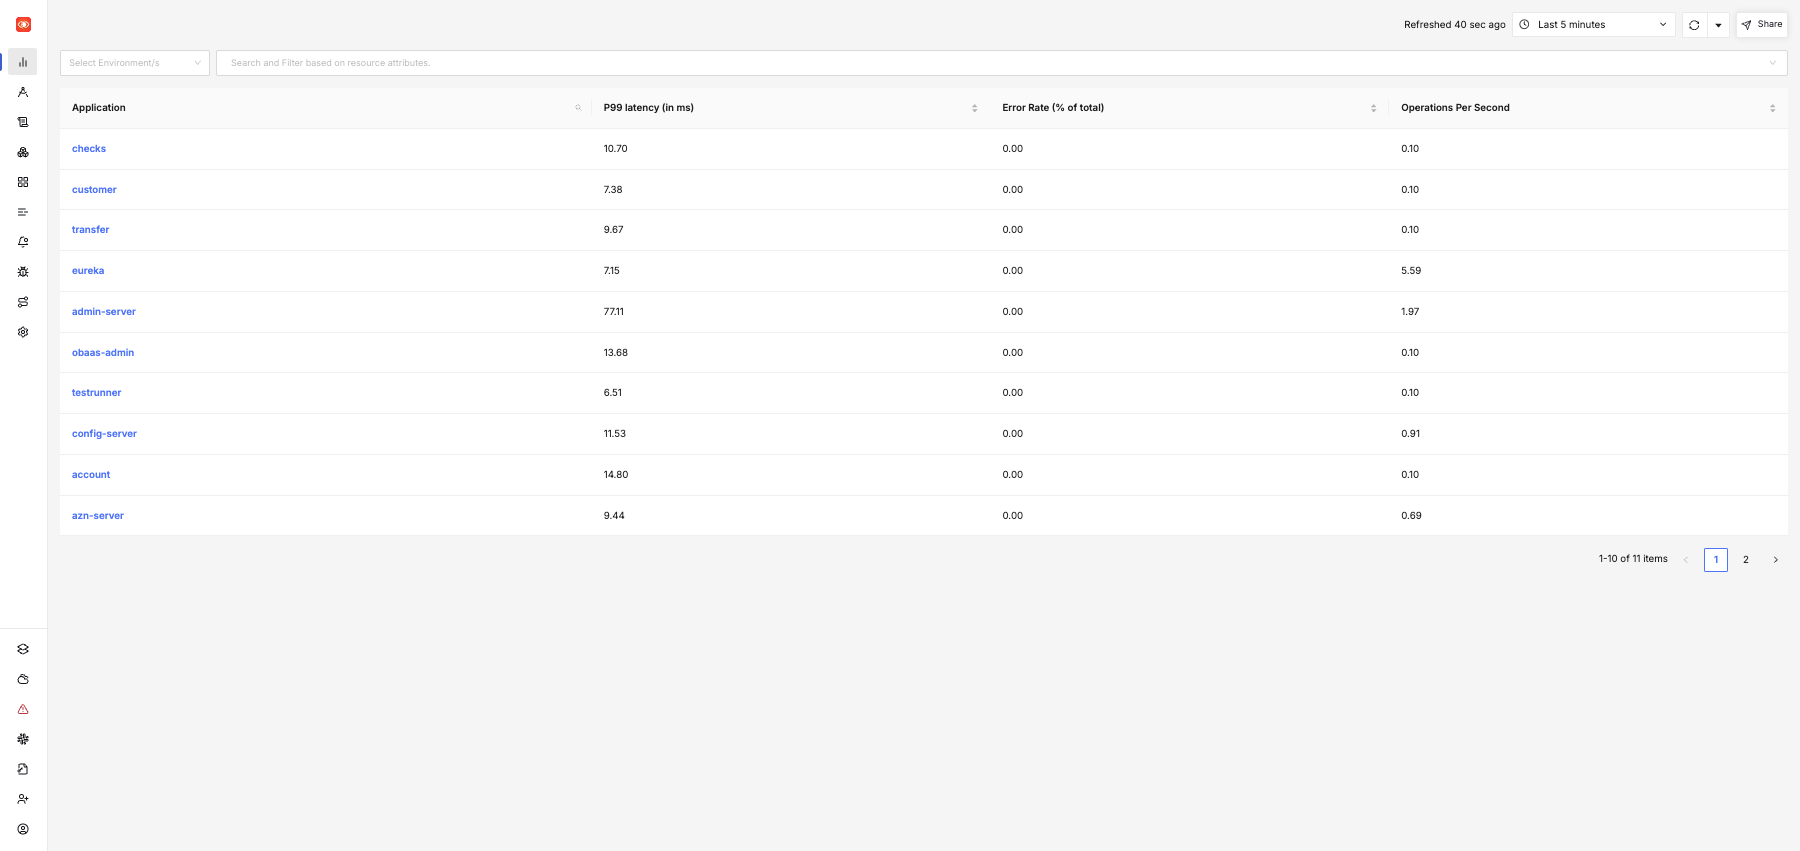
After signing in you will get to the SigNoz homepage.
 ma
maOn the left, click on Dashboards to set the list of pre-installed dashboards.
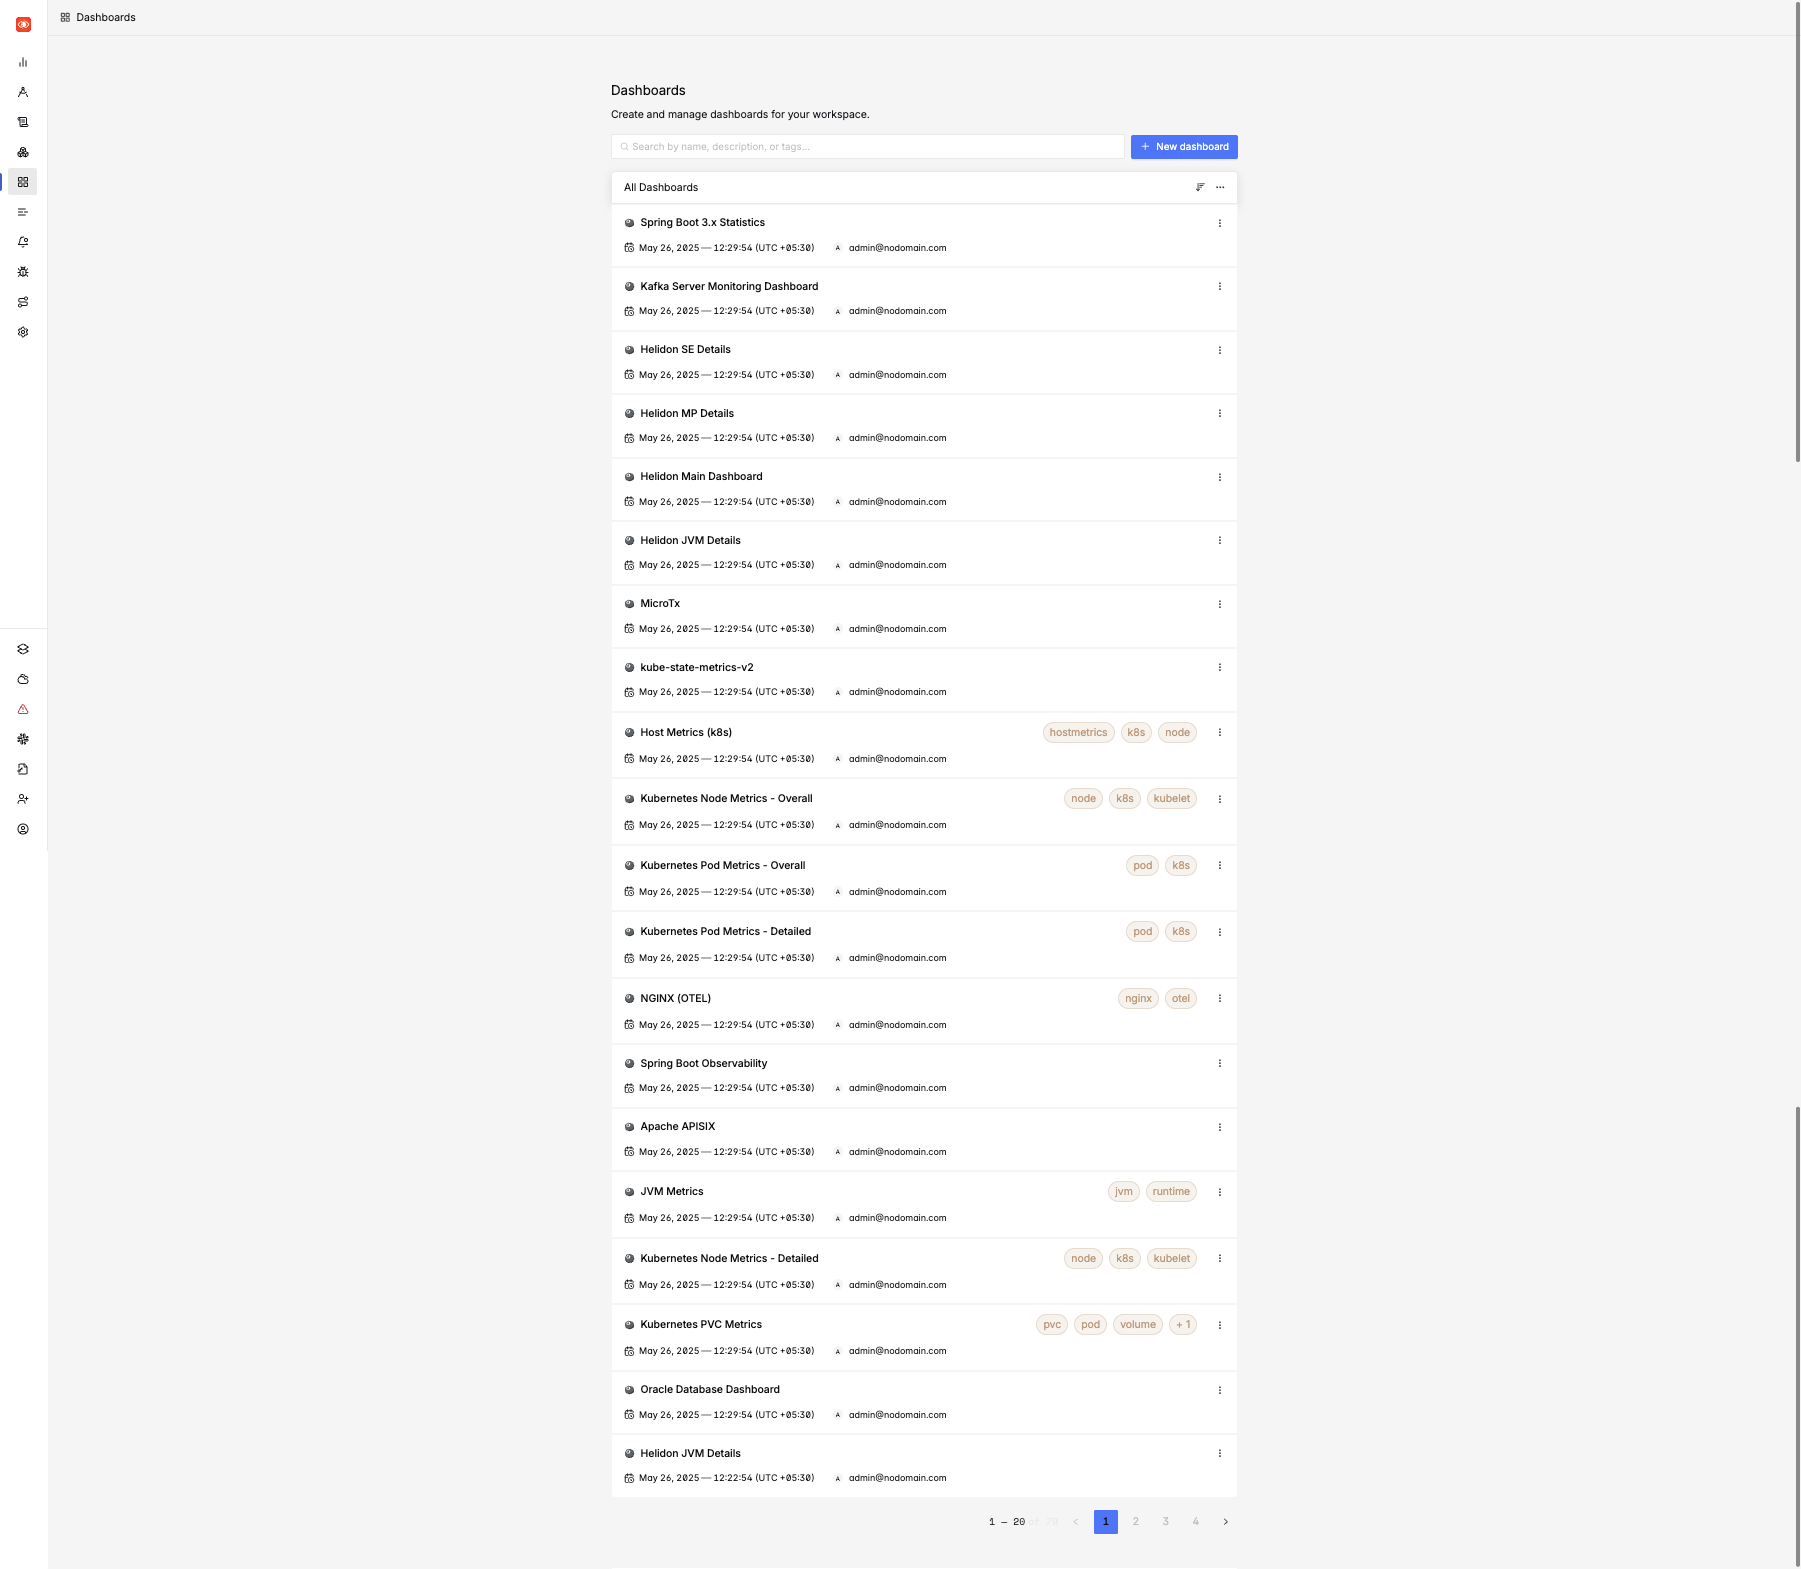
click on the link to Spring Boot 3.x Statistics to see Spring Boot information.
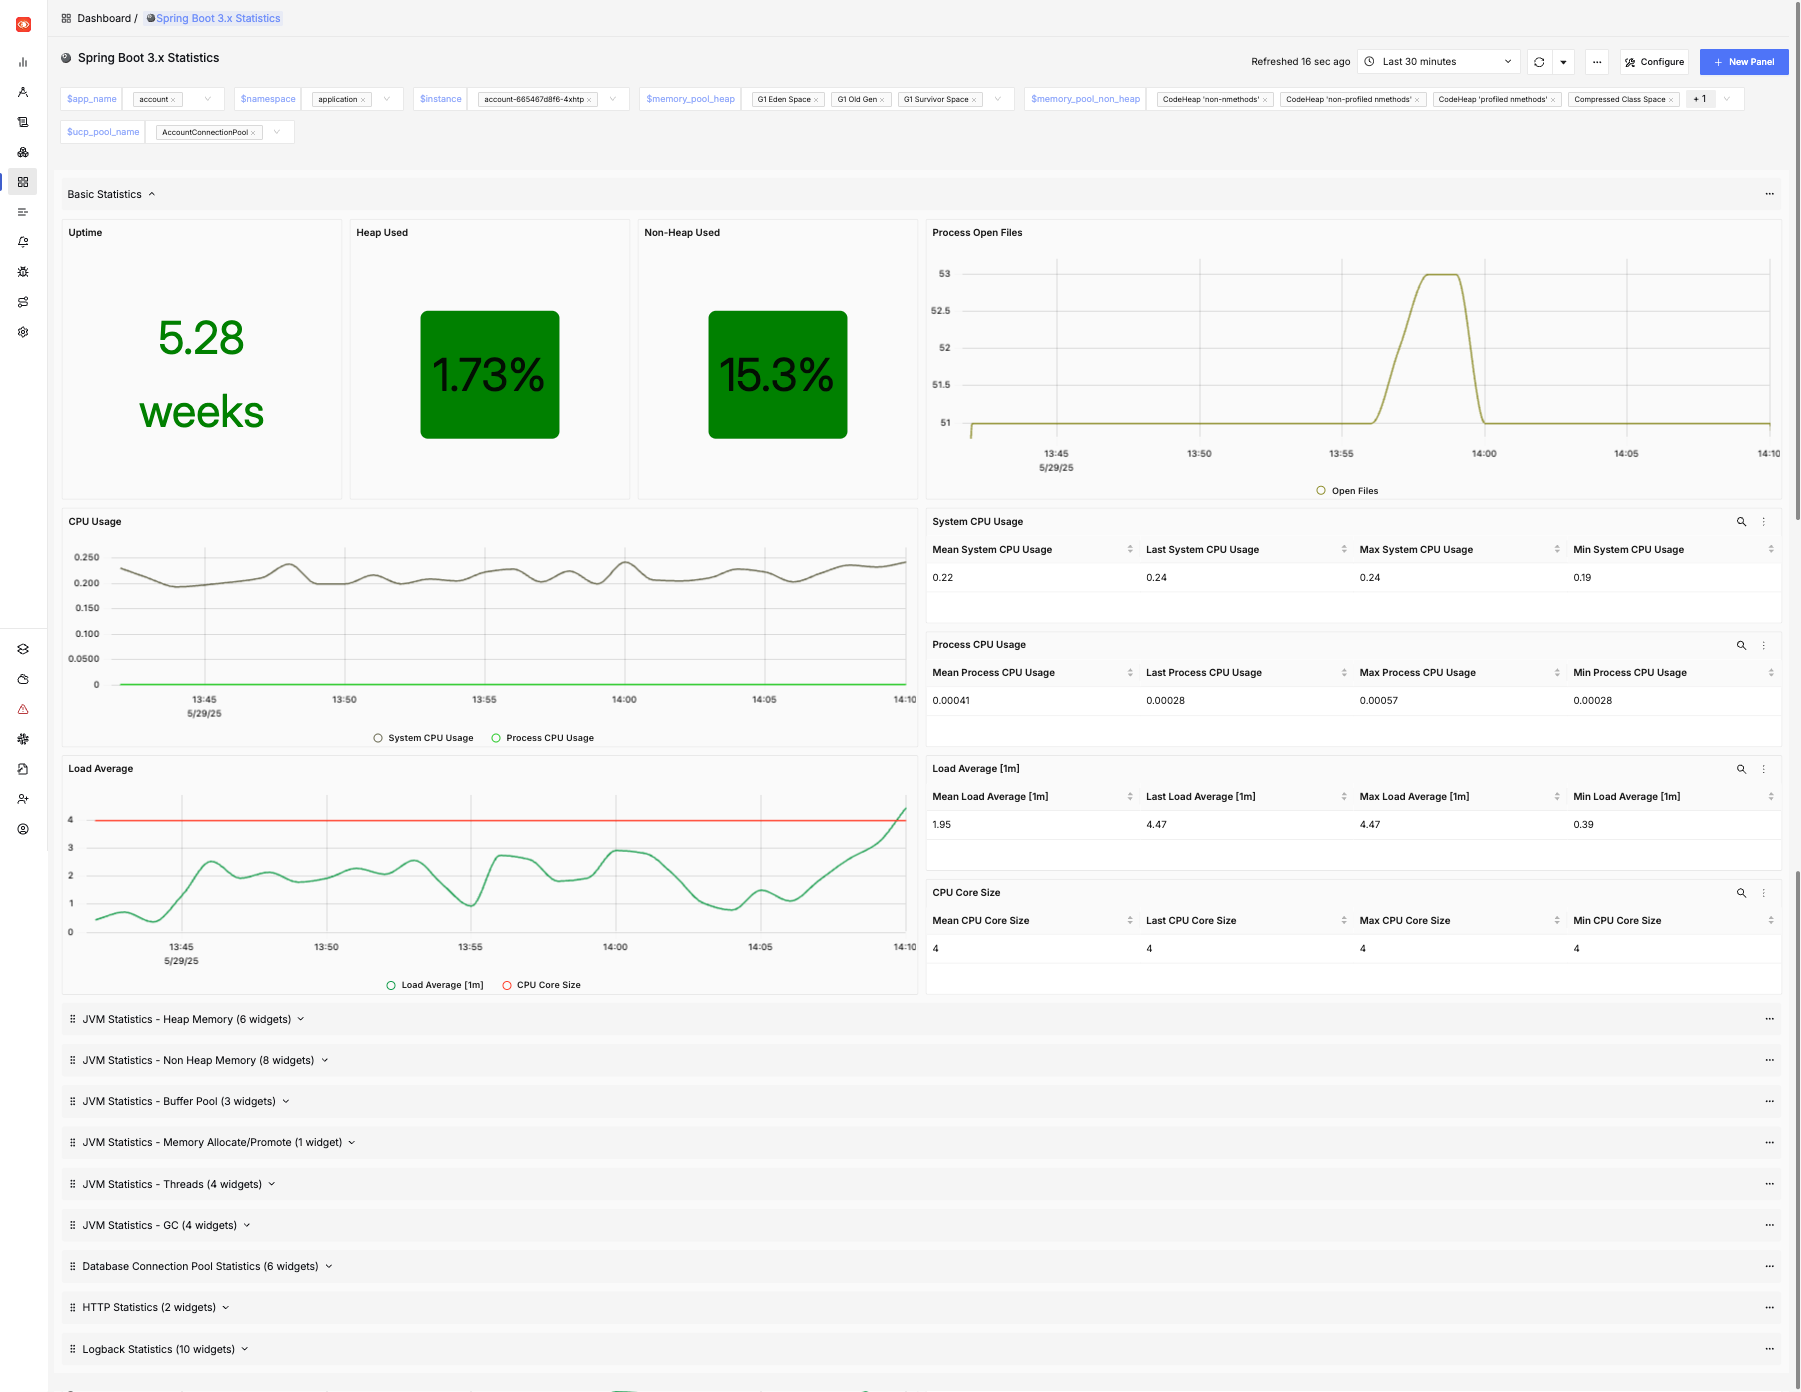
The Spring Boot Dashboard looks like the image below. Use the app_name selector at the top to choose which microservice you wish to view information for.
Feel free to explore the other dashboards that are preinstalled.