Universal Connection Pool
The UCP starter provides an Oracle AI Database DataSource backed by Universal Connection Pool.
Dependency Coordinates
<dependency>
  <groupId>com.oracle.database.spring</groupId>
  <artifactId>oracle-spring-boot-starter-ucp</artifactId>
</dependency>
Configuring the Data Source
Configure spring.datasource in application.yaml and add Spring Data JDBC or Spring Data JPA as needed:
spring:
  datasource:
    url: jdbc:oracle:thin:@//myhost:1521/pdb1
    username: ${USERNAME}
    password: ${PASSWORD}
    driver-class-name: oracle.jdbc.OracleDriver
    type: oracle.ucp.jdbc.PoolDataSourceImpl
    oracleucp: # Any UCP specific connection parameters defined here
      connection-factory-class-name: oracle.jdbc.pool.OracleDataSource
      connection-pool-name: AccountConnectionPool
      initial-pool-size: 15
      min-pool-size: 10
      max-pool-size: 30
The oracleucp block is optional and can be used to fine-tune the pool configuration with Oracle UCP specific properties.
Micrometer Metrics
Spring Boot publishes generic jdbc.connections.* metrics for UCP when Actuator is enabled. To export UCP-specific runtime statistics as well, add the Spring Boot Actuator and UCP Micrometer dependencies to your project:
<dependency>
    <groupId>com.oracle.database.spring</groupId>
    <artifactId>oracle-spring-boot-ucp-micrometer</artifactId>
</dependency>
<dependency>
    <groupId>org.springframework.boot</groupId>
    <artifactId>spring-boot-starter-actuator</artifactId>
</dependency>
The module automatically binds every UCP PoolDataSource to the available Micrometer registry. Portable pool-state meters are aligned with OpenTelemetry database client metric conventions:
| Meter | UCP value | Attributes |
|---|---|---|
db.client.connection.count | Available connections | db.client.connection.pool.name, db.client.connection.state=idle |
db.client.connection.count | Borrowed connections | db.client.connection.pool.name, db.client.connection.state=used |
db.client.connection.max | Maximum pool size | db.client.connection.pool.name |
db.client.connection.idle.min | Minimum idle connections, when supported by UCP | db.client.connection.pool.name |
db.client.connection.pending_requests | Pending connection requests | db.client.connection.pool.name |
The pool-name attribute uses a nonblank UCP connection-pool name when configured. Otherwise, it uses the Spring DataSource bean name, which keeps auto-configured pools unique within the application. The count, maximum, and minimum meters use the Micrometer connections base unit; pending requests use requests.
Additional Oracle UCP statistics are provided under the ucp.connections namespace:
| Meter or group | Meaning |
|---|---|
ucp.connections, .min, .capacity, .peak | Total connections, minimum pool size, remaining capacity, and peak connections |
ucp.connections.active.average, .active.peak | Average and peak borrowed connections |
ucp.connections.labeled, .abandoned | Labeled connections and abandoned connections reclaimed |
ucp.connections.created, .closed | Current-pool creation and closure values, which may reset when the pool restarts |
ucp.connections.borrowed, .returned, .creation.attempts | Cumulative function counters |
ucp.connections.acquire.average, .acquire.peak | Connection-acquire time gauges |
ucp.connections.acquire, .acquire.failed, .acquire.total, .usage | Function timers backed by cumulative counts and total times |
Shard-specific statistics are not exported because shard names can produce unbounded metric-tag cardinality.
UCP JPA Sample and Grafana Dashboard
The UCP JPA sample combines the UCP starter, Spring Data JPA, Actuator, and the UCP Micrometer integration. Its Docker Compose environment starts Oracle AI Database Free and Grafana LGTM, exports metrics over OTLP, and provisions the Oracle UCP Metrics Grafana dashboard.
After starting the sample, open Grafana at http://localhost:3000 and select Dashboards > Oracle AI Database > Oracle UCP Metrics. The dashboard includes pool state and capacity, utilization and pending requests, borrow and return throughput, acquisition outcomes and latency, connection inventory, and lifecycle signals.
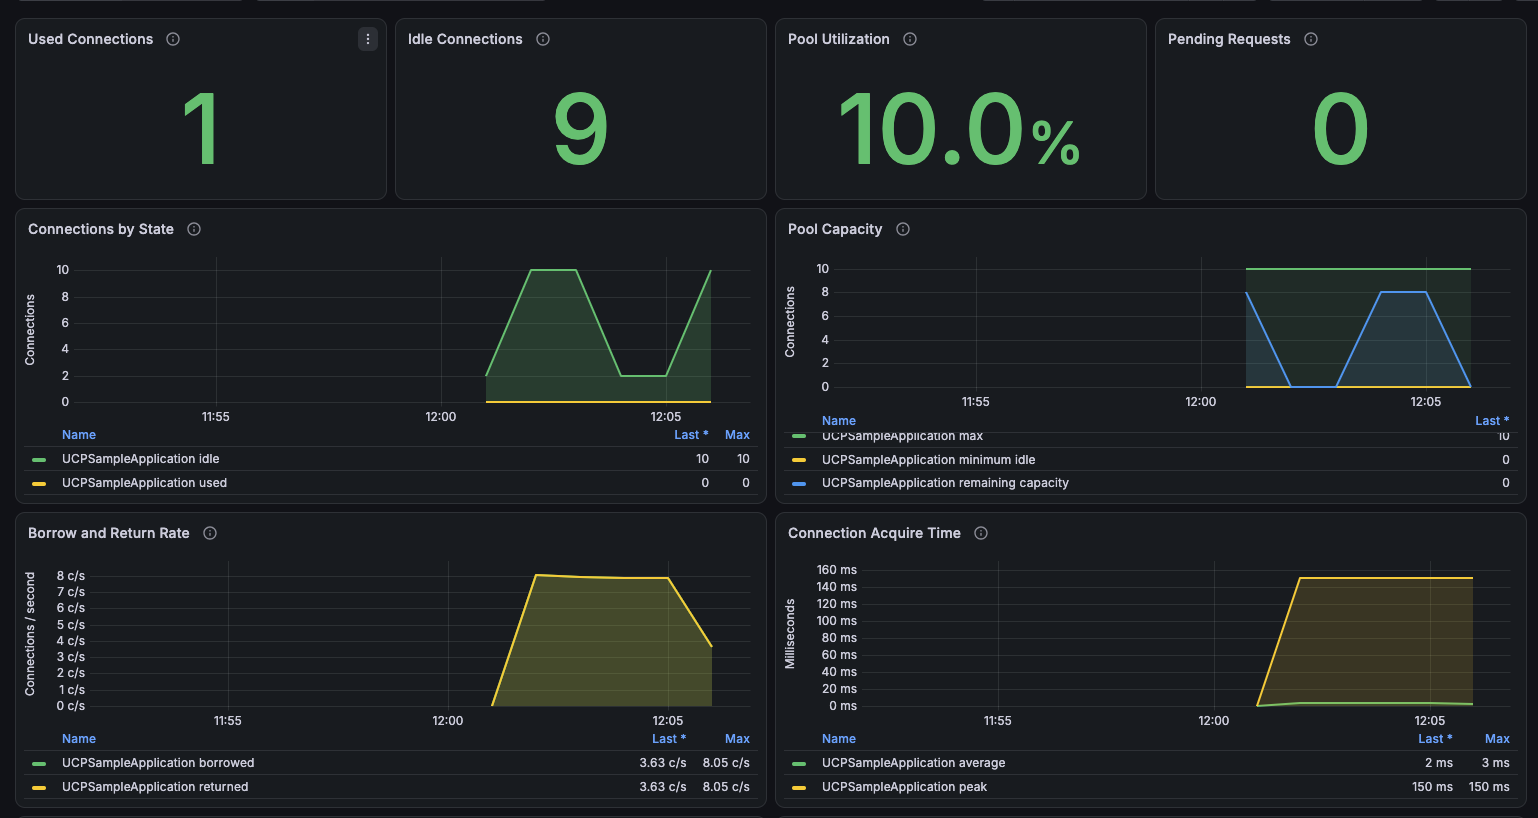
UCP Metric Example
The sample exposes Actuator metrics on port 9002. Query the portable connection-count meter to see the idle and used connection states for the configured pool:
curl http://localhost:9002/actuator/metrics/db.client.connection.count
The response includes measurements and the tags used to select a specific pool state. For the sample's UCPSampleApplication pool, query an idle measurement with:
curl 'http://localhost:9002/actuator/metrics/db.client.connection.count?tag=db.client.connection.pool.name:UCPSampleApplication&tag=db.client.connection.state:idle'
This metric reports the current number of available connections. Change the db.client.connection.state tag to used to inspect borrowed connections. The sample's UCP metrics test shows the same meter and its tags in use.