Grafana Dashboards
Sample Grafana dashboards are included with the exporter.
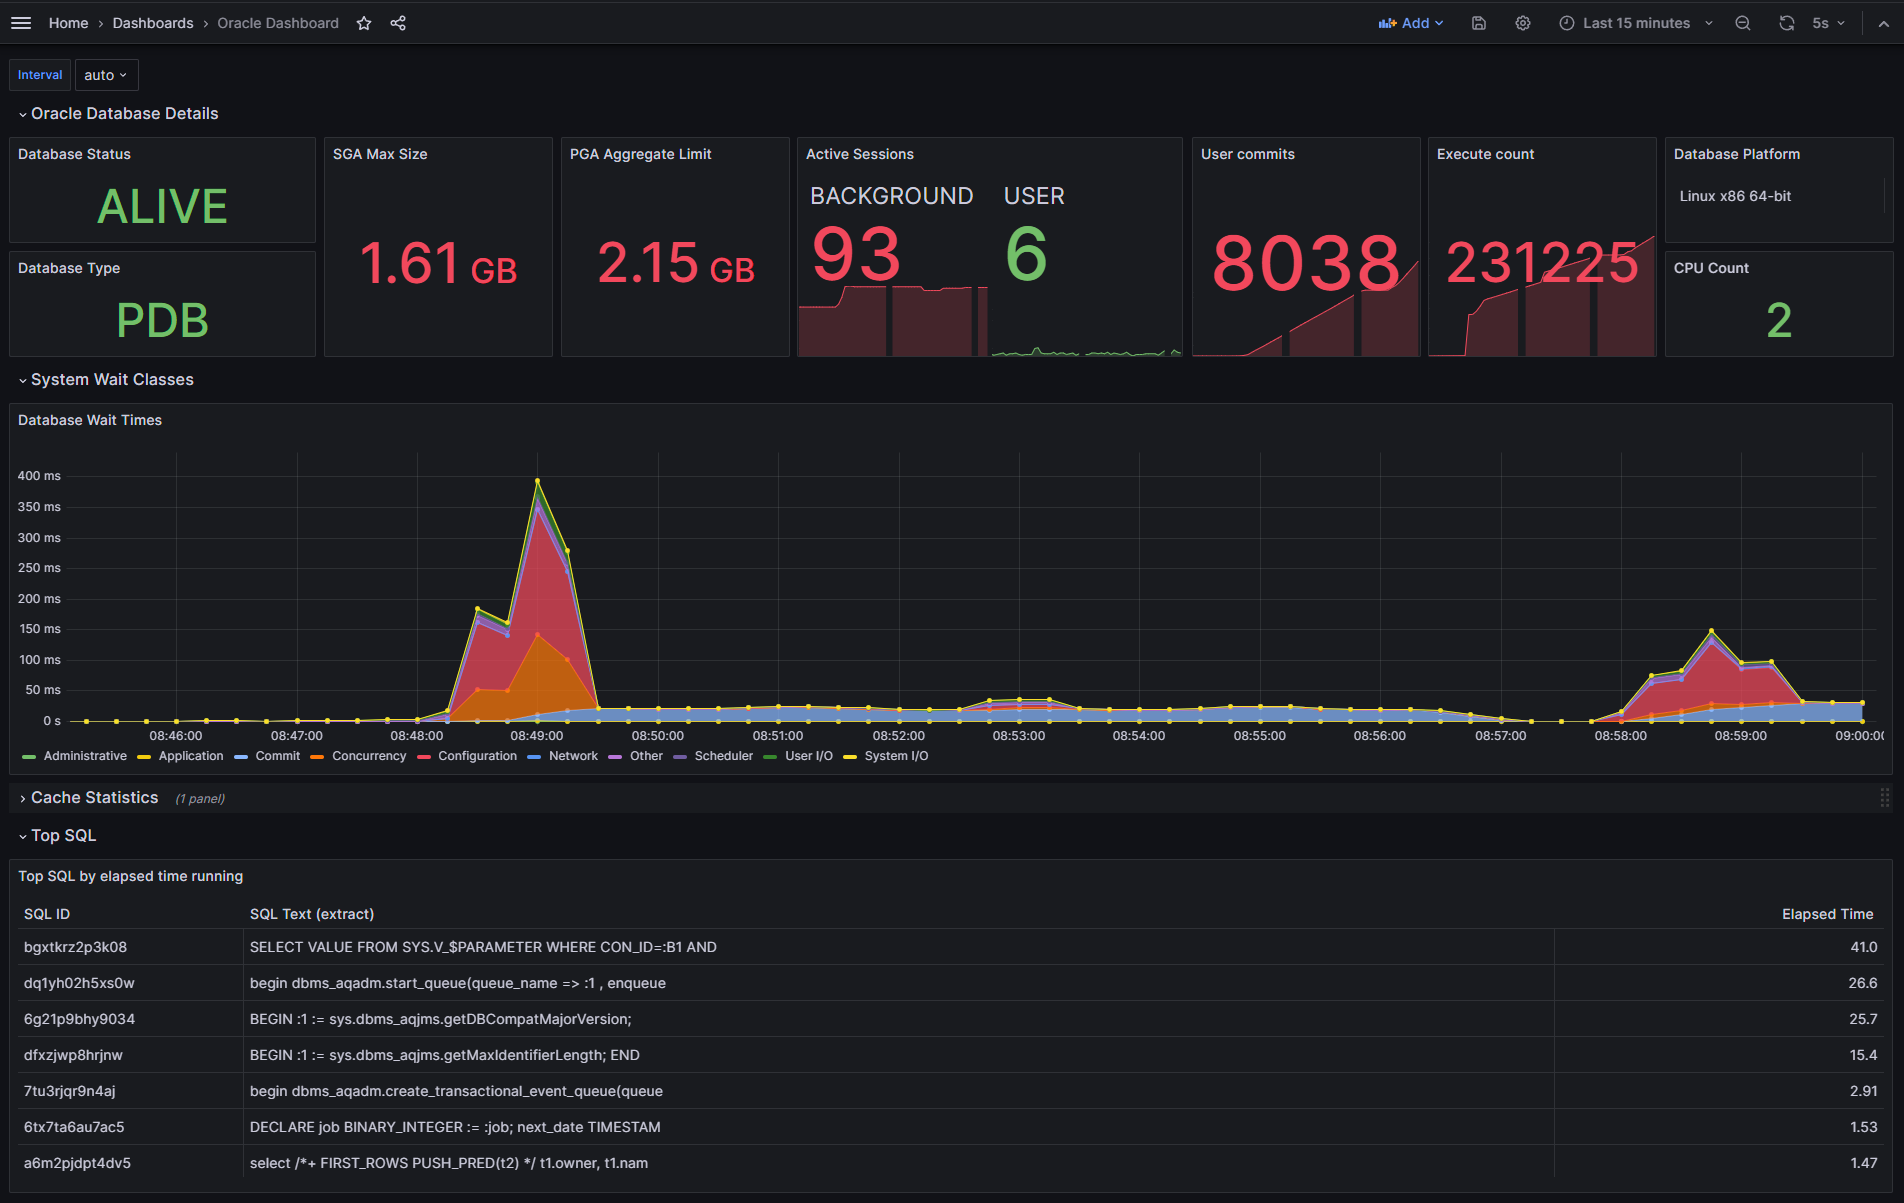
A sample Grafana dashboard definition is provided in this directory. You can import these dashboards into your Grafana instance, and set it to use the Prometheus datasource that you have defined for the Prometheus instance that is collecting metrics from the exporter.
The dashboard shows some basic information, as shown below:
Collect metrics with Grafana Alloy
Grafana Alloy includes the prometheus.exporter.oracledb component. Use it when you want Alloy to run the exporter and forward the scraped Oracle AI Database metrics to a Prometheus-compatible remote-write endpoint.
prometheus.exporter.oracledb "oracle" {
  database {
    name              = "primary"
    connection_string = "db.example.com:1521/ORCL"
    username          = "<DB_USERNAME>"
    password          = "<DB_PASSWORD>"
  }
}

prometheus.scrape "oracle" {
  targets    = prometheus.exporter.oracledb.oracle.targets
  forward_to = [prometheus.remote_write.default.receiver]
}

prometheus.remote_write "default" {
  endpoint {
    url = "<PROMETHEUS_REMOTE_WRITE_URL>"
  }
}
Alloy must have Oracle Instant Client Basic available on the host or in its container image. When using Oracle Wallet authentication, also configure TNS_ADMIN to point to the wallet directory. See the Grafana Alloy component reference for all available options, including custom metrics and multiple database targets.