Kafka Observability
Oracle Backend for Microservices and AI (OBaaS) provides a unified observability stack for Kafka that spans from the underlying infrastructure to the microservices producing and consuming messages. This integration is powered by the OpenTelemetry (OTEL) Collector and the OTEL Java Agent, providing a seamless view of metrics, traces, and logs.
Kafka Cluster Metrics
Kafka cluster metrics provide deep visibility into the health and performance of the brokers, topics, and partitions within your OBaaS cluster.
Enabling Cluster Metrics (Opt-in)
Kafka infrastructure monitoring is an "opt-in" feature. It uses the native OpenTelemetry kafkametrics receiver to scrape metadata directly from the Kafka bootstrap service, plus Strimzi's strimziMetricsReporter for broker JMX metrics (throughput, request latency, cluster health).
The examples/values-kafka.yaml example in the obaas Helm chart bundles both of these, so a single install or upgrade gives you a fully-observed Kafka cluster:
helm upgrade --install obaas obaas/obaas \
  -n obaas \
  -f helm/infra-charts/obaas/examples/values-kafka.yaml
If you already have Kafka enabled through a different values file, add kafka.metricsEnabled: true and the signoz.otelCollector.config.receivers.kafkametrics block from examples/values-kafka.yaml to your own values file instead.
Platform Automation for Infrastructure Metrics
The OBaaS platform automates several complex tasks to ensure Kafka metrics flow correctly:
- Universal Metric Bridge: The platform automatically creates an
ExternalNameservice calledkafka-bootstrapin your namespace. This acts as a stable alias for the internal Strimzi bootstrap service, ensuring the scraper doesn't need to change if the cluster is re-deployed. - Collector Configuration: The
kafkametricsreceiver config inexamples/values-kafka.yamlautomatically updates the SigNoz OpenTelemetry Collector's configuration to include the Kafka scraper in its metrics pipeline. - Broker Metrics Scraping: Setting
kafka.metricsEnabled: trueconfigures each broker with Strimzi'sstrimziMetricsReporterand asignoz.io/scrapepod annotation, so SigNoz's existing Prometheus receiver picks up broker JMX metrics automatically — no separate scrape config needed. - Service Name Resolution: The platform ensures that metrics are correctly tagged with the
service_nameof your application, allowing for easy filtering in SigNoz.
Kafka Server Monitoring Dashboard
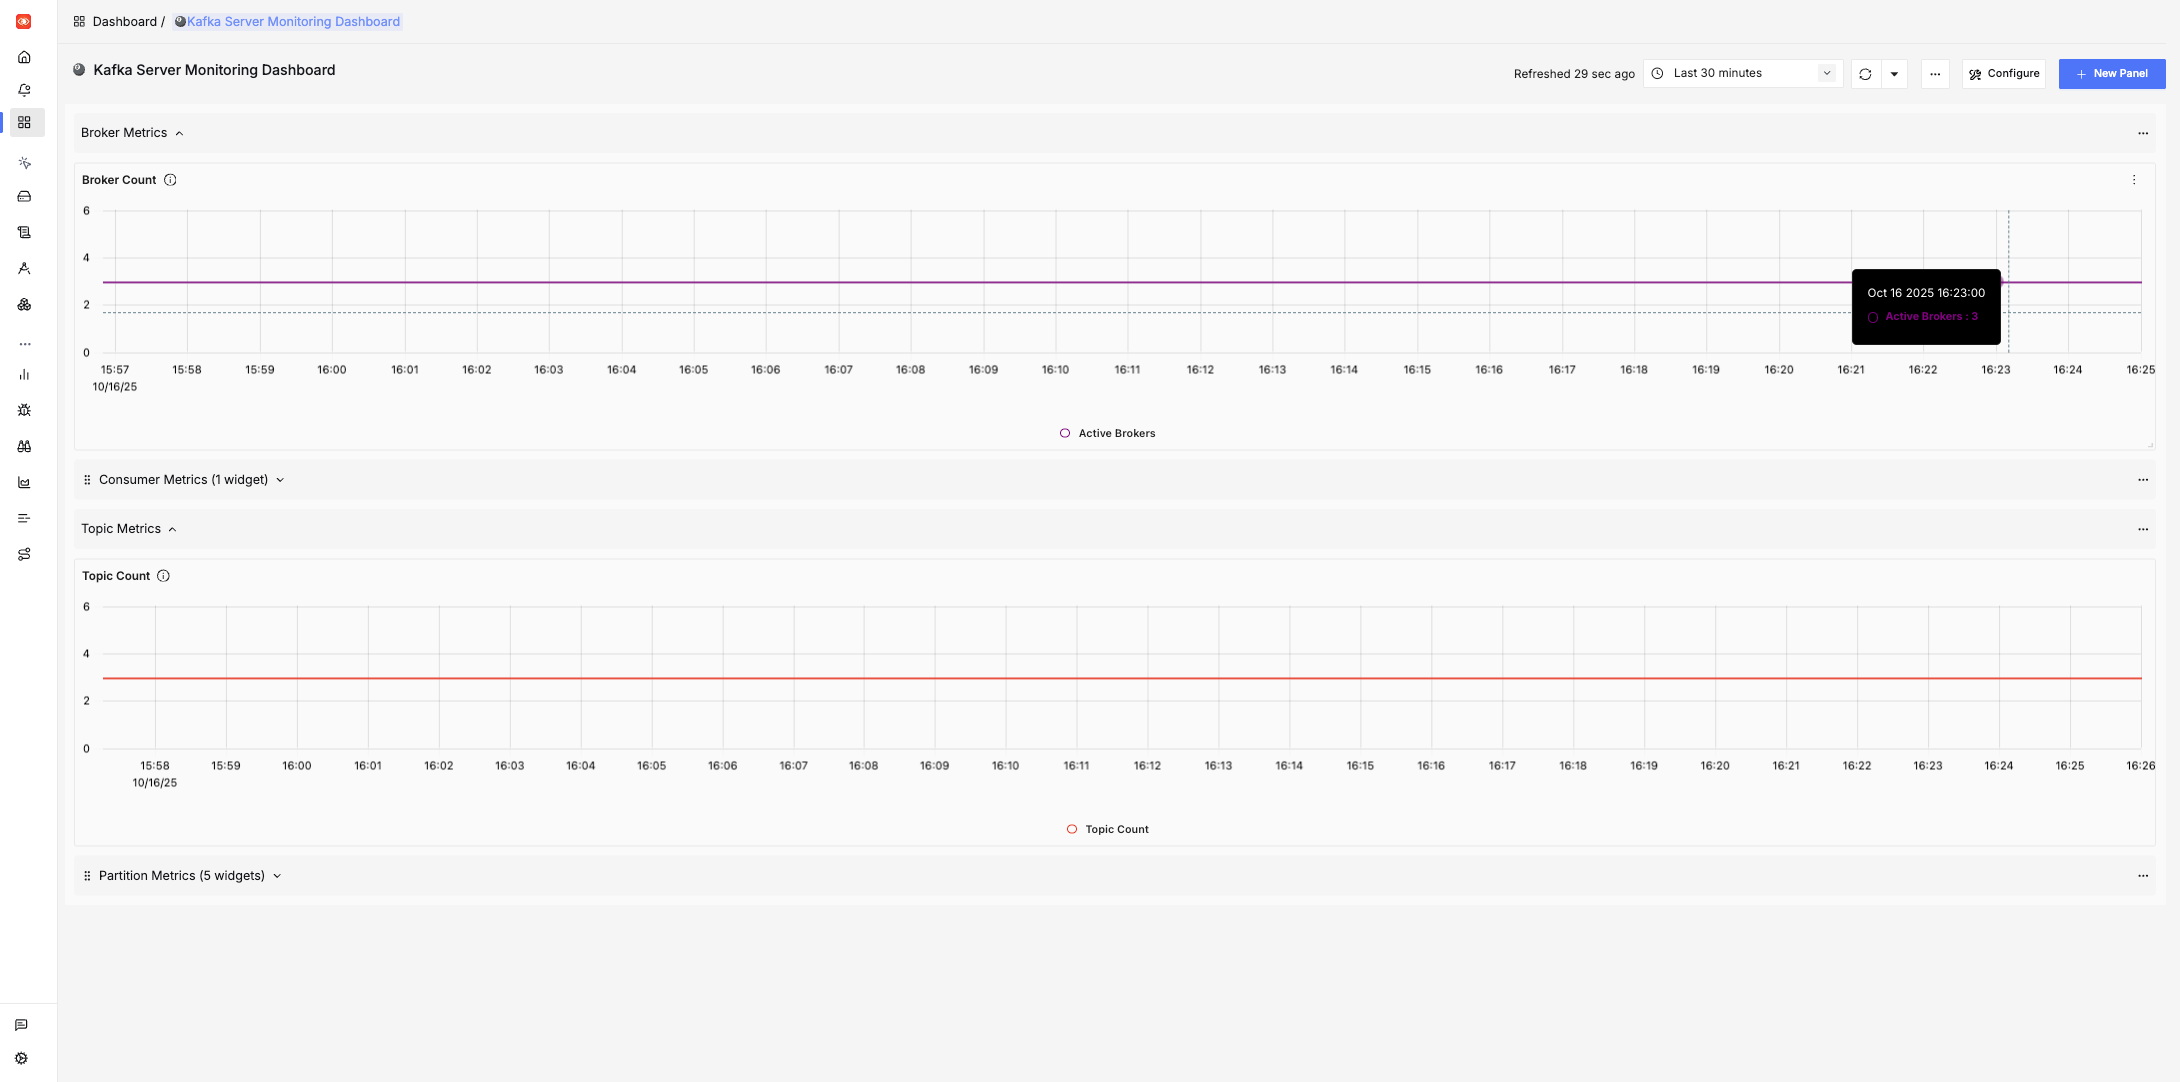
Once enabled, the Kafka Server Monitoring Dashboard automatically populates in SigNoz. This dashboard provides a centralized view of:
- Broker Health: Active broker count, controller status, and request handler pool utilization.
- Topic Metrics: Total topic count and message throughput (messages/bytes in and out per second, by topic).
- Partition Details: Current offsets, oldest offsets (retention), replica status (ISR count), under-replicated and offline partition counts, and per-partition log size.
- Consumer Groups: Real-time consumer group lag and member counts.
- Request Performance: p99 request latency and failed request rate for produce/fetch requests.
- Broker Resource Usage: JVM heap usage and CPU usage per broker.
Producer and Consumer Metrics
OBaaS provides "zero-touch" instrumentation for any Java microservice using the OpenTelemetry Java Agent.
Reference Examples
For a practical implementation, see the following projects in the cloudbank-v5 directory:
- helidon-producer: Demonstrates producing messages using MicroProfile Reactive Messaging.
- helidon-consumer: Demonstrates consuming messages with automatic trace propagation.
Both services illustrate how to configure OTLP metrics by simply setting the OTEL_INSTRUMENTATION_KAFKA_METRICS_ENABLED flag.
Enabling Application Metrics
To enable Kafka-specific metrics in your microservice, you must set the following environment variable in your values.yaml:
env:
  - name: OTEL_INSTRUMENTATION_KAFKA_METRICS_ENABLED
    value: "true"
Automated Instrumentation and Configuration
When you deploy a microservice using the OBaaS sample app chart, the platform handles the following automatically:
- Agent Injection: The OpenTelemetry Java Agent is automatically injected into your pod as an init container.
- Endpoint Configuration: The
OTEL_EXPORTER_OTLP_ENDPOINTis dynamically set to point to the SigNoz OTLP collector. - Trace Propagation: The agent automatically handles the injection and extraction of trace headers into Kafka messages, ensuring end-to-end distributed tracing without any code changes.
Key Performance Indicators (KPIs)
The following metrics are exported by the agent and available in the SigNoz Metrics Explorer:
| Metric Name | Description |
|---|---|
kafka.producer.record_send_rate | Average records sent per second. |
kafka.producer.request_latency_max | Maximum acknowledgment time from the broker. |
kafka.producer.outgoing_byte_rate | Data throughput in bytes per second. |
kafka.consumer.fetch_manager_records_lag_max | Maximum lag across all assigned partitions. |
kafka.consumer.bytes_consumed_total | Total volume of data processed by the consumer. |
Distributed Tracing & Logging
OBaaS automatically correlates every Kafka operation with distributed traces and structured JSON logs.
- Trace Correlation: Every log generated during a Kafka send or receive operation is stamped with
trace_idandspan_id. - Latency Attribution: SigNoz renders a single flamegraph showing the original HTTP request, the Kafka publish operation, and the subsequent message processing in the consumer.
Tip: Helidon 4 and Reactive Messaging
Helidon 4's use of Java 21 Virtual Threads ensures that the blocking operations of the Kafka client (like broker acknowledgments) do not block OS threads, while the OTEL agent maintains full context propagation across these virtual threads.