
Troubleshoot problems with the Service mesh
Self guided student - video introduction
This video is an introduction to the troubleshooting with a Service mesh lab. Depending on your browser settings it may open in this tab / window or open a new one. Once you've watched it please return to this page to continue the labs.
[](https://youtu.be/2KFBV1vJcGI "Using the service mesh to help troubleshoot introduction video")
---
Introduction
This is one of the optional sets of Kubernetes labs
Estimated module duration 20 mins.
Objectives
This module shows how to use Linkerd to see identify problems in the traffic between your microservices.
Prerequisites
You need to complete the Rolling update module (last of the core Kubernetes labs modules). You must have completed the Installing the Linkerd service mesh module. You can have done any of the other optional module sets, or any combination of the other service mesh modules.
Task 1: What the service mesh brings to troubleshooting
A service mesh like Linkerd doesn’t just provide encryption and traffic statistics. It can also be used to help identify problems though it’s monitoring capabilities.
In this module we are going to look at how to use a service mesh to track down the cause of a problem.
What’s the definition of a problem ?
in the case of Linkerd if a service fails to respond at all, or it responds but with a 5xx series response code it’s determined to have been a failed request. Note that there are many response codes that an application can return, for example 409 represents a conflict, but these codes are considered valid responses, not failures in that they are reasonably things for the service to respond, a 409 error may for example be a completely justified response if you’re trying to create an object which already exists, and 404 could also be completely valid if you’re trying to access an object that does not exist. It may be simplistic, but 4xx series error codes could be regarded as a client error for using invalid data for the request.
5xx series error codes (or no connection to / response from the server at all) are pretty fatal however. A 5xx series error code can’t be resolved by correcting details in the request, it means there’s something pretty major going on that needs to be dealt with, basically it reflect an internal problem with coding, configuration or operational environment in the service.
Where do we get our problem source from ?
Well fortunately for us I have built a version of the Stock Manager that can be configured to generate deliberate errors (I promise it’s not just me doing bad coding :-) ) We will deploy this new version and then configure it to generate errors on half of the requests it makes.
Task 2: Using a service mesh to troubleshoot
Task 2a: Start the load generator
The first thing we need is some load so we can see what the service mesh is doing, there is a load generator script we can use to do this
Change to the directory for the service mesh scripts
- In the OCI Cloud shell type
<copy>cd $HOME/helidon-kubernetes/service-mesh</copy>
Once you are in the directory start the load generator
If your cloud shell session is new or has been restarted then the shell variable $EXTERNAL_IP may be invalid, expand this section if you think this may be the case to check and reset it if needed.
How to check if $EXTERNAL_IP is set, and re-set it if it's not
**To check if `$EXTERNAL_IP` is set**
If you want to check if the variable is still set type `echo $EXTERNAL_IP` if it returns the IP address you're ready to go, if not then you'll need to re-set it, there are a couple of ways to do this, expand the appropriate section below.
If you used the automated scripts in the kubernetes-lab directory to setup the microservices in Kubernetes
- Open the OCI cloud shell
The automated scripts will create a script file `$HOME/clusterSettings.one` this can be executed using the shell built in `source` to set the EXTERNAL_IP variable for you.
```bash
source $HOME/clusterSettings.one
```
```
EXTERNAL_IP set to 139.185.45.98
NAMESPACE set to tg
```
Of course the actual IP address and namespace will almost certainly be different from the example here !
---
If you manually setup the Kubernetes ingress services using helm
In this case as you manually set this up you will need to get the information from Kubernetes itself
- Open the OCI cloud shell
- You are going to get the value of the `EXTERNAL_IP` for your environment. This is used to identify the DNS name used by an incoming connection. In the OCI cloud shell type
```bash
kubectl get services -n ingress-nginx
```
```
NAME TYPE CLUSTER-IP EXTERNAL-IP PORT(S) AGE
ingress-nginx-controller LoadBalancer 10.96.182.204 130.162.40.241 80:31834/TCP,443:31118/TCP 2h
ingress-nginx-controller-admission ClusterIP 10.96.216.33 443/TCP 2h
```
- Look for the `ingress-nginx-controller` line and note the IP address in the `EXTERNAL-IP` column, in this case that's `130.162.40.121` but it's almost certain that the IP address you have will differ. IMPORTANT, be sure to use the IP in the `EXTERNAL-IP` column, ignore anything that looks like an IP address in any other column as those are internal to the OKE cluster and not used externally.
- IN the OCI CLoud shell type the following, replacing `[external ip]` with the IP address you retrieved above.
```bash
export EXTERNAL_IP=[external ip]
```
---
</details>
</details>
2. In the OCI Cloud shell type
```bash
bash generate-service-mesh-load.sh $EXTERNAL_IP 2
```
```
Iteration 1
Iteration 2
...
```
This will continue generating the load making a request approximately once every two seconds.
If you get a DNS error that `store.2.nip.io` (or similar) cannot be found this means that `EXTERNAL_IP` is not set, follow the instructions above to set it and then re-run the curl command.
Note, the OCI Cloud Shell session will terminate (and thus kill off the load generator) after 20 minutes of inactivity. If this happens you will see the throughput figures for your namespace and services in the Linkerd and Grafana UI's drop to zero and potentially even disappear if they fall outside the time ranges displayed.
If that happens while you are doing the service mesh labs the solution is to connect back to the OCI CLoud shell and restart the load generator
### Task 2b: Viewing the load
Let's just check that the load is running fine
1. In your web browser go to `https://linkerd..nip.io` (replace `` with the IP of the load balancer)
You may be challenged as you have a self signed certificate. Follow the normal procedures in your browser to accept the connection and proceed.
Next you may be presented with the login challenge.
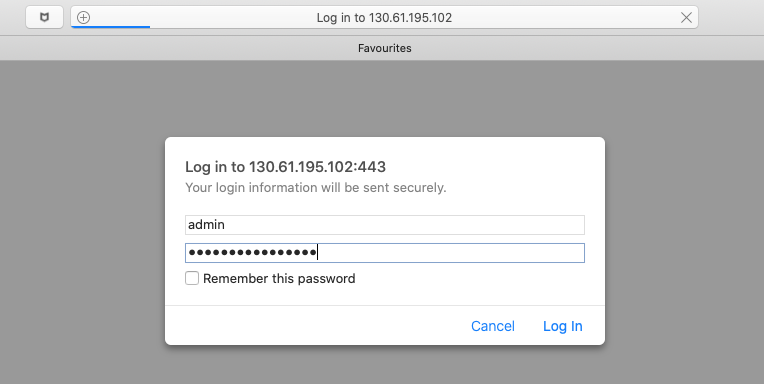
2. If you are, login with `admin` as the username, for the password use the one you used when creating the login password during the linkerd installation in the previous module.
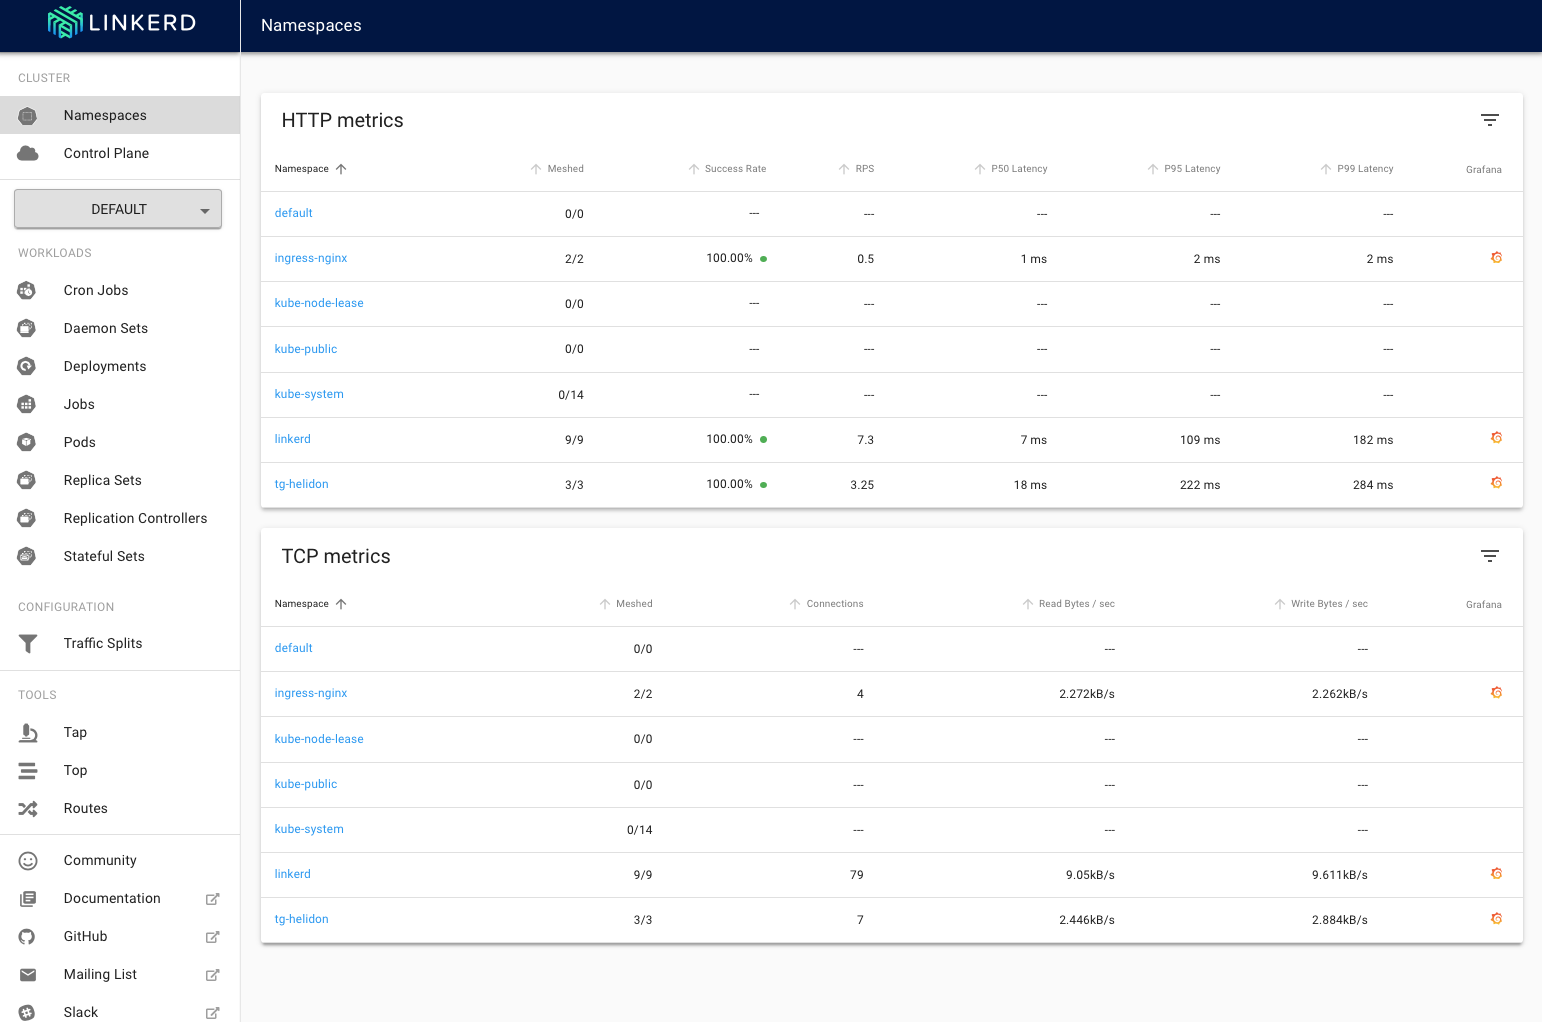
You'll be presented with the linkerd-web main page, unlike when you saw this previously now it's showing load for your services.
3. Click on the page for your namespace (tg-helidon in my case)
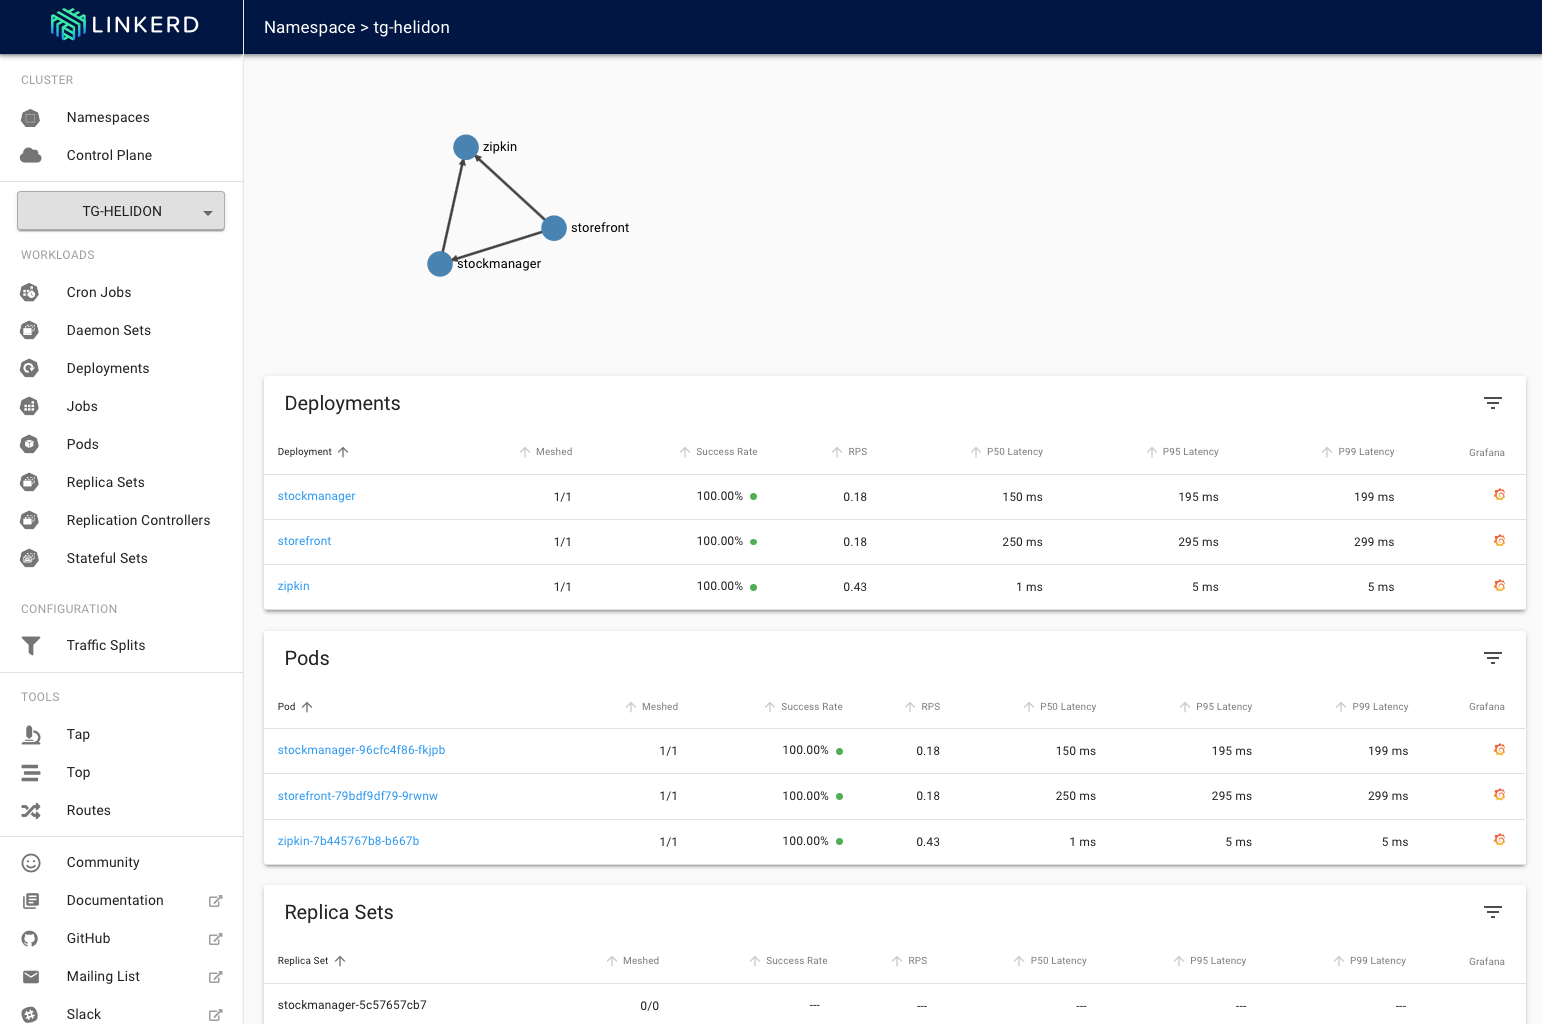
We can see that the services are running with a 100% success rate.
For now let's stop the load generator while we deploy our "broken" service
4. In the OCI cloud shell stop the load generator using Control-C
### Task 2c: Deploying our broken service
We are going to edit one of the configurations for the stock manager to specify that we want a 50% failure rate on requests to the stock manager. The deliberately "broken" stockmanager will pay attention to this, but the normal one will not.
1. In the OCI Cloud Shell use your preferred editor (vi, nano etc.) to edit the stock manager configuration
```bash
vi $HOME/helidon-kubernetes/configurations/stockmanagerconf/conf/stockmanager-config.yaml
```
2. Add the following to the end of the file on a line of it's own, note that this is **not** indented
```
errorgenerationrate: 0.5
```
The resulting file will look something like this **the department name should be different in your case** it should not be `Tims shop` unless your name is Tim !
```yaml
app:
persistenceUnit: "HelidonATPJTA"
department: "Tims Shop"
tracing:
service: "stockmanager"
host: "zipkin"
errorgenerationrate: 0.5
```
3. Save the updated file
Strangely `kubectl` doesn't seem to have a mechanism to replace a config map that's been created using multiple files in a directory, so we will have to delete and then re-create the stockmanager
4. In the OCI Cloud shell type
```bash
kubectl delete configmap sm-config-map
```
```
configmap "sm-config-map" deleted
```
5. In the OCI Cloud shell type
```bash
kubectl create configmap sm-config-map --from-file=$HOME/helidon-kubernetes/configurations/stockmanagerconf/conf
```
```
configmap/sm-config-map created
```
Now we can apply the update, we'll use the Kubernetes rolling upgrade process to make the change (as we're going to want to revert this one!)
6. In the OCI Cloud shell type
```bash
kubectl apply -f $HOME/helidon-kubernetes/service-mesh/stockmanager-deployment-broken.yaml
```
```
deployment.apps/stockmanager configured
```
Wait a short while for the update to be applied.
This is basically the same stockmanager code that was created in the Helidon labs, however it has a bit of additional code that generates errors at the rate specified by the errorGeneration rate we set in the config file.
Now let's check that the change has applied by going direct to the stockmanager and seeing how it behaves, remember that we said that 0.5 (so 50%) of the requests should generate an error.
7. In the OCI Cloud shell type the following
```bash
curl -i -k -X GET -u jack:password https://store.$EXTERNAL_IP.nip.io/sm/stocklevel
```
(As usual the first response may take a short while, if you get a 503 error it means that the Kubernetes is waiting for the stockmanager to come online. If you get a 'Cannot resolve host' or similar then the `$EXTErNAL_IP` address is wrong, follow the earlier instructions in an expansion section to set it correctly.
Depending on if you get an error you'll get something similar to the following
If the code randomly throws the error
```
HTTP/1.1 500 Internal Server Error
Server: nginx/1.17.8
Date: Mon, 01 Jun 2020 18:52:11 GMT
Content-Length: 0
Connection: keep-alive
Strict-Transport-Security: max-age=15724800; includeSubDomains
```
If the code randomly works correctly
```
HTTP/1.1 200 OK
Server: nginx/1.17.8
Date: Mon, 01 Jun 2020 18:52:09 GMT
Content-Type: application/json
Content-Length: 149
Connection: keep-alive
Strict-Transport-Security: max-age=15724800; includeSubDomains
[{"itemCount":410,"itemName":"Pencil"},{"itemCount":50,"itemName":"Eraser"},{"itemCount":4490,"itemName":"Pins"},{"itemCount":100,"itemName":"Book"}]
```
Repeat the request several times and you should see that approximately half the time you get a response of `500 Internal Server Error` and half the time a response of `200 OK`
Now try making the request a few times to the storefront service
8. In the OCI Cloud shell type the following
```bash
curl -i -k -X GET -u jack:password https://store.$EXTERNAL_IP.nip.io/store/stocklevel
```
You will get either error messages like this
```
HTTP/1.1 424 Failed Dependency
Server: nginx/1.17.8
Date: Mon, 01 Jun 2020 19:15:21 GMT
Content-Type: application/json
Transfer-Encoding: chunked
Connection: keep-alive
Strict-Transport-Security: max-age=15724800; includeSubDomains
{"errormessage":"Unable to connect to the stock manager service"}
```
Or it will succeed
```
HTTP/1.1 200 OK
Server: nginx/1.17.8
Date: Mon, 01 Jun 2020 19:15:17 GMT
Content-Type: application/json
Content-Length: 149
Connection: keep-alive
Strict-Transport-Security: max-age=15724800; includeSubDomains
[{"itemCount":410,"itemName":"Pencil"},{"itemCount":50,"itemName":"Eraser"},{"itemCount":4490,"itemName":"Pins"},{"itemCount":100,"itemName":"Book"}]
```
As before repeat this a few times, approximately half the time it will succeed and half the time it will fail. Note that if you had tried this on the reserverStock end point it would fail 75% of the time - because that API makes two calls to the stockmanager, either of which failing will result in a failure back to the caller.
Restart the load generator
9. In the OCI Cloud shell type
```bash
bash generate-service-mesh-load.sh $EXTERNAL_IP 2
```
```
Iteration 1
Iteration2
...
```
As previously if the OCI shell stops then you will need to re-open is and re-start the load generator.
### Step 2d: Looking at the results using the service mesh
We'll open the LinkerdUI and see what it's reporting.
1. In your web browser go to `https://linkerd..nip.io` (replace `` of course) If asked login with the user name admin and the password you chose when setting up the Linkerd ingress
2. Click on **Namespaces** in the **Cluster** section of the left menu and locate the **HTTP metrics** entry for your namespace (mine is tg-helidon, yours will have a different name)

While the precise numbers will of course vary you should see that the success rate is not 100%, it's likely to be around 90% That is not a surprise (after all we are deliberately throwing an error on about half of the calls to the stock manager) but it looks like we have a bit of a problem!
Why only 90% ?
Remember that here we're looking at all the HTTP REST API calls that happen in the entire namespace, including those inbound from the Ingress controller as well as calls to the Zipkin tracing, so while we'd expect to see some calls fail (about half of the calls to the stockmanager) won't be half of the overall calls made between services in the namespace.
---