
Install and setup a Service mesh
Self guided student - video introduction
This video is an introduction to the Service mesh basics lab. Depending on your browser settings it may open in this tab / window or open a new one. Once you've watched it please return to this page to continue the labs.
[](https://youtu.be/jfNp6VEfFEk "Service mesh setup lab introduction video")
---
Introduction
This is one of the optional sets of Kubernetes labs
Estimated module duration 20 mins.
Objectives
This module shows how to install and configure the Linkerd service mesh, and enable its use with the microservices.
Prerequisites
You need to complete the Rolling update module (last of the core Kubernetes labs modules). You can have done any of the other optional module sets.
Task 1: What is a service mesh
The concept behind a service mesh is pretty simple. It’s basically a set of network proxies that are conceptually interposed between the containers running on a pod and the external network of the pod. This is achieved by the service mesh management capability (the control plane) which automatically adds proxies (the data plane) to the pods when the pods are started (if the pod is in a namespace that requests this via annotations)
The following diagram (from buoyant.io) shows the components in the linkerd service mesh, but other service mesh implementations have a similar structure. In this architecture, the proxies run as containers within the pod using the sidecar pattern

The data plane consists of proxies which intercept the network operations of the pods and can apply rules to the data, for example restricting which services can be called by other services, encrypting data between proxies so cross microservice connections are transparently encrypted, splitting or mirroring traffic to help with update processes, and also gathering metrics on the number of calls, how often a cross microservice call failed and such like. Of course in a non Kubernetes environment you may have had your network switches or host operating systems do this, and many organizations had various levels of networking (separated by firewalls) for users, web applications, and databases, but in Kubernetes the boundary between the physical and logical compute resources is blurred, so using a service mesh allows you to have a simple implementation approach that applies regardless of if pods are running on the same node, different nodes in the same environment, or potentially even between data centers in opposite sides of the world.
The control plans does what it says on the box, it provides control functions to the data plane, for example getting and updating certificates, providing a management point so you can set the properties you want the data plane to implement (and passing those to the data plane)
The mechanisms to do this are relatively simple to the user, though the internal implementation details of a service mash can be very complex!
Service meshes can also provide functionality across multiple clusters, in these modules we will be using Linkerd, and that provides the capability to extend the service discovery across multiple Kubernetes clusters, that means a service in a different cluster can appear as if it was a local part of the data plane, enabling things like automatic connection to a service in a different cluster and automatic connection encryption between services in different clusters.
What service meshes are there ?
There are multiple service mesh implementations available, a non exclusive list (there are others) includes the Oracle OCI Service mesh, Linkerd, Istio, Consul, Kuma, Maesh, Aspen Mesh, and Grey Matter.
Most Service mesh implementations are open source to some level, but currently only Linkerd from Buoyant Inc. is listed as being a Cloud Native Computing Foundation (the governance body for open source Kubernetes related things) project though there have been press discussions that Istio may be donated by Google to an open source foundation.
Currently there is no agreed standard on how to manage a service mesh, or even exactly what it does, though the CNCF Service Mesh Interface project is starting to define one.
Task 2: What does that mean as an cluster operator or administrator?
Well the short version is that you need to be careful in choosing the right service mesh to meet your needs!
The longer version is that at least some of your concerns about managing networking within Kubernetes deployments have gone away. In addition, you will gain insight into the traffic and overall health of your applications running in Kubernetes.
Installing a service mesh adds an additional layer of abstraction to your cluster. This is not unlike the network overlay that runs on your cluster. There is a processing overhead to this, but it’s pretty small.
Ultimately, the way to think about a service mesh as a cluster operator is to consider that adding this layer will result in better observability and security for your applications.
Task 3: Which service mesh to use ?
There is no simple answer to this, as none of them are built into Kubernetes and there is no official standard.
Factors to consider are functionality, if it’s fully or partially open source, what support is available (most service mesh implementations have a company behind them that provides commercial support on the open source product) and also if you want to follow the CNCF projects list or not (some Kubernetes users are only willing to consider official CNCS projects for compatibility and other reasons)
The important thing is to define your requirements before selecting a service mesh.
Task 4: How to install the Linkerd service mesh ?
For the purposes of this lab we’ve chosen to use Linkerd as it’s a long standing service mesh implementation and is the only CNCF supported service mesh project (at the time of writing.) It also has a reputation for being simple to install and use. The Linkerd website has an FAQ on the differences and open source implications
Linkerd is installed in two parts, the linkerd command which runs local to your environment (similar to the kubectl command) and the linkerd control pane which runs in your Kubernetes cluster (similar to the Kubernetes cluster management elements) and manages the data plane.
These instructions are based on the Getting started page at Linkerd.io and install Linkerd v2.11,
It’s worth noting that Linkerd can also be installed using its helm chart but today we’re going to do it manually step by step.
Task 4a: Installing the linkerd CLI
As linkerd is not a core Kubernetes component it’s not included in the Oracle OCI Shell, so we need to do that first.
- In the OCI Cloud Shell type the follwing
<copy>curl -sL https://run.linkerd.io/install | sh</copy>
Downloading linkerd2-cli-stable-2.10.0-linux...
  % Total    % Received % Xferd  Average Speed   Time    Time     Time  Current
                                 Dload  Upload   Total   Spent    Left  Speed
100   644  100   644    0     0   1556      0 --:--:-- --:--:-- --:--:--  1559
100 37.0M  100 37.0M    0     0  13.5M      0  0:00:02  0:00:02 --:--:-- 21.1M
Download complete!

Validating checksum...
Checksum valid.

Linkerd stable-2.11.0 was successfully installed 🎉


Add the linkerd CLI to your path with:

  export PATH=$PATH:/home/tim_graves/.linkerd2/bin

Now run:

  linkerd check --pre                     # validate that Linkerd can be installed
  linkerd install | kubectl apply -f -    # install the control plane into the 'linkerd' namespace
  linkerd check                           # validate everything worked!
  linkerd dashboard                       # launch the dashboard

Looking for more? Visit https://linkerd.io/2.11/next-steps
Warning, this may take a while to run, in my case it usually takes around 30 seconds, but sometimes has taken as long as 20 mins if for some reason the download was not fast.
- Now we need to add the linkerd command to our path. In the OCI Cloud Shell type
<copy>export PATH=$PATH:$HOME/.linkerd2/bin</copy>
This is only a temporary change, that applies to the current OCI Cloud shell session. To make it permanent we need to edit the $HOME/.bashrc file
-
Use your preferred editor (vi, vim, nano etc.) edit $HOME/.bashrc
-
At the end of the file add and new line containing
<copy>export PATH=$PATH:$HOME/.linkerd2/bin</copy>
- Lastly let’s check the status of the linkerd installation. In the OCI Cloud Shell type
<copy>linkerd version</copy>
Client version: stable-2.11.0
Server version: unavailable
The server is unavailable because we haven’t installed it yet. The version numbers will of course change over time, but these are the ones when this lab module was written.
Task 4b: Installing linkerd into your Kubernetes cluster
Though we have the linkerd client application we still need to install the linkerd control plan in our cluster (The control plane will handle deploying the proxies in the data plane)
Firstly let’s make sure that the cluster meets the requirements to deploy linkerd
- In the OCI Cloud shell type :
<copy>linkerd check --pre</copy>
kubernetes-api
--------------
√ can initialize the client
√ can query the Kubernetes API

kubernetes-version
------------------
√ is running the minimum Kubernetes API version
√ is running the minimum kubectl version

pre-kubernetes-setup
--------------------
√ control plane namespace does not already exist
√ can create non-namespaced resources
√ can create ServiceAccounts
√ can create Services
√ can create Deployments
√ can create CronJobs
√ can create ConfigMaps
√ can create Secrets
√ can read Secrets
√ can read extension-apiserver-authentication configmap
√ no clock skew detected

pre-kubernetes-capability
-------------------------
‼ has NET_ADMIN capability
    found 2 PodSecurityPolicies, but none provide NET_ADMIN, proxy injection will fail if the PSP admission controller is running
    see https://linkerd.io/checks/#pre-k8s-cluster-net-admin for hints
‼ has NET_RAW capability
    found 2 PodSecurityPolicies, but none provide NET_RAW, proxy injection will fail if the PSP admission controller is running
    see https://linkerd.io/checks/#pre-k8s-cluster-net-raw for hints

linkerd-version
---------------
√ can determine the latest version
√ cli is up-to-date

Status check results are √
The pre-install check that the Kubernetes cluster (and the configuration of kubectl) is able to install linkerd. All the checks have passed (the tick by each line) so we’re good to install the linkerd control plane.
The linkerd control plan process used the linkerd command to generate the configuration yaml, which is then processed by kubectl.
- In the OCI Cloud Shell type
<copy>linkerd install | kubectl apply -f -</copy>
namespace/linkerd created
clusterrole.rbac.authorization.k8s.io/linkerd-linkerd-identity created
clusterrolebinding.rbac.authorization.k8s.io/linkerd-linkerd-identity created
serviceaccount/linkerd-identity created
clusterrole.rbac.authorization.k8s.io/linkerd-linkerd-controller created
clusterrolebinding.rbac.authorization.k8s.io/linkerd-linkerd-controller created
serviceaccount/linkerd-controller created
clusterrole.rbac.authorization.k8s.io/linkerd-linkerd-destination created
clusterrolebinding.rbac.authorization.k8s.io/linkerd-linkerd-destination created

...

Lots of messages about resources being created
...
deployment.apps/linkerd-tap created
configmap/linkerd-config-addons created
serviceaccount/linkerd-grafana created
configmap/linkerd-grafana-config created
service/linkerd-grafana created
deployment.apps/linkerd-grafana created
If you want to see exactly what is being done
To find out exactly what linkerd is going to install we can execute it without sending the output to kubectl. There is a lot of output, so we're going to redirect it to a file
- In the OCI Cloud Shell type
```bash
linkerd install > /tmp/linkerd-install-output
```
To see the YAML
- In the OCI Cloud Shell type
```bash
more /tmp/linkerd-install-output
```
```
---
###
### Linkerd Namespace
###
---
kind: Namespace
apiVersion: v1
metadata:
name: linkerd
annotations:
linkerd.io/inject: disabled
labels:
linkerd.io/is-control-plane: "true"
config.linkerd.io/admission-webhooks: disabled
linkerd.io/control-plane-ns: linkerd
---
###
### Identity Controller Service RBAC
###
---
kind: ClusterRole
apiVersion: rbac.authorization.k8s.io/v1
metadata:
name: linkerd-linkerd-identity
labels:
linkerd.io/control-plane-component: identity
linkerd.io/control-plane-ns: linkerd
... lots and lots more yaml output...
```
There is a lot of output here, we've only seen the beginning of it above
---
Let’s check that the linkerd command can talk to the control plane
- After a few mins delay for the linkerd control plane to startup, In the OCI Cloud Shell type
<copy>linkerd version</copy>
Client version: stable-2.11.0
Server version: stable-2.11.0
Expect a short delay while the linkerd command contacts the control plane servers.
If you get Unavailable for the server version or an error message that means the control plane is still starting, wait a short time and then re-run the command.
We can see the version information (this was correct at the time of writing, you make have later versions.)
Linkerd creates it’s own namespace so we can check what’s in there using kubectl
- In the OCI Cloud shell type
<copy>kubectl get namespaces</copy>
NAME              STATUS   AGE
default           Active   29d
ingress-nginx     Active   28d
kube-node-lease   Active   29d
kube-public       Active   29d
kube-system       Active   29d
linkerd           Active   63s
logging           Active   7d22h
monitoring        Active   27d
tg-helidon        Active   27d
(Depending on what lab modules you’ve done, and the name you gave your namespace the list will vary)
And we can see what’s in the linkerd namespace
- In the OCI Cloud shell type
<copy>kubectl get all -n linkerd</copy>
NAME                                          READY   STATUS    RESTARTS   AGE
pod/linkerd-controller-b8f9df548-m45zw        2/2     Running   0          4m20s
pod/linkerd-destination-77cc876746-vslqf      2/2     Running   0          4m19s
pod/linkerd-identity-695d64dfdf-sgdkh         2/2     Running   0          4m20s
pod/linkerd-proxy-injector-6d9db65bff-s77pm   2/2     Running   0          4m19s
pod/linkerd-sp-validator-5c77df9f7b-5nkp5     2/2     Running   0          4m19s

NAME                                TYPE        CLUSTER-IP     EXTERNAL-IP   PORT(S)    AGE
service/linkerd-controller-api      ClusterIP   10.96.27.60    <none>        8085/TCP   4m20s
service/linkerd-dst                 ClusterIP   10.96.175.38   <none>        8086/TCP   4m20s
service/linkerd-dst-headless        ClusterIP   None           <none>        8086/TCP   4m20s
service/linkerd-identity            ClusterIP   10.96.38.40    <none>        8080/TCP   4m20s
service/linkerd-identity-headless   ClusterIP   None           <none>        8080/TCP   4m20s
service/linkerd-proxy-injector      ClusterIP   10.96.46.245   <none>        443/TCP    4m19s
service/linkerd-sp-validator        ClusterIP   10.96.193.45   <none>        443/TCP    4m19s

NAME                                     READY   UP-TO-DATE   AVAILABLE   AGE
deployment.apps/linkerd-controller       1/1     1            1           4m20s
deployment.apps/linkerd-destination      1/1     1            1           4m19s
deployment.apps/linkerd-identity         1/1     1            1           4m20s
deployment.apps/linkerd-proxy-injector   1/1     1            1           4m19s
deployment.apps/linkerd-sp-validator     1/1     1            1           4m19s

NAME                                                DESIRED   CURRENT   READY   AGE
replicaset.apps/linkerd-controller-b8f9df548        1         1         1       4m21s
replicaset.apps/linkerd-destination-77cc876746      1         1         1       4m20s
replicaset.apps/linkerd-identity-695d64dfdf         1         1         1       4m21s
replicaset.apps/linkerd-proxy-injector-6d9db65bff   1         1         1       4m20s
replicaset.apps/linkerd-sp-validator-5c77df9f7b     1         1         1       4m20s

NAME                              SCHEDULE       SUSPEND   ACTIVE   LAST SCHEDULE   AGE
cronjob.batch/linkerd-heartbeat   32 16 * * *    False     0        <none>          4m20s
Linkerd has created a number of items, but note that all of the pods have 2 instances (for high availability).
Let’s get linkerd to check that it’s been installed correctly and everything is running.
- In the OCI Cloud Shell type
<copy>linkerd check</copy>
kubernetes-api
--------------
√ can initialize the client
√ can query the Kubernetes API

kubernetes-version
------------------
√ is running the minimum Kubernetes API version
√ is running the minimum kubectl version

linkerd-existence
-----------------
√ 'linkerd-config' config map exists
√ heartbeat ServiceAccount exist
√ control plane replica sets are ready
√ no unschedulable pods
√ controller pod is running
√ can initialize the client
√ can query the control plane API

linkerd-config
--------------
√ control plane Namespace exists
√ control plane ClusterRoles exist
√ control plane ClusterRoleBindings exist
√ control plane ServiceAccounts exist
√ control plane CustomResourceDefinitions exist
√ control plane MutatingWebhookConfigurations exist
√ control plane ValidatingWebhookConfigurations exist
√ control plane PodSecurityPolicies exist

linkerd-identity
----------------
√ certificate config is valid
√ trust anchors are using supported crypto algorithm
√ trust anchors are within their validity period
√ trust anchors are valid for at least 60 days
√ issuer cert is using supported crypto algorithm
√ issuer cert is within its validity period
√ issuer cert is valid for at least 60 days
√ issuer cert is issued by the trust anchor

linkerd-api
-----------
√ control plane pods are ready
√ control plane self-check
√ [kubernetes] control plane can talk to Kubernetes
√ [prometheus] control plane can talk to Prometheus
√ tap api service is running

linkerd-version
---------------
√ can determine the latest version
√ cli is up-to-date

control-plane-version
---------------------
√ control plane is up-to-date
√ control plane and cli versions match

linkerd-addons
--------------
√ 'linkerd-config-addons' config map exists

linkerd-grafana
---------------
√ grafana add-on service account exists
√ grafana add-on config map exists
√ grafana pod is running

Status check results are √
If the linkerd environment is not yet running the check will block until the services are starting.
You can see that everything is running fine, there is a lot more output as the check confirms that linkerd itself has all the elements it needs to operate, and it is working fine.
Prior to version 2.10.0 Linkerd used to install a number of other components as standard (Prometheus, Grafana and the Linkerd dashboard) but they are now installed separately as Linkerd extensions. This allows you to setup clusters that are managed by the cli / yaml files without the overhead of the visuals. Importantly to help us with debugging the viz extentions also include the Linkerd tap service which will let us look into the requests as they flow through the service mesh.
For this lab however we want to see the visuals, so let’s install them. First we’re going to install the underlying support for visualization.
- In the OCI Cloud Shell type
<copy>linkerd viz install | kubectl apply -f -</copy>
namespace/linkerd-viz created
clusterrole.rbac.authorization.k8s.io/linkerd-linkerd-viz-metrics-api created
clusterrolebinding.rbac.authorization.k8s.io/linkerd-linkerd-viz-metrics-api created
serviceaccount/metrics-api created
serviceaccount/grafana created
clusterrole.rbac.authorization.k8s.io/linkerd-linkerd-viz-prometheus created
clusterrolebinding.rbac.authorization.k8s.io/linkerd-linkerd-viz-prometheus created
serviceaccount/prometheus created
clusterrole.rbac.authorization.k8s.io/linkerd-linkerd-viz-tap created
clusterrole.rbac.authorization.k8s.io/linkerd-linkerd-viz-tap-admin created
clusterrolebinding.rbac.authorization.k8s.io/linkerd-linkerd-viz-tap created
clusterrolebinding.rbac.authorization.k8s.io/linkerd-linkerd-viz-tap-auth-delegator created
serviceaccount/tap created
rolebinding.rbac.authorization.k8s.io/linkerd-linkerd-viz-tap-auth-reader created
secret/tap-k8s-tls created
apiservice.apiregistration.k8s.io/v1alpha1.tap.linkerd.io created
role.rbac.authorization.k8s.io/web created
rolebinding.rbac.authorization.k8s.io/web created
clusterrole.rbac.authorization.k8s.io/linkerd-linkerd-viz-web-check created
clusterrolebinding.rbac.authorization.k8s.io/linkerd-linkerd-viz-web-check created
clusterrolebinding.rbac.authorization.k8s.io/linkerd-linkerd-viz-web-admin created
clusterrole.rbac.authorization.k8s.io/linkerd-linkerd-viz-web-api created
clusterrolebinding.rbac.authorization.k8s.io/linkerd-linkerd-viz-web-api created
serviceaccount/web created
rolebinding.rbac.authorization.k8s.io/viz-psp created
service/metrics-api created
deployment.apps/metrics-api created
configmap/grafana-config created
service/grafana created
deployment.apps/grafana created
configmap/prometheus-config created
service/prometheus created
deployment.apps/prometheus created
service/tap created
deployment.apps/tap created
clusterrole.rbac.authorization.k8s.io/linkerd-tap-injector created
clusterrolebinding.rbac.authorization.k8s.io/linkerd-tap-injector created
serviceaccount/tap-injector created
secret/tap-injector-k8s-tls created
mutatingwebhookconfiguration.admissionregistration.k8s.io/linkerd-tap-injector-webhook-config created
service/tap-injector created
deployment.apps/tap-injector created
service/web created
deployment.apps/web created
If you looked at the namespaces you’d see a new namespace called linkerd-viz has appeared, this contains the services for the visuals we just installed
Other Linkerd extensions
Linkerd has a number of other extensions that include things like Jeager (tracing), multi cluster support, and also support for 3rd party extensions for example the [Boyant Cloud (Which provides a hosted dash board for displaying the linkerd metrics)](https://buoyant.io/cloud)
Now let’s make sure everything installed correctly
- In the OCI CLoud shell type
<copy>linkerd check</copy>
...
(You'll see the previous check output first)
...
Linkerd extensions checks
=========================

linkerd-viz
-----------
√ linkerd-viz Namespace exists
√ linkerd-viz ClusterRoles exist
√ linkerd-viz ClusterRoleBindings exist
√ tap API server has valid cert
√ tap API server cert is valid for at least 60 days
√ tap API service is running
√ linkerd-viz pods are injected
√ viz extension pods are running
√ prometheus is installed and configured correctly
√ can initialize the client
√ viz extension self-check

Status check results are √
At the end of the output we’ll see the status of the extensions.
Task 5: Configuring access to the linkerd UI
Linkerd is managed via the linkerd command OR via it’s browser based dashboard. In general you want to use the dashboard as it give you access to the Grafana instance provided by Linkerd and thus you get the visualizations.
There are several ways to access the linkerd dashboard. In a production deployment you would use an ingress with very strict security rules, and configure linkerd to only accept external connections via that ingress, but to fully implement that requires the use of a certificate and DNS configuration.
For ease of setting up the lab we are going to use an ingress but relax the security constraints around accessing the linkerd web front end a bit YOU SHOULD NEVER DO THIS IN A PRODUCTION ENVIRONMENT - a service mesh like linkerd controls the entire communications network in your cluster, unauthorized access to it would enable hackers to have complete control of your cluster communications.
Task 5a: Removing the linkerd-web hosts restriction
The first thing we need to do is to remove the restriction in the linkerd web front end on which hosts are allowed to access the web front end. Of course you would not do this in a production system!
- In the OCI Cloud shell type
<copy>kubectl edit deployment web -n linkerd-viz</copy>
- In the spec.template.spec.containers.args locate the line that is like
- -enforced-host=^(localhost|127\\.0\\.0\\.1|linkerd-web\\.linkerd\\.svc\\.cluster\\.local|linkerd-web\\.linkerd\\.svc|\\[::1\\])(:\\d+)?$
- Remove all of the value section of the line after the
= the new line will look like
- Save the changes
kubectl will pick them up and apply them, Kubernetes will restart the linkerd-web deployment with the new arguments and linkerd-web will no longer enforce the check on the hostnames.
Task 5b: Securing the connection to the linkerd UI
If your cloud shell session is new or has been restarted then the shell variable $EXTERNAL_IP may be invalid, expand this section if you think this may be the case to check and reset it if needed.
How to check if $EXTERNAL_IP is set, and re-set it if it's not
**To check if `$EXTERNAL_IP` is set**
If you want to check if the variable is still set type `echo $EXTERNAL_IP` if it returns the IP address you're ready to go, if not then you'll need to re-set it, there are a couple of ways to do this, expand the appropriate section below.
If you used the automated scripts in the kubernetes-lab directory to setup the microservices in Kubernetes
- Open the OCI cloud shell
The automated scripts will create a script file `$HOME/clusterSettings.one` this can be executed using the shell built in `source` to set the EXTERNAL_IP variable for you.
```bash
source $HOME/clusterSettings.one
```
```
EXTERNAL_IP set to 139.185.45.98
NAMESPACE set to tg
```
Of course the actual IP address and namespace will almost certainly be different from the example here !
---
If you manually setup the Kubernetes ingress services using helm
In this case as you manually set this up you will need to get the information from Kubernetes itself
- Open the OCI cloud shell
- You are going to get the value of the `EXTERNAL_IP` for your environment. This is used to identify the DNS name used by an incoming connection. In the OCI cloud shell type
```bash
kubectl get services -n ingress-nginx
```
```
NAME TYPE CLUSTER-IP EXTERNAL-IP PORT(S) AGE
ingress-nginx-controller LoadBalancer 10.96.182.204 130.162.40.241 80:31834/TCP,443:31118/TCP 2h
ingress-nginx-controller-admission ClusterIP 10.96.216.33 443/TCP 2h
```
- Look for the `ingress-nginx-controller` line and note the IP address in the `EXTERNAL-IP` column, in this case that's `130.162.40.121` but it's almost certain that the IP address you have will differ. IMPORTANT, be sure to use the IP in the `EXTERNAL-IP` column, ignore anything that looks like an IP address in any other column as those are internal to the OKE cluster and not used externally.
- IN the OCI CLoud shell type the following, replacing `[external ip]` with the IP address you retrieved above.
```bash
export EXTERNAL_IP=[external ip]
```
---
</details>
</details>
Curiously the linkerd-web ingress does not by default use a TLS certificate to ensure that the connection to it is encrypted, as we will be sending passwords we want to ensure it is encrypted, to do which we need to create a TLS secret in Kubernetes that the ingress controller can use.
We will use step to help us here, it was installed when you did the cloud shell setup
1. Move to the directory containing the scripts for the service mesh lab
```bash
cd $HOME/helidon-kubernetes/service-mesh
```
2. In the OCI Cloud shell run the following.
```bash
$HOME/keys/step certificate create linkerd.$EXTERNAL_IP.nip.io tls-linkerd-$EXTERNAL_IP.crt tls-linkerd-$EXTERNAL_IP.key --profile leaf --not-after 8760h --no-password --insecure --kty=RSA --ca $HOME/keys/root.crt --ca-key $HOME/keys/root.key
```
```
Your certificate has been saved in tls-linkerd-123.456.789.123.crt.
Your private key has been saved in tls-linkerd-123.456.789.123.key.
```
(The above is example output, your files will be based on the IP you provided)
If your output says it's created key files like `tls-linkerd-.crt` and does not include the IP address then the `EXTERNAL_IP` variable is not set, please follow the instructions in Task 1 and re-run the step certificate creation command
3. Now let's put this in a Kubernetes TLS secret. In the OCI Cloud shell
```bash
kubectl create secret tls tls-linkerd --key tls-linkerd-$EXTERNAL_IP.key --cert tls-linkerd-$EXTERNAL_IP.crt -n linkerd-viz
```
### Task 5c: Create a login password to secure the connection
The default configuration for the linkerd-web service includes a password of admin/admin. Obviously this is for demo purposes, but we should use something more secure (and of course you **must** use a strong password in a production environment!)
First let's create a password file for the admin user. In the example below I'm using `ZaphodBeeblebrox` as the password, but please feel free to change this if you like
1. In the OCI Cloud Shell type
```bash
htpasswd -c -b auth admin ZaphodBeeblebrox
```
```
Adding password for user admin
```
Now having create the password file we need to add it to Kuberntes as a secret so the ingress controller can use it.
2. In the OCI Cloud Shell type
```bash
kubectl create secret generic web-ingress-auth -n linkerd-viz --from-file=auth
```
```
secret/web-ingress-auth created
```
### Task 5d: Creating an ingress rule to access the UI
We are now going to create the ingress rule. This is based on the example on the linkerd website, but with the following changes:
It does not define the web authentication secret in this yaml (we did that above)
If specifies the TLS secret we defined above so the connection is secure
Though these are not perfect they do ensure that users need to be authenticated and that their authentication details are protected by using an encrypted connection.
As with the base services because we are using a certificate with the DNS name embedded in it for the host we need to modify the ingress rules to add this. The script `set-ingress-ip.sh` will do this for us. Of course in a real production environment where you have a DNS entry pointing to the ingress controller and also a certificate using that name you would not have to do this, but for now in this lab we don't have the time to wait for that to be setup and the DNS updates to propagate.
1. In the OCI Cloud shell type
```bash
bash set-ingress-ip.sh $EXTERNAL_IP
```
2. Apply the ingress rule - in the OCI Cloud Shell type
```bash
kubectl apply -f ingressLinkerdRules-`kubectl config current-context`.yaml
```
```
ingress.networking.k8s.io/web-ingress created
```
Now you can go to the ingress ip address for the linkerd UI
3. In your laptop web browser go to `https://linkerd..nip.io` (Replace `` witrh the IP address of the load balancer)
You will probably be challenged as you have a self signed certificate.
4. In the browser, accept a self signed certificate. There are several way you may need to do this and they vary by browser and version. as of the time of writing (Sept 2020) the following worked using the browsers on MacOs
- In Safari you will be presented with a page saying "This Connection Is Not Private" Click the "Show details" button, then you will see a link titled `visit this website` click that, then click the `Visit Website` button on the confirmation pop-up. To update the security settings you may need to enter a password, use Touch ID or confirm using your Apple Watch.
- In Firefox once the security risk page is displayed click on the "Advanced" button, then on the "Accept Risk and Continue" button
- In Chrome once the "Your connection is not private" page is displayed click the advanced button, then you may see a link titled `Proceed to ....(unsafe)` click that.
We have had reports that some versions of Chrome will not allow you to override the page like this, for Chrome 83 at least one solution is to click in the browser window and type the words `thisisunsafe` (copy and past doesn't seem to work, you need to actually type it.) Alternatively use a different browser.
Next you will be presented with the login challenge. The image below was captured using Safari, different browsers have slightly different looks, but the basic content is the same.
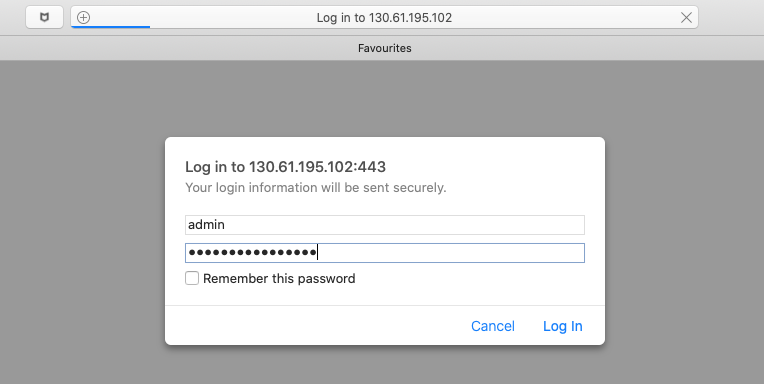
5. Login with `admin` as the username, for the password use the one you used when creating the login password above. Some browsers offer the change to remember the password details for later use. Feel free to do so if you like, or if you prefer you can re-enter the username and password when prompted by the browser.
You'll be presented with the linkerd-web main page
Let's also check you can access the grafana dashboard that's been installed by linkerd
6. In your web browser go to `https://linkerd..nip.io/grafana`(replace `` as usual) Note if you did not save the username / password details you may be prompted to re-enter them
I have found that for some versions of Firefox that grafana complains about reverse-proxy settings. You may find that you need to use chrome or safari to access the grafana page.
Other options for linkerd access
Exposing linkerd via an ingress allows anyone who has access to the external point of the ingress (and the password) to access it. This may be required due to the way your organization operates, but you can also restrict access to the linkerd UI by using the linkerd command to setup a secure tunnel for you.
You need to have the linkerd client installed on your machine.
On your local laptop (which must already be configured with the appropriate Kuberntes configuration and other credentials your provider may require)
- Open a terminal window and type
```bash
linkerd dashboard
```
```
Linkerd dashboard available at:
http://localhost:50750
Grafana dashboard available at:
http://localhost:50750/grafana
Opening Linkerd dashboard in the default browser
Failed to open Linkerd dashboard automatically
```
This will setup the tunnel for you. You can then access linkerd and the grafana environment using the url's above. Normally this command will open a web connection for you, but in this case I was using a remote terminal with no graphical desktop available, so running a web browser was not possible.
---
If you can't remember your namespace name
If you followed the lab instructions correctly your namespace should be named -helidon
To get a list of the available namespaces
- In the OC Cloud Shell type
```bash
kubectl get namespace
```
```
NAME STATUS AGE
default Active 36d
ingress-nginx Active 35d
kube-node-lease Active 36d
kube-public Active 36d
kube-system Active 36d
linkerd Active 7d2h
tg-helidon Active 35d
```
(This is the cluster I'm using to test the lab, so it's been running a while, the age reported in your example will probably be measured in hours, not days!)
---
</details>
We can use the linkerd command to add the annotations, first let's just see what it does
2. In the OCI Cloud shell type the following replacing `[ns-name]` with your namespace name
```bash
kubectl get namespace [ns-name] -o yaml | linkerd inject -
```
```yaml
apiVersion: v1
kind: Namespace
metadata:
annotations:
linkerd.io/inject: enabled
name: tg-helidon
resourceVersion: "239255"
selfLink: /api/v1/namespaces/tg-helidon
uid: c77e0d99-e3b4-42cc-ad87-881c245aadf3
spec:
finalizers:
- kubernetes
status:
phase: Active
---
namespace "tg-helidon" injected
```
You can see that there is now a annotations section with the annotation `linkerd.io/inject: enabled` (As before this is the output for my namespace)
The text `namespace "tg-helidon" injected` is just for information, it doesn't actually appear in the output (technically it's been sent to stderr, not stdout)
Let's have kubectl apply the change
3. In the OCI Cloud shell type the following replacing `[ns-name]` with your namespace name
```bash
kubectl get namespace [ns-name] -o yaml | linkerd inject - | kubectl replace -f -
```
```
namespace "tg-helidon" injected
namespace/tg-helidon configured
```
The first line of the output is from the linkerd command telling us that its added the annotation, the second is from the kubectl replace command telling us that the previous configuration has been replaced with the new one.
Let's have a look at the web page again, refresh the main web page in the browser
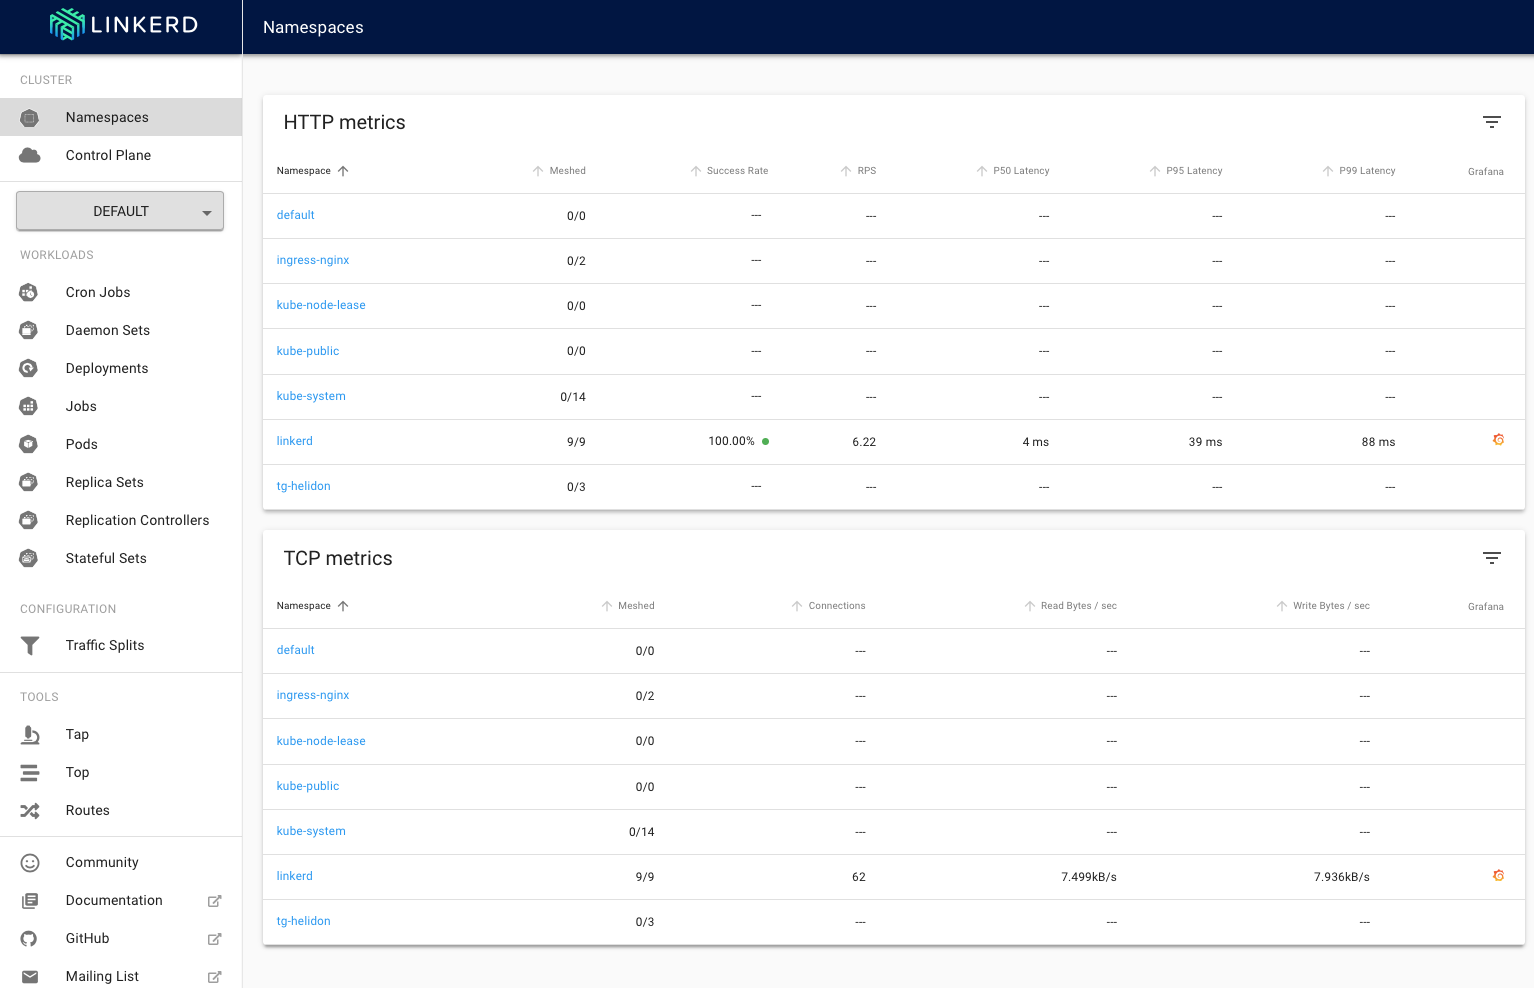
It doesn't look very different, and if you looked at the Grafana page that would still report it was only be monitoring one namespace. How come ? We added the annotation!
Well the reason for this is to do with the way a service mesh works.
The following diagram (from [buoyant.io](https://buoyant.io)) shows the components in the [linkerd](https://linkerd.io) service mesh

If you look at the data plane you can see what a pod looks like when the service mesh is enabled. In addition to the application containers in the pods you'll see there is also a container in the pod called `linkerd-proxy` This is a container that's automatically added to the pod for you when the pod is deployed. The proxy is what does the day to day activities of the service mesh as it intercepts the network traffic, does the metric counting, connection encryption and so on.
The linkerd control plane running in the cluster can intercept the request to create a pod and if the namespace has the `linkerd.io/inject` annotation set to `true` the control plane will automatically inject the proxy for to the pod configuration for us, this is good news as it means that we don't need to modify our configuration to add the proxy manually. There is of course a downside to this, because linkerd (and other service meshes) add the proxy when the pod is created then existing pods won't have that in place. If you want more details on how the injection process works there is info on the [Linkerd website automatic proxy injection page](https://linkerd.io/2/features/proxy-injection/)
We can of course delete and recreate the deployments which will restart the pods triggering the proxies to be added, but this is a bit drastic and will result in the service being unavailable for a short time, so we're going to use a different approach which is to restart the deployments as if we were doing a rolling upgrade, that way there will always be some pods running the service as it transitions (this feature was added in Kubernetes 1.15, if you have an older version you'll have to stop and restart the deployments)
Let's get the list of deplpyments
4. In the OCI Cloud shell type
```bash
kubectl get deployments
```
```
NAME READY UP-TO-DATE AVAILABLE AGE
stockmanager 1/1 1 1 14d
storefront 1/1 1 1 14d
zipkin 1/1 1 1 14d
```
We can see in this case we have deployments for stockmanager, storefront and zipkin. Depending on which other optional modules you've done there may be additional deployments in the list.
Sadly there doesn't seem to be a way to restart all of the deployments in a namespace (maybe that will be added in a future Kubernetes release) so we have to restart each one individually.
5. In the OCI Cloud shell type the following, if you have additional deployments from other optional modules in these labs add them to the list or re-run with the namespace for those deployments
```bash
kubectl rollout restart deployments storefront stockmanager zipkin
```
```
deployment.apps/storefront restarted
deployment.apps/stockmanager restarted
deployment.apps/zipkin restarted
```
What has actually been done to my pod ?
Restarting the pods triggered linkerd to do it's automatic update of the pod adding the proxy. It actually also added something called an `init container` which is a container that is run as the pod starts up. The init container actually re-writes the networking configuration in the main application pod to send all connections to the the proxy.
- In the OCI Cloud shell type the following
```bash
kubectl get pods
```
```
NAME READY STATUS RESTARTS AGE
stockmanager-654f44d59d-bjn2v 2/2 Running 0 7m55s
storefront-8ddc6db75-nxlnm 2/2 Running 0 7m55s
zipkin-84466dc99f-w5hhc 2/2 Running 0 7m55s
```
Note that pods have 2/2 in the READY column, this means that there are **two** containers running in the pod, previously would have seen 1/1 meaning only one container was running, (the application)
Let's see what's in those pods, here we're going to use the jsonpath ooption to kubectl to reduce the amount of output
- In the OCI Cloud shell (remember to substitute the pod name for your storefront!)
```bash
kubectl get pods storefront-8ddc6db75-nxlnm -o jsonpath='{.spec.containers[*].name}'`
```
```
storefront linkerd-proxy
```
The two containers are listed, the `storefront` application container and the `linkerd-proxy` container.
If you want so see all the detail on the pod (including the init container)
The following will generate a **lot** of output, you'll see it's **way** bigger than the yaml file you used to define the deployment!
- In the OCI Cloud shell (remember to substitute the pod name for your stockmanager!)
```
kubectl get pod stockmanager-654f44d59d-bjn2v -o yaml
```
```yaml
apiVersion: v1
kind: Pod
metadata:
annotations:
kubectl.kubernetes.io/restartedAt: "2020-05-21T17:27:41Z"
linkerd.io/created-by: linkerd/proxy-injector stable-2.7.1
linkerd.io/identity-mode: default
linkerd.io/proxy-version: stable-2.8.1
prometheus.io/path: /metrics
prometheus.io/port: "9081"
prometheus.io/scrape: "true"
creationTimestamp: "2020-05-21T17:27:41Z"
generateName: stockmanager-654f44d59d-
labels:
app: stockmanager
linkerd.io/control-plane-ns: linkerd
linkerd.io/proxy-deployment: stockmanager
pod-template-hash: 654f44d59d
name: stockmanager-654f44d59d-bjn2v
namespace: tg-helidon
ownerReferences:
- apiVersion: apps/v1
blockOwnerDeletion: true
controller: true
kind: ReplicaSet
name: stockmanager-654f44d59d
uid: 088909ae-deb5-401f-a0a1-c9b23dbeb40e
resourceVersion: "8437962"
selfLink: /api/v1/namespaces/tg-helidon/pods/stockmanager-654f44d59d-bjn2v
uid: 67957775-ca04-4e8b-a06e-5901f0042582
spec:
containers:
- image: fra.ocir.io/oractdemeabdmnative/h-k8s_repo/stockmanager:0.0.1
imagePullPolicy: IfNotPresent
name: stockmanager
ports:
- containerPort: 8081
name: service-port
protocol: TCP
- containerPort: 9081
name: health-port
protocol: TCP
resources:
limits:
cpu: 250m
requests:
cpu: 250m
terminationMessagePath: /dev/termination-log
terminationMessagePolicy: File
volumeMounts:
- mountPath: /conf
name: sm-config-map-vol
readOnly: true
- mountPath: /confsecure
name: sm-conf-secure-vol
readOnly: true
- mountPath: /Wallet_ATP
name: sm-wallet-atp
readOnly: true
- mountPath: /var/run/secrets/kubernetes.io/serviceaccount
name: default-token-t7mhn
readOnly: true
- env:
- name: LINKERD2_PROXY_LOG
value: warn,linkerd=info
- name: LINKERD2_PROXY_DESTINATION_SVC_ADDR
value: linkerd-dst.linkerd.svc.cluster.local:8086
- name: LINKERD2_PROXY_CONTROL_LISTEN_ADDR
value: 0.0.0.0:4190
- name: LINKERD2_PROXY_ADMIN_LISTEN_ADDR
value: 0.0.0.0:4191
- name: LINKERD2_PROXY_OUTBOUND_LISTEN_ADDR
value: 127.0.0.1:4140
- name: LINKERD2_PROXY_INBOUND_LISTEN_ADDR
value: 0.0.0.0:4143
- name: LINKERD2_PROXY_DESTINATION_GET_SUFFIXES
value: svc.cluster.local.
- name: LINKERD2_PROXY_DESTINATION_PROFILE_SUFFIXES
value: svc.cluster.local.
- name: LINKERD2_PROXY_INBOUND_ACCEPT_KEEPALIVE
value: 10000ms
- name: LINKERD2_PROXY_OUTBOUND_CONNECT_KEEPALIVE
value: 10000ms
- name: _pod_ns
valueFrom:
fieldRef:
apiVersion: v1
fieldPath: metadata.namespace
- name: LINKERD2_PROXY_DESTINATION_CONTEXT
value: ns:$(_pod_ns)
- name: LINKERD2_PROXY_IDENTITY_DIR
value: /var/run/linkerd/identity/end-entity
- name: LINKERD2_PROXY_IDENTITY_TRUST_ANCHORS
value: |
-----BEGIN CERTIFICATE-----
MIIBhDCCASmgAwIBAgIBATAKBggqhkjOPQQDAjApMScwJQYDVQQDEx5pZGVudGl0
eS5saW5rZXJkLmNsdXN0ZXIubG9jYWwwHhcNMjAwNTE0MTQwNDA2WhcNMjEwNTE0
MTQwNDI2WjApMScwJQYDVQQDEx5pZGVudGl0eS5saW5rZXJkLmNsdXN0ZXIubG9j
YWwwWTATBgcqhkjOPQIBBggqhkjOPQMBBwNCAAQISrJZ03NeTDRhTat47wIZ6jqJ
/7S3WhIIygaWcPHyWjAQMa/+l9KSa9OR34wK9NWx0TN4oDQpCea6Rx/IMB86o0Iw
QDAOBgNVHQ8BAf8EBAMCAQYwHQYDVR0lBBYwFAYIKwYBBQUHAwEGCCsGAQUFBwMC
MA8GA1UdEwEB/wQFMAMBAf8wCgYIKoZIzj0EAwIDSQAwRgIhAOovTGff057hl3bk
vnv5n6NatvY9oLEJdLfM1gRanRbEAiEAw2JD+BvfaS5skaQ/b1CRtYbtINO0Us0w
q3NkC2nqPHM=
-----END CERTIFICATE-----
- name: LINKERD2_PROXY_IDENTITY_TOKEN_FILE
value: /var/run/secrets/kubernetes.io/serviceaccount/token
- name: LINKERD2_PROXY_IDENTITY_SVC_ADDR
value: linkerd-identity.linkerd.svc.cluster.local:8080
- name: _pod_sa
valueFrom:
fieldRef:
apiVersion: v1
fieldPath: spec.serviceAccountName
- name: _l5d_ns
value: linkerd
- name: _l5d_trustdomain
value: cluster.local
- name: LINKERD2_PROXY_IDENTITY_LOCAL_NAME
value: $(_pod_sa).$(_pod_ns).serviceaccount.identity.$(_l5d_ns).$(_l5d_trustdomain)
- name: LINKERD2_PROXY_IDENTITY_SVC_NAME
value: linkerd-identity.$(_l5d_ns).serviceaccount.identity.$(_l5d_ns).$(_l5d_trustdomain)
- name: LINKERD2_PROXY_DESTINATION_SVC_NAME
value: linkerd-destination.$(_l5d_ns).serviceaccount.identity.$(_l5d_ns).$(_l5d_trustdomain)
- name: LINKERD2_PROXY_TAP_SVC_NAME
value: linkerd-tap.$(_l5d_ns).serviceaccount.identity.$(_l5d_ns).$(_l5d_trustdomain)
image: gcr.io/linkerd-io/proxy:stable-2.7.1
imagePullPolicy: IfNotPresent
livenessProbe:
failureThreshold: 3
httpGet:
path: /metrics
port: 4191
scheme: HTTP
initialDelaySeconds: 10
periodSeconds: 10
successThreshold: 1
timeoutSeconds: 1
name: linkerd-proxy
ports:
- containerPort: 4143
name: linkerd-proxy
protocol: TCP
- containerPort: 4191
name: linkerd-admin
protocol: TCP
readinessProbe:
failureThreshold: 3
httpGet:
path: /ready
port: 4191
scheme: HTTP
initialDelaySeconds: 2
periodSeconds: 10
successThreshold: 1
timeoutSeconds: 1
resources: {}
securityContext:
allowPrivilegeEscalation: false
readOnlyRootFilesystem: true
runAsUser: 2102
terminationMessagePath: /dev/termination-log
terminationMessagePolicy: FallbackToLogsOnError
volumeMounts:
- mountPath: /var/run/linkerd/identity/end-entity
name: linkerd-identity-end-entity
- mountPath: /var/run/secrets/kubernetes.io/serviceaccount
name: default-token-t7mhn
readOnly: true
dnsPolicy: ClusterFirst
enableServiceLinks: true
initContainers:
- args:
- --incoming-proxy-port
- "4143"
- --outgoing-proxy-port
- "4140"
- --proxy-uid
- "2102"
- --inbound-ports-to-ignore
- 4190,4191
image: gcr.io/linkerd-io/proxy-init:v1.3.2
imagePullPolicy: IfNotPresent
name: linkerd-init
resources:
limits:
cpu: 100m
memory: 50Mi
requests:
cpu: 10m
memory: 10Mi
securityContext:
allowPrivilegeEscalation: false
capabilities:
add:
- NET_ADMIN
- NET_RAW
privileged: false
readOnlyRootFilesystem: true
runAsNonRoot: false
runAsUser: 0
terminationMessagePath: /dev/termination-log
terminationMessagePolicy: FallbackToLogsOnError
volumeMounts:
- mountPath: /var/run/secrets/kubernetes.io/serviceaccount
name: default-token-t7mhn
readOnly: true
nodeName: 10.0.10.3
priority: 0
restartPolicy: Always
schedulerName: default-scheduler
securityContext: {}
serviceAccount: default
serviceAccountName: default
terminationGracePeriodSeconds: 30
tolerations:
- effect: NoExecute
key: node.kubernetes.io/not-ready
operator: Exists
tolerationSeconds: 300
- effect: NoExecute
key: node.kubernetes.io/unreachable
operator: Exists
tolerationSeconds: 300
volumes:
- configMap:
defaultMode: 420
name: sm-config-map
name: sm-config-map-vol
- name: sm-conf-secure-vol
secret:
defaultMode: 420
secretName: sm-conf-secure
- name: sm-wallet-atp
secret:
defaultMode: 420
secretName: sm-wallet-atp
- name: default-token-t7mhn
secret:
defaultMode: 420
secretName: default-token-t7mhn
- emptyDir:
medium: Memory
name: linkerd-identity-end-entity
status:
conditions:
- lastProbeTime: null
lastTransitionTime: "2020-05-21T17:27:44Z"
status: "True"
type: Initialized
- lastProbeTime: null
lastTransitionTime: "2020-05-21T17:27:48Z"
status: "True"
type: Ready
- lastProbeTime: null
lastTransitionTime: "2020-05-21T17:27:48Z"
status: "True"
type: ContainersReady
- lastProbeTime: null
lastTransitionTime: "2020-05-21T17:27:41Z"
status: "True"
type: PodScheduled
containerStatuses:
- containerID: docker://d8130bf907b4ae54206496125d14eafc590760b8ec26d8e05309f8e79c525cda
image: gcr.io/linkerd-io/proxy:stable-2.7.1
imageID: docker-pullable://gcr.io/linkerd-io/proxy@sha256:22af88a12d252f71a3aee148d32d727fe7161825cb4164776c04aa333a1dcd28
lastState: {}
name: linkerd-proxy
ready: true
restartCount: 0
state:
running:
startedAt: "2020-05-21T17:27:45Z"
- containerID: docker://513a84ab22bef8b3b425e1a074344373a4d53c2529540eed331341d3ed71a0a4
image: fra.ocir.io/oractdemeabdmnative/h-k8s_repo/stockmanager:0.0.1
imageID: docker-pullable://fra.ocir.io/oractdemeabdmnative/h-k8s_repo/stockmanager@sha256:5e6b0a6539e86cb9615faf3387a5924032f708737cfead227cb83d3d5cf53761
lastState: {}
name: stockmanager
ready: true
restartCount: 0
state:
running:
startedAt: "2020-05-21T17:27:44Z"
hostIP: 10.0.10.3
initContainerStatuses:
- containerID: docker://b3f8435a9c0d7c8cce343684a6e939c7cacef58a09fd55474faf7f59981e4d0e
image: gcr.io/linkerd-io/proxy-init:v1.3.2
imageID: docker-pullable://gcr.io/linkerd-io/proxy-init@sha256:e1d81404c653b8479df0316f68dfa0cbbb2c34f4e987483d4cb832a9b1d9cd0a
lastState: {}
name: linkerd-init
ready: true
restartCount: 0
state:
terminated:
containerID: docker://b3f8435a9c0d7c8cce343684a6e939c7cacef58a09fd55474faf7f59981e4d0e
exitCode: 0
finishedAt: "2020-05-21T17:27:44Z"
reason: Completed
startedAt: "2020-05-21T17:27:43Z"
phase: Running
podIP: 10.244.0.72
qosClass: Burstable
startTime: "2020-05-21T17:27:41Z"
```
---
How to check if $EXTERNAL_IP is set, and re-set it if it's not
**To check if `$EXTERNAL_IP` is set**
If you want to check if the variable is still set type `echo $EXTERNAL_IP` if it returns the IP address you're ready to go, if not then you'll need to re-set it.
**To get the external IP address if you no longer have it**
In the OCI Cloud shell type
```bash
kubectl --namespace ingress-nginx get services -o wide ingress-nginx-controller
```
```
NAME TYPE CLUSTER-IP EXTERNAL-IP PORT(S) AGE SELECTOR
ingress-nginx-controller LoadBalancer 10.96.61.56 132.145.235.17 80:31387/TCP,443:32404/TCP 45s app.kubernetes.io/component=controller,app.kubernetes.io/instance=ingress-nginx,app.kubernetes.io/name=ingress-nginx
```
The External IP of the Load Balancer connected to the ingresss controller is shown in the EXTERNAL-IP column.
**To set the variable again**
```bash
export EXTERNAL_IP=[External IP]
```
---