
Explore traffic splits with a Service mesh.
Self guided student - video introduction
This video is an introduction to the Service mesh traffic splits lab. Depending on your browser settings it may open in this tab / window or open a new one. Once you've watched it please return to this page to continue the labs.
[](https://youtu.be/ghANv-uM7Ec "Using the service mesh traffic split capability introduction video")
---
Introduction
This is one of the optional sets of Kubernetes labs
Estimated module duration 20 mins.
Objectives
This module shows how to use the Linkerd traffic split functionality to do a trial (canary) deployment of an update, and also to do some simple chaos engineering to see howthe system behaves if a component is unavailable.
Prerequisites
You need to complete the Rolling update module (last of the core Kubernetes labs modules). You must have completed the Installing the Linkerd service mesh module. You can have done any of the other optional module sets, or any combination of the other service mesh modules.
Task 1: What is a a traffic split, and what can I do with it ?
A traffic split is just what it says, the traffic sent to a service is split between the implementation instances. In core Kubernetes this is done using the selector in the service to locate pods with matching labels. Then traffic sent to the service is split between the different pods, often using a round robin approach so each pod responds in turn.
In a service mesh a traffic split can do the traditional Kubernetes round robin approach, but it can do a lot more. For example there could be two different versions of the service, with the service mesh sending a percentage of the traffic to the different versions. This is useful if for example you want to try out one of the versions to see if it produced better business results (called A/B testing) or maybe you want to try out a new version of your micro-service before fully rolling it out. By diverting a small percentage of the traffic to it you can find out in the real deployed environment if it has any faults or returns errors. If it does then the new version is abandoned and the traffic all goes to instances of the old version, but if the new version turns out to be more reliable than the old one then you complete the rollout process and switch entirely to the new version.
Some service mesh implementations even have the ability to examine the headers in the request and make traffic split decisions based on those. An example of this in use would be to test out a new micro-service version in the real live environment, but limiting it’s access to only requests with specific headers, thus a test team could deploy the new version, but the service mesh would only route the requests with that specific header to the new version. The rest of the environment would remain the same so the new version is being tested in the real production environment.
You can even use the traffic split to deliberately introduce faults to your environment to see how the system behaves, for example how well the upstream service handles bad result data, or even no response at all. This later function is part of a larger discipline called Chaos Engineering but we will look at a very small part of it here.
Note that in a lot of these cases you use additional external automation tools to manage the service mesh traffic split (and to use it’s monitoring) to adjust the traffic split.
This module was written using the information in the Linkerd fault injection page.
Task 2: Canary deployments with a service mesh traffic split
Task 2a: What is a canary deployment ?
A canary deployment is a method of doing a small trial deployment, operating within the overall production infrastructure, and if the trial works you can expand it, if the trial deployment fails then it can be removed.
Why the term canary ?
Historically canaries were used in underground mines as they were far more sensitive to dangerous atmospheric contaminants than humans, and mines frequently had pockets of carbon monoxide, as well other dangerous or explosive gases lik methane. The miners would carry a canary in a cage (or a [canary resucitator](https://blog.scienceandindustrymuseum.org.uk/canary-resuscitator/)) with them, sometimes at the end of a long pole carried before them, so the canary went first. If the canary remained well then in went the humans. If however the canary became unwell then the humans knew it was not safe for them to proceed, and exited the area (one hopes taking the canary with them!)
---
Task 2b: What are we going to do ?
In this lab we are going to go through the process of manually performing a canary deployment, along with recovering it. We’re doing this manually so you get the full details of what’s happening, however normally you would use automated tools like Flagger or Spinaker to actually perform the steps for you (and at a much finer granularity)
We are going to deploy a version of the stockmanager service that deliberately breaks sometimes, from this you can gather than we will not be completing the deployment, but rolling it back!
More importantly we are going to do this while keeping the stockmanager service online all the time.
Task 2c: Identifying the deployments
The order here is important, this is because the basic stockmanager service is only looking for deployments which match the selector of app: stockmanager, so if we were to just roll out the new version then the service would match the old and new versions. To do that we need a way to identify the different versions of a dpeloyment
Let’s switch to the right directory
- In the OCI Cloud Shell type
<copy>cd $HOME/helidon-kubernetes/service-mesh</copy>
First we need to make a small change to our existing stock manager deployment, adding the version number to the deployment, this will let us differentiate it from the newer version we are about to deploy.
The file stockmanager-deployment-v0.0.1.yaml is our “standard deployment file which we have used in other modules, it just has additional version attributes for the spec.selector.matchLabels and spec.template.metadata.labels sections as shown below
  selector:
    matchLabels:
      app: stockmanager
      version: 0.0.1
  strategy:
    rollingUpdate:
      maxSurge: 1
      maxUnavailable: 1
    type: RollingUpdate
  template:
    metadata:
      annotations:
        prometheus.io/path: /metrics
        prometheus.io/port: "9081"
        prometheus.io/scrape: "true"
      creationTimestamp: null
      labels:
        app: stockmanager
        version: 0.0.1
    spec:
      containers:
Unfortunately since Kubernetes 1.17 we cannot just change the labels by updating the deployment with the new configuration as the labels for a deployment are set when it’s created, so we’ll have to delete and re-apply it.
- Let’s remove the old deployment. In the OCI Cloud shell type
<copy>kubectl delete deployment stockmanager</copy>
deployment/stockmanager: deleted
- And create the new one. In the OCI Cloud Shell type
<copy>kubectl apply -f stockmanager-deployment-v0.0.1.yaml</copy>
deployment.apps/stockmanager created
If we have a look at the pods we’ll see that the stockmanager deployment has been restarted, and it’s a new pod
- In the OCI Cloud shell type
<copy>kubectl get pods</copy>
NAME                             READY   STATUS    RESTARTS   AGE
stockmanager-7cbf798cd9-tdk5h    2/2     Running   0          5m48s
storefront-7667fc5fdc-5zwbr      2/2     Running   0          22h
zipkin-7db7558998-c5b5j          2/2     Running   0          22h
Let’s make sure our service is still running (note that we haven’t changed the service itself, it’s selector will match the old and new versions of the pod)
If your cloud shell session is new or has been restarted then the shell variable $EXTERNAL_IP may be invalid, expand this section if you think this may be the case to check and reset it if needed.
How to check if $EXTERNAL_IP is set, and re-set it if it's not
**To check if `$EXTERNAL_IP` is set**
If you want to check if the variable is still set type `echo $EXTERNAL_IP` if it returns the IP address you're ready to go, if not then you'll need to re-set it, there are a couple of ways to do this, expand the appropriate section below.
If you used the automated scripts in the kubernetes-lab directory to setup the microservices in Kubernetes
- Open the OCI cloud shell
The automated scripts will create a script file `$HOME/clusterSettings.one` this can be executed using the shell built in `source` to set the EXTERNAL_IP variable for you.
```bash
source $HOME/clusterSettings.one
```
```
EXTERNAL_IP set to 139.185.45.98
NAMESPACE set to tg
```
Of course the actual IP address and namespace will almost certainly be different from the example here !
---
If you manually setup the Kubernetes ingress services using helm
In this case as you manually set this up you will need to get the information from Kubernetes itself
- Open the OCI cloud shell
- You are going to get the value of the `EXTERNAL_IP` for your environment. This is used to identify the DNS name used by an incoming connection. In the OCI cloud shell type
```bash
kubectl get services -n ingress-nginx
```
```
NAME TYPE CLUSTER-IP EXTERNAL-IP PORT(S) AGE
ingress-nginx-controller LoadBalancer 10.96.182.204 130.162.40.241 80:31834/TCP,443:31118/TCP 2h
ingress-nginx-controller-admission ClusterIP 10.96.216.33 443/TCP 2h
```
- Look for the `ingress-nginx-controller` line and note the IP address in the `EXTERNAL-IP` column, in this case that's `130.162.40.121` but it's almost certain that the IP address you have will differ. IMPORTANT, be sure to use the IP in the `EXTERNAL-IP` column, ignore anything that looks like an IP address in any other column as those are internal to the OKE cluster and not used externally.
- IN the OCI CLoud shell type the following, replacing `[external ip]` with the IP address you retrieved above.
```bash
export EXTERNAL_IP=[external ip]
```
---
</details>
</details>
5. In the OCI Cloud shell type the following
```bash
curl -i -k -u jack:password https://store.$EXTERNAL_IP.nip.io/store/stocklevel
```
```
HTTP/2 200
server: nginx/1.17.8
date: Thu, 04 Jun 2020 16:38:55 GMT
content-type: application/json
content-length: 149
strict-transport-security: max-age=15724800; includeSubDomains
[{"itemCount":410,"itemName":"Pencil"},{"itemCount":50,"itemName":"Eraser"},{"itemCount":4490,"itemName":"Pins"},{"itemCount":100,"itemName":"Book"}]
```
As the pod has restarted you may have a delay or have to retry the request as the database connection is established.
If you get a DNS error that `store..nip.io` cannot be found this means that `EXTERNAL_IP` is not set, follow the instructions above to set it and then re-run the curl command.
### Task 2d: Create versioned services
Now we have a mechanism to differentiate between the 0.0.1 and future versions of the deployment we're going to create two new service definitions, one having a selector that matches the 0.0.1 version of the stockmanager service we just deployed, and one for the 0.0.2 version - we haven't actually deployed the 0.0.2 version yet, that comes later.
We need to do define the version based services now so we can create the traffic split that interposes itself between the original service (stockmanager) and the separate deployments. Remember that the original stockmanager service definition only has a selector for the label `app: stockmanager` so if we created the deployments before we put the traffic split in place the original stockmanager service would match both the old and new deployments and we wouldn't have any control over the traffic. Because of this the traffic split which used versions of services to differentiate and target traffic couldn't be deployed before we've created the per version services.
The versioned services are defined in a couple of yaml files. The key differences are that their selectors mean they are bound to specific versions of the deployment. This means that the selector specifies the version to match. Our previous service (which is still running) allowed connections to any version of the service as it didn't select using the version.
```yaml
apiVersion: v1
kind: Service
metadata:
name: stockmanagerv0-0-2
spec:
type: ClusterIP
selector:
app: stockmanager
version: 0.0.2
ports:
- name: stockmanager
protocol: TCP
port: 8081
- name: stockmanager-mgt
protocol: TCP
port: 9081
```
1. Let's deploy the 0.0.1 service version - this has a service name stockmanagerv0-0-1 (we have to use use `-` because the service name is used by Kubernetes as part of it's internal DNS setup, and of course a `.` represents a break point in the DNS naming scheme). In the OCI Cloud shell type the following
```bash
kubectl apply -f stockmanager-v0.0.1-service.yaml
```
```
service/stockmanagerv0-0-1 created
```
2. And the 0.0.2 service version - nor surprisingly this has a service name stockmanagerv0-0-2. In the OCI CLoud shell type the following
```bash
kubectl apply -f stockmanager-v0.0.2-service.yaml
```
```
service/stockmanagerv0-0-2 created
```
**For demonstration purposes only** I have supplied a couple of ingress configurations that will let us see the difference between the two versions. In a normal canary deployment you would **not** do this, but in the lab it helps make clear what's happening. When we installed Linkerd and the ingress rule for it's UI we ran a script that set the IP address of the host and certificate all the other ingress rules files, so we don't need to update it this time.
3. In the OCI CLoud shell type the following
```bash
kubectl apply -f ingressStockmanagerCanaryRules.yaml
```
```
ingress.networking.k8s.io/stockmanager-canary-ingress created
```
These ingress rules connect to the versioned services, not the original stockmanager which does not have a version in it's selector
4. Let's check them out. Firstly the 0.0.1 specific version. In the OCI CLoud shell type the following
```bash
curl -i -k -u jack:password https://store.$EXTERNAL_IP.nip.io/stockmanagerv0-0-1/stocklevel
```
```
HTTP/2 200
server: nginx/1.17.8
date: Thu, 04 Jun 2020 17:06:41 GMT
content-type: application/json
content-length: 149
strict-transport-security: max-age=15724800; includeSubDomains
[{"itemCount":410,"itemName":"Pencil"},{"itemCount":50,"itemName":"Eraser"},{"itemCount":4490,"itemName":"Pins"},{"itemCount":100,"itemName":"Book"}]
```
Accessing the 0.0.1 version the ingress connects to the 0.0.1 service which has the 0.0.1 version of the pods in it's selector. As we earlier updated the existing deployment with this there is a active set of pods behind it and we get results as we'd expect
5. Now let's try the 0.0.2 version (expect an error)
```bash
curl -i -k -u jack:password https://store.$EXTERNAL_IP.nip.io/stockmanagerv0-0-2/stocklevel
```
```
HTTP/2 503
server: nginx/1.17.8
date: Thu, 04 Jun 2020 17:06:47 GMT
content-type: text/html
content-length: 197
strict-transport-security: max-age=15724800; includeSubDomains
503 Service Temporarily Unavailable
503 Service Temporarily Unavailable
nginx/1.17.8
```
For the 0.0.2 version we get a 503 - Service Unavailable response. The ingress controller can map to the 0.0.2 service, but the 0.0.2 service has a selector which is looking for pods with a label `version: 0.0.2` and so far we haven't created any of those.
### Task 2e: Creating the traffic split
Now we have to create the traffic split. We need to do this before creating the 0.0.2 deployment because the original (un-versioned) stockmanager service is still running and being used by the storefront. The original service has a selector that will match on **any** pod with the label `app: stockmanager` **regardless** of what the version it is. Once the traffic split is in place it will intercept traffic for the original service, so only after that is it safe to create the new deployments and still retain full control of the traffic.
We are going to deploy our split on the service `stockmanager` (In service mesh terms this is known as the `Apex Service` as it's the actual top level service) The traffic split will intercept any traffic sent to the `stockmanager` service and split it between the backend services (also known as `Leaf services`) it specifies - in this case the `stockmanagerv0-0-1` service and the `stockmanagerv0-0-2` service. The example we are using here has two backends, but of course you can have more if you need to.
As we can see below, that breakdown sends all the traffic to the v0.0.1 version and none to the v0.0.2 version, we need to do this because we haven't setup any pods for the 0.0.2 service yet, so it couldn't respond to requests.
```yaml
apiVersion: split.smi-spec.io/v1alpha1
kind: TrafficSplit
metadata:
name: stockmanager-canary
spec:
service: stockmanager
backends:
- service: stockmanagerv0-0-1
weight: 90
- service: stockmanagerv0-0-2
weight: 0
```
How are the weights applied to the split ?
In this example we have applied a weight of 90 to the v0.0.1 part of the split, and zero to the second. The numbers are not percentages, and don't even need to add up to 100.
The algorithm seems to be add the total of the weights together, then split based on the weight for each individual backend divided by the total of the weights.
Thus with two services a weight of 1 on each would still be a 50/50 split (in percentage terms) but a split of 1 and 4 would be 20% to the first services and 80% to the second.
By having a weight of 0 on the 0.0.2 split it means that no requests will be sent to it.
---
Why won't I get a timeout ?
The `@Timeout` annotation is actually on the storefront class, it will trigger if the stockmanager takes a while to respond. The Ingress rule on the `/stockmanagerv0-0-2/stocklevel` path goes direct to the stockmanager service, this does not have any timeouts set.
---
How to get and set $EXTERNAL_IP
**To get the external IP address if you no longer have it**
In the OCI Cloud shell type
```bash
kubectl --namespace ingress-nginx get services -o wide ingress-nginx-controller
```
```
NAME TYPE CLUSTER-IP EXTERNAL-IP PORT(S) AGE SELECTOR
ingress-nginx-controller LoadBalancer 10.96.61.56 132.145.235.17 80:31387/TCP,443:32404/TCP 45s app.kubernetes.io/component=controller,app.kubernetes.io/instance=ingress-nginx,app.kubernetes.io/name=ingress-nginx
```
The External IP of the Load Balancer connected to the ingresss controller is shown in the EXTERNAL-IP column.
```bash
export EXTERNAL_IP=[External IP]
```
---
If you need to remind yourself of your ingress controller external IP address
- In the OCI Cloud Shell type :
```bash
kubectl get services -n ingress-nginx
```
```
NAME TYPE CLUSTER-IP EXTERNAL-IP PORT(S) AGE
ingress-nginx-nginx-ingress-controller LoadBalancer 10.96.196.6 130.61.195.102 80:31969/TCP,443:31302/TCP 3h
ingress-nginx-nginx-ingress-default-backend ClusterIP 10.96.17.121 80/TCP 3h
```
look at the `ingress-nginx-nginx-ingress-controller` row, IP address in the `EXTERNAL-IP` column is the one you want, in this case that's `130.61.195.102` **but yours will vary**
---
</details>
Locate your namespace on the list, you'll see that it's running fine with 100% success rate

9. Click on your namespace name (`tg-helidon` in my case)
10. On the left menu click on **Traffic Splits**
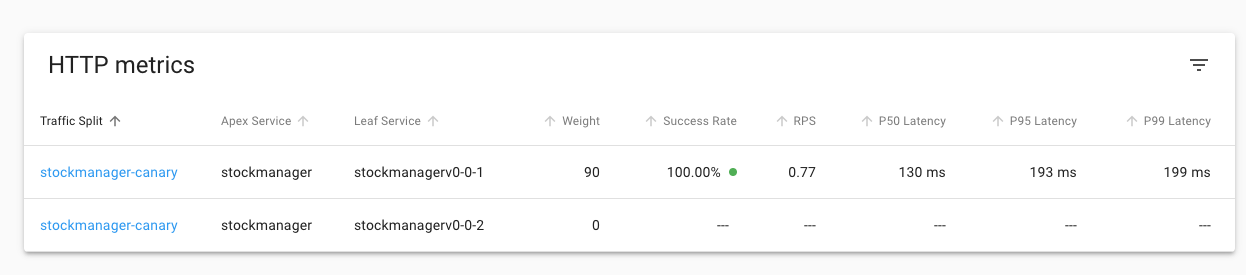
As you'd expect we can see all the traffic is going to the 0.0.1 version and it's all successful. Keep this page open
### Task 2f: Sending data to our new service
At the moment we're sending the data to the 0.0.1 service, but now we want to start sending some date to a 0.0.2 version and see how well it does.
Let's adjust the split
1. In the OCI Cloud shell type
```bash
kubectl edit trafficsplit stockmanager-canary
```
2. Go down to the backends section and for the service stockmanagerv-0-0-2 change the weight to 10
The result will look like this (the order of the elements may vary)
```yaml
service: stockmanager
backends:
- service: stockmanagerv0-0-1
weight: 90
- service: stockmanagerv0-0-2
weight: 10
```
3. Save the file
```
trafficsplit.split.smi-spec.io/stockmanager-canary edited
```
4. Go back to the traffic split on the linkerd browser page
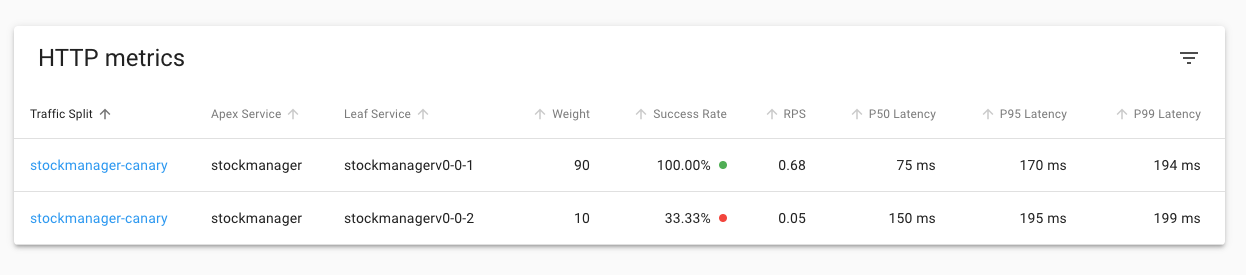
You will see that the split is now 90 to the v0.0.1 stockmanager and 10% to the v0.0.2 stock manager. As only 10% of the requests are going to the 0.0.2 version it may take a short while for data to be displayed for it.
The success rate column for the v0.0.1 is still 100%, but in this case the success rate for the 0.0.2 version is 33.33% Of course the exact number will vary depending on how many requests have been sent to it and the random behavior of it it generates an error or not. Given that the load generator is set to send one request a second, that only 10% of those are being sent to our test v0.0.2 service, and it only errors half the time only about 5% of the requests will actually have an error - so you may have to wait a bit to short time before seeing any errors. Also it can take a bit of time for the statistics to propagate up to the UI.
5. Click on **Namespaces**
6. In the HTTP Metrics list click on **your** namespace
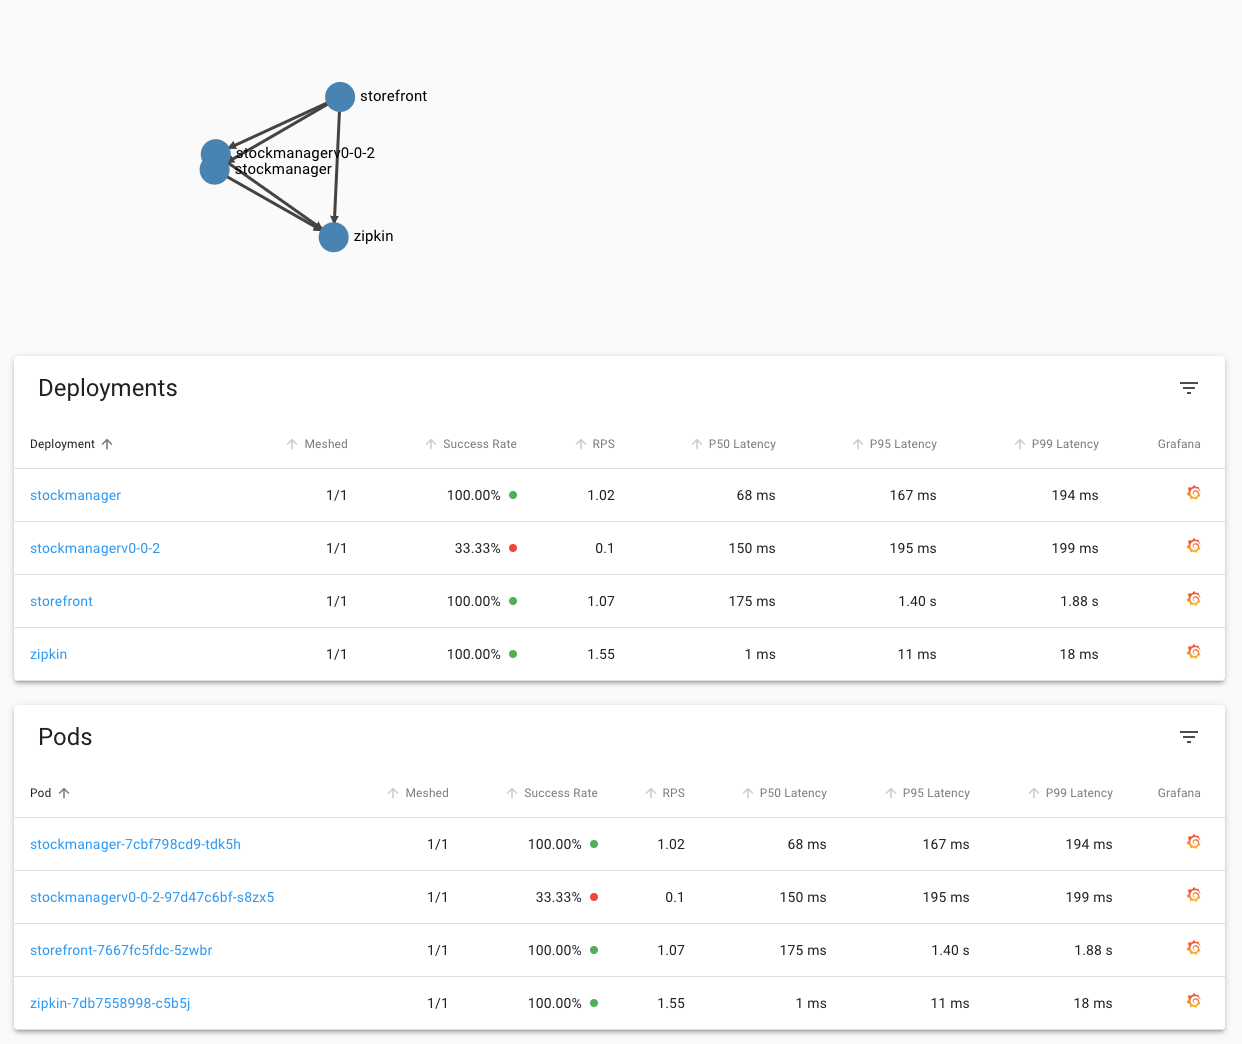
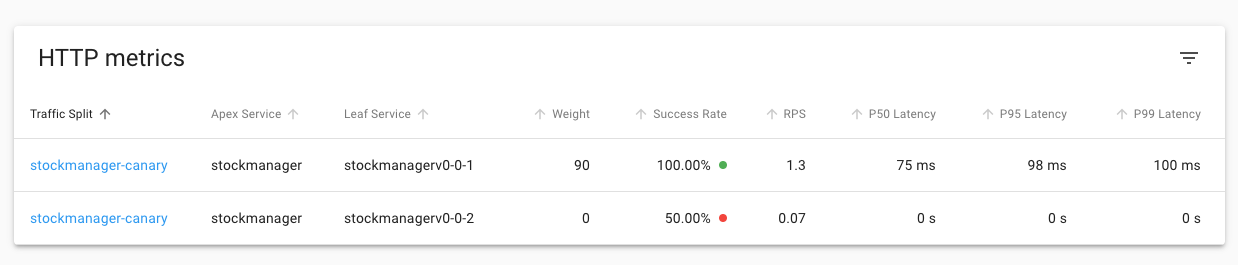
We can see that **in this case** the stockmanagerv0-0-2 deployment is still showing 33.33% success rate (yours may of course vary)
Basically this is a pretty significant indication that our updated deployment has a problem, and should not be deployed in production! Of course this is somewhat artificial, it may be that in production your original service generates a few errors normally, and the new one is marginally better, and unless the results were very clear cut like this you'd probably monitor it for a while.
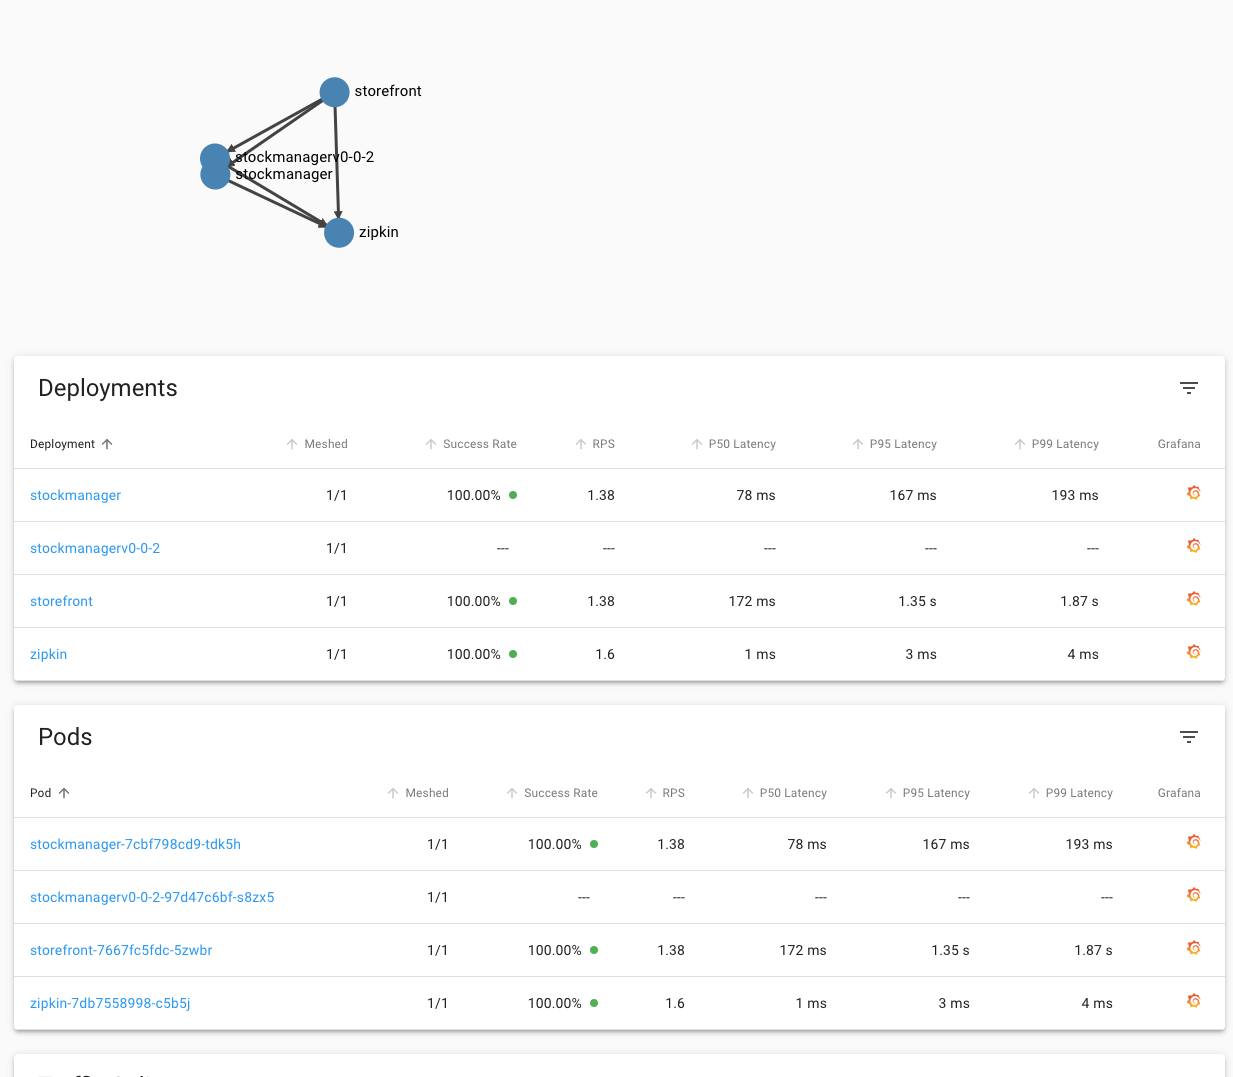
If you look at the top of the page you can also see the traffic flows in the namespace as a graph, as you would expect the flow out of the storefront to **both** versions of the stockmanager.
Of course all the time we've been doing this the requests have still been serviced, even if a small number have been failing.
Once you've finished looking at the split we need to stop the load generator
7. In the OCI cloud shell where you are running the load balancer stop the generator using Control-C
### Task 2g: It's failed, but what if it had worked ?
Of course we know that this example will fail - that's the point of this part of the lab, so the deployment woudl not continue in this case. But if it had worked then you would gradually adjust the traffic split, over time sending more traffic to the new deployment. Once it was taking all of the load then you could remove the deployment for the old version, and the associated service.
You **might** delete the traffic split (so requests to the stockmanager service were no longer being intercepted) or you might leave it in place, but remove the old version of the service. That way you would have all of the building blocks in place to easily start testing the next version of the service.
During this entire time period the overall stockmanager service would still have been operating, servicing requests (even if a few of the requests had had problems).
Remember, we've been doing this as a **manual** process to show you what's actually happening, in most cases where you have a CI/CD pipeline you'd use automation to manage the canary process, and it would perform the steps needed to completely switch to the new version automatically.
### Task 2h : We've discovered the new version is broken, what to do ?
Well obviously in the short term we don't want a broken version of the service if we have a working one, so the absolute first thing we need to do is to remove the new version from the traffic-split
1. In the OCI Cloud shell type
```bash
kubectl edit trafficsplit stockmanager-canary
```
2. Go down to the backends section and for the service stockmanagerv-0-0-2 change the weight to 0
The result will look like this (the order of the elements may vary)
```yaml
service: stockmanager
backends:
- service: stockmanagerv0-0-1
weight: 90
- service: stockmanagerv0-0-2
weight: 0
```
3. Save the file which will update the traffic split
```
trafficsplit.split.smi-spec.io/stockmanager-canary edited
```
If you look at the traffic split now you'll find that it's reverted to all the traffic being sent to the working version
Of course it will take a short while for the statistics to catch up (**in this case** we're seeing the results of old traffic showing up in the numbers for the 0.0.2 version, which is why it shows 50% failures, even though the weight is zero) but after a short while if you go to the namespaces list you'll see everything back to 100% Success for your namespace
4. In the linkerd UI click **Namespaces** on the upper left
5. Click **your** namespace in the HTTP Metrics section
#### Following actions
Remember, we've been doing this as a **manual** process to show you what's actually happening, your CI/CD tooling would normally handle this for you automatically.
Now there are lot's of actions you can take, what **we** are going to do soon is reset everything back to where it was prior to doing the canary split (so other lab modules have a common starting point) But in practice you are unlikely to do this.
Another option is if you have some idea as to the cause of the fault and can fix it quickly, in that case you'd probably create a new image and re-deploy it, that way you'd just need to update the traffic split to start sending some traffic to the updated "new" version.
### Task 2i: Resetting to our initial state
In this case (and this is probably what the CI/CD connected automation would do) we'll just remove everything. You do of course need to do this in the right order, or there may be a short period where the original stockmanager service would map onto both the old and new versions (and thus the new broken version may be sent requests).
I've put a small a script in place to do this for us
1. In the OCI Cloud Shell type
```bash
bash stop-canary.sh
```
```
deployment.apps "stockmanagerv0-0-2" deleted
trafficsplit.split.smi-spec.io "stockmanager-canary" deleted
ingress.networking.k8s.io "stockmanager-v0-0-1" deleted
ingress.networking.k8s.io "stockmanager-v0-0-2" deleted
service "stockmanagerv0-0-2" deleted
service "stockmanagerv0-0-1" deleted
```
We haven't removed the version on the original deployment ?
Well spotted! We're going to leave the version in place on the original service. There are a few reasons for this.
1/ It does no harm, the original service will match any deployment as it only looks for the `app: stockmanger` so will sent traffic to any matching deployment regardless of the deployments version attributes
2/ It's actually a good idea to specify version information as standard.
3/ It lets you quickly and easily see which version you're dealing with, and also makes it easier to implement traffic splits in the future (if you wished to do so) as the version info is already in place.
---
504 Gateway Time-out
nginx/1.19.0
```
OK, the 504 / Gateway Time-out response is generated as we expect.
### Task 3b: Deploy the traffic split
So far all we've done is to create a service that generates 504 errors, not much use by itself! We need to look at the traffic split to redirect some of the traffic for the original service to this new one.
Let's look at the traffic split, below is the contents of fault-injector-traffic-split.yaml
```yaml
apiVersion: split.smi-spec.io/v1alpha1
kind: TrafficSplit
metadata:
name: fault-injector
spec:
service: zipkin
backends:
- service: zipkin
weight: 50
- service: fault-injector-zipkin
weight: 50
```
The weight indicates how many requests of the service should go to each backend, so in this example we have a 50% split between fault and working, normally you would have a lower number of requests being sent to the fault-injector (after all, if it does break things you don't want your end customers to be impacted, especially in a production environment if you wern't sure what would happen, but here we want to be confident we'll see some "failures" generated.
OK, now we know what it is let's deploy it.
1. In the OCI Cloud shell type
```bash
kubectl apply -f fault-injector-traffic-split.yaml
```
```
trafficsplit.split.smi-spec.io/fault-injector-split created
```
Let's look at the traffic split in the linkerd UI
2. In your web browser go to `https://linkerd..nip.io` (replace `External IP` with the IP address of the load balancer as usual)
3. On the upper left click the **Namespace dropdown** (It may display `DEFAULT` or another namespace name)
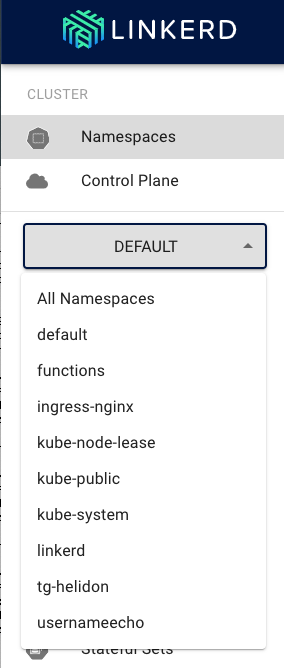
4. Click **your namespace** in the list (tg-helidon in my case, but yours should be different)
5. On the left menu in the configuration section click **Traffic Splits**
You will be shown the traffic splits page
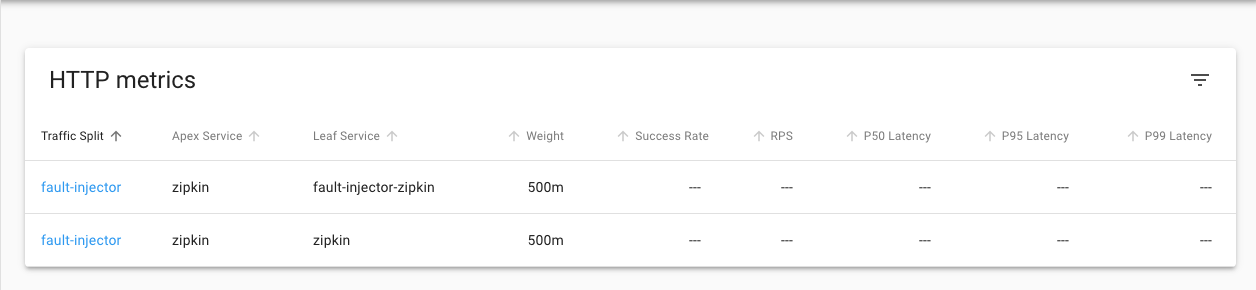
This Shows the traffic split details
6. Click on the name of the traffic-split `fault-injector`
We can see the details of the traffic split, the **Apex Service** indicates the service the traffic split is operating on, the **Leaf service** shows where the traffic will be split to and the **Weight** indicates the probability of that split option, in this case it's 500/1000 in each case. Of course you could potentially have additional splits.
Keep this page open
### Task 3c: Testing what happens
Let's generate some requests to see what happens
1. In the OCI Cloud Shell type the following
```bash
curl -i -k -u jack:password https://store.$EXTERNAL_IP.nip.io/store/stocklevel
```
```
HTTP/2 200
server: nginx/1.17.8
date: Wed, 03 Jun 2020 18:38:20 GMT
content-type: application/json
content-length: 149
strict-transport-security: max-age=15724800; includeSubDomains
[{"itemCount":410,"itemName":"Pencil"},{"itemCount":50,"itemName":"Eraser"},{"itemCount":4490,"itemName":"Pins"},{"itemCount":100,"itemName":"Book"}]
```
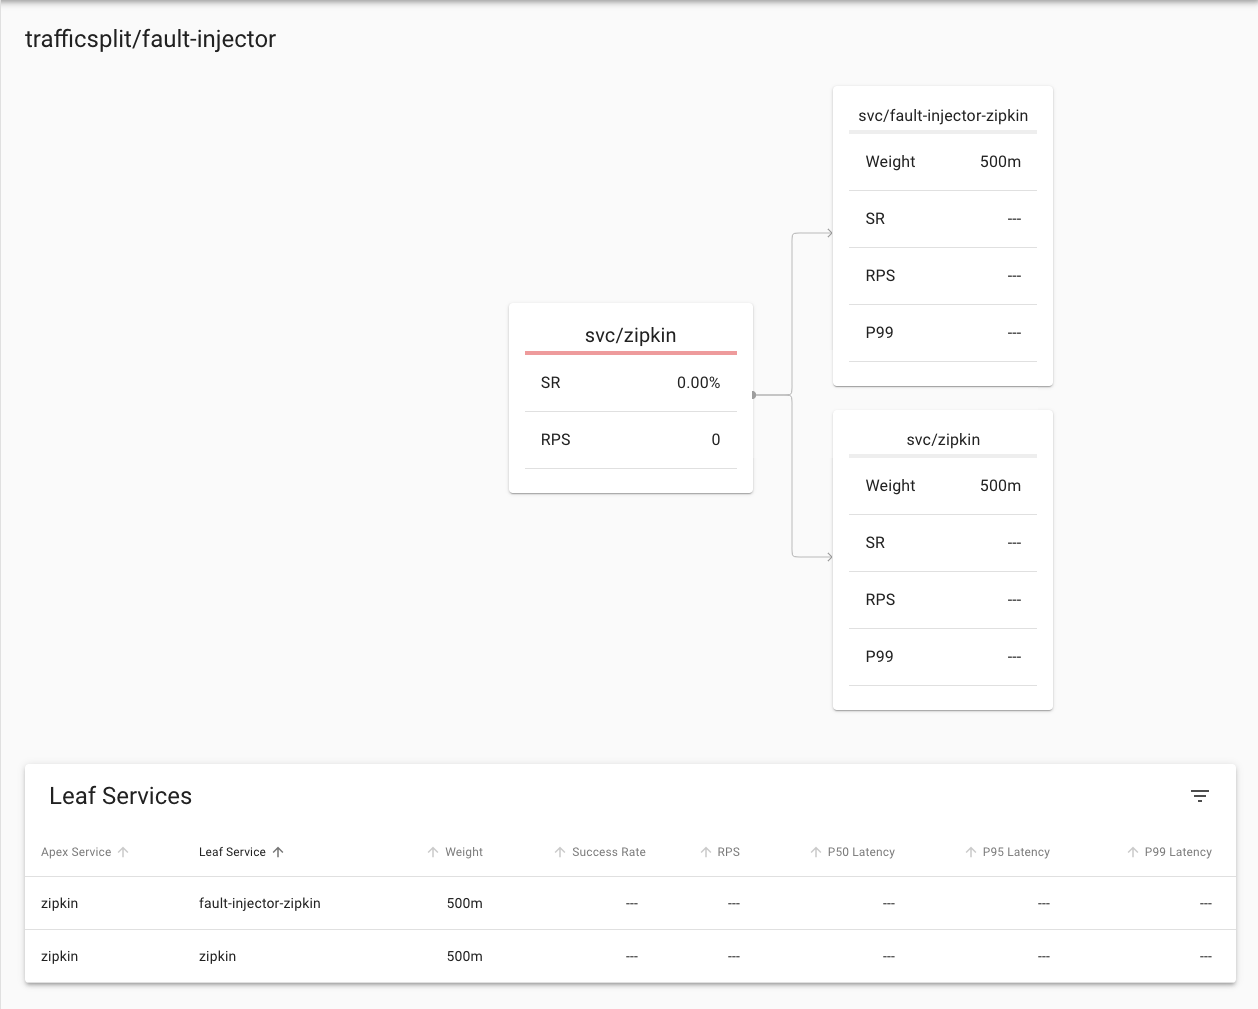
Well the good news is that we got a result, assuming that our requests were randomly assigned to the faulty zipkin sertvice it seems that having a faulty zipkin service does not immediately break the services that depend on it ! Make a few more requests - just in case the first request was assigned to the "good" zipkin (we want it to have a chance to hit the bad one), then return to your web browser (hopefully you left it on the details page of the fault-injection traffic split)
Below is what **I** saw, and it seems that **in this case** the random number generator means that the few requests I made to the traffic split that was connected to the origional zipkin service had all been passed to fault-injector-zipkin which of course failed them all.
**Yours may be different** You may see a partial split where some succeeded and some failed (so some going to the `zipkin` and some going to `fault-injector-zipkin`), of you may see them all succeeding (I.e. all going to the `zipkin` service) as the traffic split works randomly it's impossible to predict exactly
In this case you can see that requests to the fault-injection traffic split had a 0% success rate, and were passed to the failt-injector-zipkin service which had a 0% success rate. Of course your numbers may vary and it's unlikely you'll have all traffic going to the fault injector as I had here
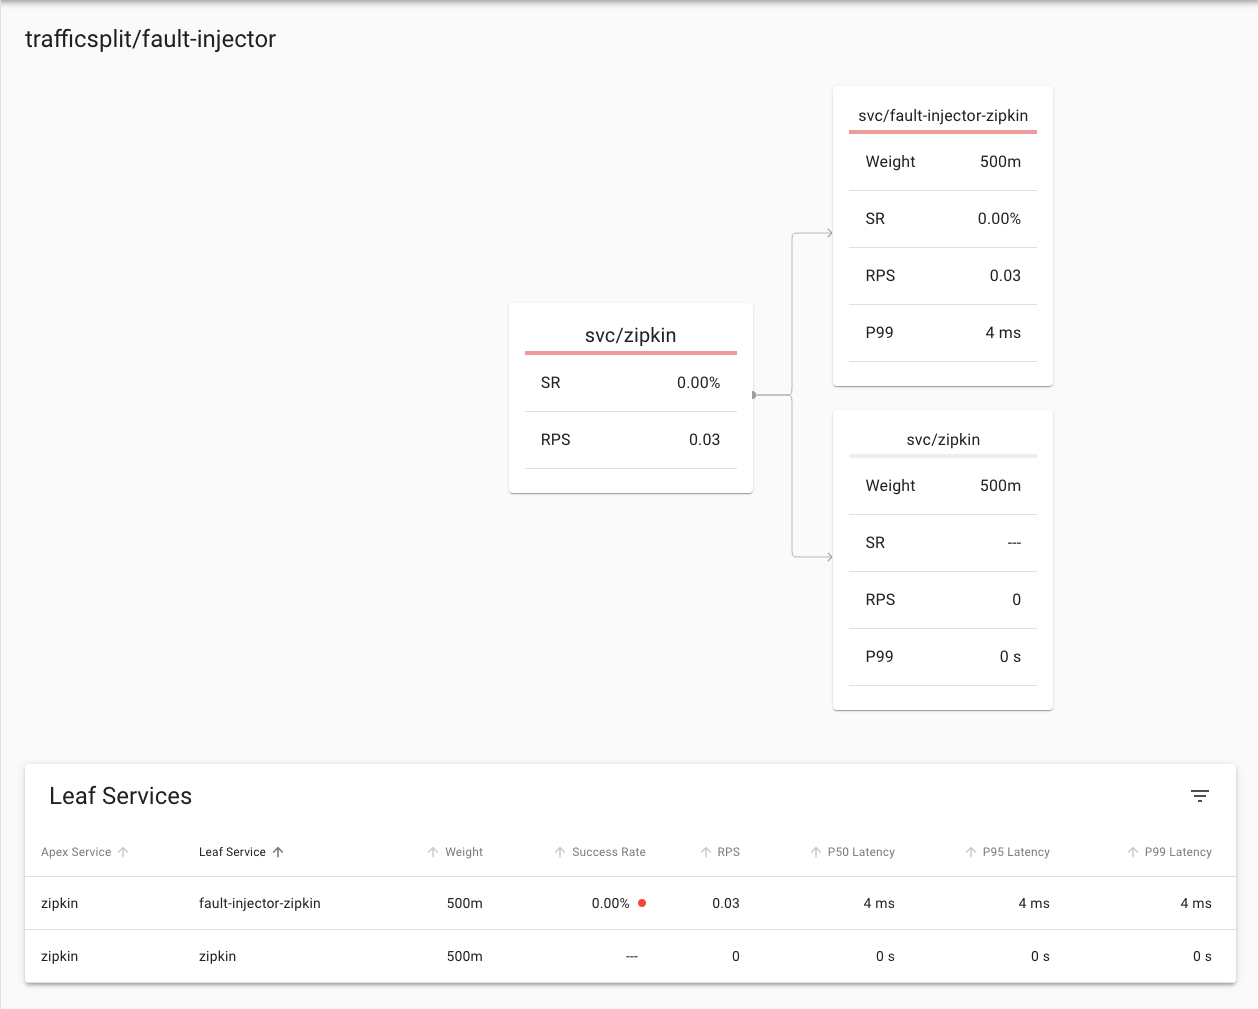
So I can show you what it looks like if there are only some failures I made a few more curl requests and came back to the page
**Again yours will almost certainly be different**
Here we see that 66.67% of the requests to the traffic split had failed (the bar at the top of the service also indicates the failure rate) and that 100% of the requests to zipkin had succeeded, while 100% of the requests to the fault-injector-zipkin service had failed. In this case given the fault-injector-zipkin service will always fail this is what we would expect, but as you'll see later when we look at canary deployments it's not a pure 100% success or failure in all cases.
Of course this is useful, but in this case all it's telling us is that the `zipkin` service always works and the `fault-injector-zipkin` service always fails. What does that mean for the requests to the zipkin service.
2. In the **Tools** section on the left menu click on **Routes**
3. In the **Namespace dropdown** chose the name of **your** namespace (tg-helidon in the example below)
4. In the **Resource** dropdown chose **Deployment**
5. In the **To Namespace** dropdown chose the name of **your** namespace (tg-helidon in the example below)
6. In the **To resource** dropdown chose `deployment/zipkin`
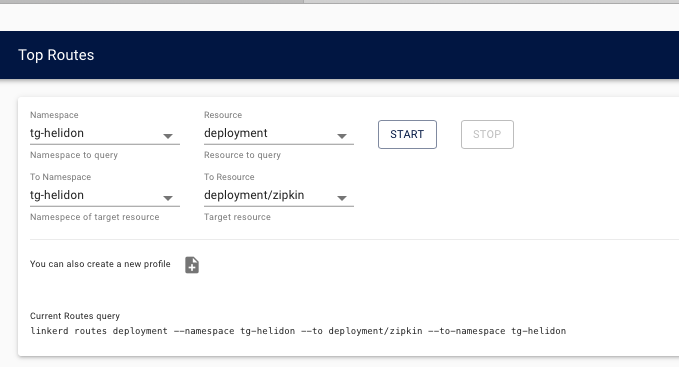
This will generate reports from any deployment to the `zipkin` deployment (it is of course possible to look at specific deployments, but this shows us a good overview)
7. Click the **Start** button
8. In the OCI cloud shell make multiple curl requests of the form
```bash
curl -i -k -u jack:password https://store.$EXTERNAL_IP.nip.io/store/stocklevel
```
9. Looking at the Linkerd UI we can see the result.
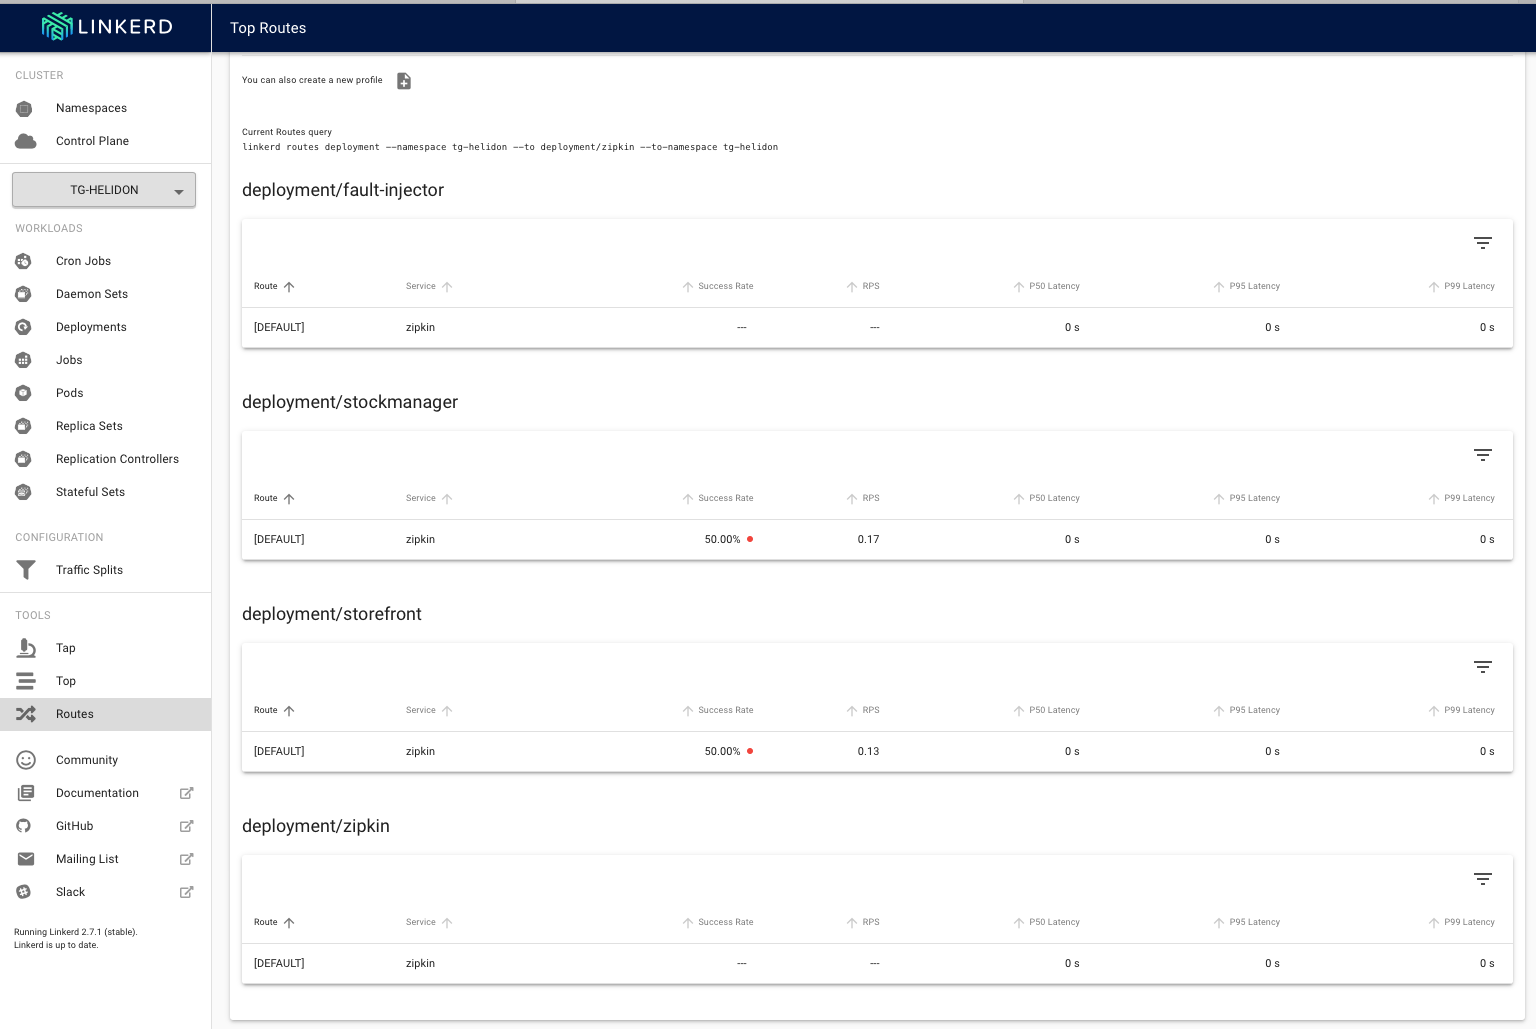
(you may have to scroll down a bit to see the deployment details)
We can see that **in this case** 50% of the requests from the storefront deployment to the zipkin deployment have failed, the same is true for the stockmanager. We know that our traffic split is doing what we expected and that we are failing the requests and potentially causing chaos! (If you'd like to please feel free to do a Dr Evil or Bond villan manic laugh at this point)
This is great, but how is our service handling it ?
Unless something very unexpected from the point of view of the lab writer has happened all the time you have been getting a reply to the curl command of something like
```json
[{"itemCount":410,"itemName":"Pencil"},{"itemCount":50,"itemName":"Eraser"},{"itemCount":4490,"itemName":"Pins"},{"itemCount":100,"itemName":"Book"}]
```
And you have not had any HTTP errors, this is a pretty good indicator that our service is continuing to work, out little experiment in chaos engineering has given us useful information!
What's happening in the pod itself ?
Wile the service itself is still delivering results fine it's possible that there are useful bit's of information in the logs that might help improve reliability.
First we need the pod name
- In the OCI Cloud shell type
```bash
kubectl get pods
```
```
NAME READY STATUS RESTARTS AGE
fault-injector-b5bf94d48-f7wbq 2/2 Running 0 55m
stockmanager-7945b54576-9f7q7 2/2 Running 0 69m
storefront-7667fc5fdc-5zwbr 2/2 Running 0 69m
zipkin-7db7558998-c5b5j 2/2 Running 0 69m
```
Now we want to get the logs of the pod itself, in **my** case that's `stockmanager-7945b54576-9f7q7`, but of course yours will be different.
Let's use kubectl to get the logs. Note that as the pod now contains multiple containers due to linkerd injecting them automatically we need to specify the container we want the logs for, as it's named in the deployment. In this case that's the stockmanager container.
- In the OCI Cloud Shell type the following, replace the pod name with your stockmanager pod name :
```bash
kubectl logs stockmanager-7945b54576-9f7q7 stockmanager
```
```
... Loads of stuff ....
2020.06.03 18:10:01 INFO com.oracle.labs.helidon.stockmanager.resources.StockResource Thread[helidon-4,5,server]: Getting all stock items
Hibernate:
SELECT
departmentName,
itemName,
itemCount
FROM
StockLevel
WHERE
departmentName='Tims Shop'
2020.06.03 18:10:02 INFO com.oracle.labs.helidon.stockmanager.resources.StockResource Thread[helidon-4,5,server]: Returning 4 stock items
2020.06.03 18:10:02 WARNING zipkin2.reporter.AsyncReporter$BoundedAsyncReporter Thread[AsyncReporter{URLConnectionSender{http://zipkin:9411/api/v2/spans}},5,main]: Spans were dropped due to exceptions. All subsequent errors will be logged at FINE level.
2020.06.03 18:10:02 WARNING zipkin2.reporter.AsyncReporter$BoundedAsyncReporter Thread[AsyncReporter{URLConnectionSender{http://zipkin:9411/api/v2/spans}},5,main]: Dropped 8 spans due to IOException(Server returned HTTP response code: 504 for URL: http://zipkin:9411/api/v2/spans)
java.io.IOException: Server returned HTTP response code: 504 for URL: http://zipkin:9411/api/v2/spans
at java.base/sun.net.www.protocol.http.HttpURLConnection.getInputStream0(HttpURLConnection.java:1919)
at java.base/sun.net.www.protocol.http.HttpURLConnection.getInputStream(HttpURLConnection.java:1515)
at zipkin2.reporter.urlconnection.URLConnectionSender.skipAllContent(URLConnectionSender.java:232)
at zipkin2.reporter.urlconnection.URLConnectionSender.send(URLConnectionSender.java:227)
at zipkin2.reporter.urlconnection.URLConnectionSender$HttpPostCall.doExecute(URLConnectionSender.java:266)
at zipkin2.reporter.urlconnection.URLConnectionSender$HttpPostCall.doExecute(URLConnectionSender.java:258)
at zipkin2.Call$Base.execute(Call.java:380)
at zipkin2.reporter.AsyncReporter$BoundedAsyncReporter.flush(AsyncReporter.java:285)
at zipkin2.reporter.AsyncReporter$Flusher.run(AsyncReporter.java:354)
at java.base/java.lang.Thread.run(Thread.java:834)
Hibernate:
SELECT
departmentName,
itemName,
itemCount
FROM
StockLevel
WHERE
departmentName='Tims Shop'
... Loads of stuff ....
```
In this case we can find (within a lot of other stuff) the error log details when the stockmanager tried to talk to the zipkin service. We can see that zipkin is dropping the spans.
**If you cannot find this** do not worry, there is a **lot** of log data.
---