
Install monitoring with Prometheus
Self guided student - video introduction
This video is an introduction to the Monitoring microservices with Prometheus lab. Depending on your browser settings it may open in this tab / window or open a new one. Once you've watched it please return to this page to continue the labs.
[](https://youtu.be/qnDzZ2eOy0E "Gathering metrics with Prometheus lab introduction video")
---
Introduction
This is one of the optional sets of Kubernetes labs
Estimated module duration 20 mins.
Objectives
This module shows how to install the data capture tool Prometheus and how to configure your microservices to be “scraped” by it. We do some simple retrieval and display of the captured data.
Prerequisites
You need to complete the Rolling update module (last of the core Kubernetes labs modules). You can have done any of the other optional module sets.
Task 1: Explaining Monitoring in Kubernetes
Monitoring a service in Kubernetes involves three components
A. Generating the monitoring data
This is mostly done by the service itself, the metrics capability we created when building the Helidon labs are an example of this.
Core Kubernetes services may also provide the ability to generate data, for example the Kubernetes DNS service can report on how many lookups it’s performed.
B. Capturing the data
Just because the data is available doesn’t mean we can analyse it, something needs to extract it from the services, and store it.
C. Processing and Visualizing the data
Once you have the data you need to be able to process it to visualize it and also report any alerts of problems.
Task 2: Preparing for installing Prometheus
For this lab we are going to do some very simple monitoring, using the metrics in our microservices and the standard capabilities in the Kubernetes core services to generate data. Then we’ll use the Prometheus to extract the data and Grafana to display it.
These tools are of course not the only ones, but they are very widely used, and are available as Open Source projects.
Task 2a: Configuring Helm
We need to specify the Helm repository for Prometheus
- In the OCI Cloud shell
<copy>helm repo add prometheus-community https://prometheus-community.github.io/helm-charts</copy>
"prometheus-community" has been added to your repositories
Now update the repository information
- In the OCI Cloud shell
<copy>helm repo update</copy>
Hang tight while we grab the latest from your chart repositories...
...Successfully got an update from the "kubernetes-dashboard" chart repository
...Successfully got an update from the "prometheus-community" chart repository
Update Complete. ⎈Happy Helming!⎈
Depending on which other modules you have done you may see differences in the repositories in the update list
To separate the monitoring services from the other services we’re going to put them into a new namespace. We will also secure access to Prometheus using a password.
Check if the $EXTERNAL_IP variable is set (depending on the order of modules you took to get here it may not be set)
- Open the OCI cloud shell if it’s not already open, type
<copy>echo $EXTERNAL_IP</copy>
If it returns the IP address like the example above you’re ready to go
If it’s not set then you’ll need to re-set it. There are a couple of ways to do this depending on if you use the scripts to install the microservices in Kubernetes (expand the first section immediately below) or if you installed your Kubernetes services manually (expand the second section below).
If you used the automated scripts to setup the microservices in Kubernetes (you have gone directly to the "optional" labs)
- Open the OCI cloud shell
The automated scripts will create a script file `$HOME/clusterSettings.one` this can be executed using the shell built in `source` to set the EXTERNAL_IP variable for you.
```bash
source $HOME/clusterSettings.one
```
```
EXTERNAL_IP set to 123.456.789.123
NAMESPACE set to tg
```
Of course the actual IP address and namespace will be different from the example here !
---
If you manually setup the Kubernetes microservices (you have been doing the "full" lab)
In this case as you manually installed the ingress controller there isn't a script created file with the information and set this up you will need to get the information from Kubernetes itself
- Open the OCI cloud shell
- You are going to get the value of the `EXTERNAL_IP` for your environment. This is used to identify the DNS name used by an incoming connection. In the OCI cloud shell type
```bash
kubectl get services -n ingress-nginx
```
```
NAME TYPE CLUSTER-IP EXTERNAL-IP PORT(S) AGE
ingress-nginx-controller LoadBalancer 10.96.182.204 130.162.40.241 80:31834/TCP,443:31118/TCP 2h
ingress-nginx-controller-admission ClusterIP 10.96.216.33 443/TCP 2h
```
- Look for the `ingress-nginx-controller` line and note the IP address in the `EXTERNAL-IP` column, in this case that's `130.162.40.121` but it's almost certain that the IP address you have will differ. IMPORTANT, be sure to use the IP in the `EXTERNAL-IP` column, ignore anything that looks like an IP address in any other column as those are internal to the OKE cluster and not used externally.
- IN the OCI CLoud shell type the following, replacing `[external ip]` with the IP address you retrieved above.
```bash
export EXTERNAL_IP=[external ip]
```
---
</details>
Now you have got a value in the variable you can copy and paste from the instructions below.
1. Switch to the monitoring directory. In the OCI Cloud shell type
```bash
cd $HOME/helidon-kubernetes/monitoring-kubernetes
```
2. Type the following to create the namespace
```bash
kubectl create namespace monitoring
```
```
namespace/monitoring created
```
3. Create a password file for the admin user. In the example below I'm using `ZaphodBeeblebrox` as the password, but please feel free to change this if you like. In the OCI Cloud Shell type
```bash
htpasswd -c -b auth admin ZaphodBeeblebrox
```
```
Adding password for user admin
```
4. Now having created the password file we need to add it to Kuberntes as a secret so the ingress controller can use it. In the OCI Cloud Shell type
```bash
kubectl create secret generic web-ingress-auth -n monitoring --from-file=auth
```
```
secret/web-ingress-auth created
```
5. To provide secure access for the ingress we will set this up with a TLS connection , that requires that we create a certificate for the ingress rule. In production you would of course use a proper certificate, but for this lab we're going to use the self-signed root certificate we created in the cloud shell setup.
```bash
$HOME/keys/step certificate create prometheus.monitoring.$EXTERNAL_IP.nip.io tls-prometheus-$EXTERNAL_IP.crt tls-prometheus-$EXTERNAL_IP.key --profile leaf --not-after 8760h --no-password --insecure --kty=RSA --ca $HOME/keys/root.crt --ca-key $HOME/keys/root.key
```
```
Your certificate has been saved in tls-prometheus-123.456.789.123.crt.
Your private key has been saved in tls-prometheus-123.456.789.123.key.
```
(The above is example output, your files will be based on the IP you provided)
If your output says it's created key files like `tls-prometheus-.crt` and does not include the IP address then the `EXTERNAL_IP` variable is not set, please follow the instructions in Task 1 and re-run the step certificate creation command
6. Now we will create a tls secret in Kubernetes using this certificate, note that this is in the `monitoring` namespace as that's where Prometheus will be installed..
```bash
`kubectl create secret tls tls-prometheus --key tls-prometheus-$EXTERNAL_IP.key --cert tls-prometheus-$EXTERNAL_IP.crt -n monitoring
```
```
secret/tls-prometheus created
```
## Task 3: Installing Prometheus
Note the name given to the Prometheus server within the cluster, in this case `prometheus-server.monitoring.svc.cluster.local` and also the alert manager's assigned name, in this case `prometheus-alertmanager.monitoring.svc.cluster.local`
The Helm chart will automatically create a couple of small persistent volumes to hold the data it captures. If you want to see more on the volume in the dashboard (namespace monitoring) look at the Config and storage section / Persistent volume claims section, chose the prometheus-server link to get more details, then to locate the volume in the storage click on the Volume link in the details section) Alternatively in the Workloads / Pods section click on the prometheus server pod and scroll down to see the persistent volumes assigned to it. It will also use the tls-prometheus secret and the password auth we just setup
1. Installing Prometheus is simple, we just use helm, though there are quite a lot of options here most of them relate to setting up security on the ingress rules. In the OCI Cloud Shell type the following.
```bash
helm install prometheus prometheus-community/prometheus --namespace monitoring --version 22.4.1 --set server.ingress.enabled=true --set server.ingress.hosts="{prometheus.monitoring.$EXTERNAL_IP.nip.io}" --set server.ingress.tls[0].secretName=tls-prometheus --set server.ingress.annotations."kubernetes\.io/ingress\.class"=nginx --set server.ingress.annotations."nginx\.ingress\.kubernetes\.io/auth-type"=basic --set server.ingress.annotations."nginx\.ingress\.kubernetes\.io/auth-secret"=web-ingress-auth --set server.ingress.annotations."nginx\.ingress\.kubernetes\.io/auth-realm"="Authentication Required" --set alertmanager.persistentVolume.enabled=false --set server.persistentVolume.enabled=false --set pushgateway.persistentVolume.enabled=false
```
```
NAME: prometheus
LAST DEPLOYED: Wed Jul 21 17:22:59 2021
NAMESPACE: monitoring
STATUS: deployed
REVISION: 1
TEST SUITE: None
NOTES:
The Prometheus server can be accessed via port 80 on the following DNS name from within your cluster:
prometheus-server.monitoring.svc.cluster.local
From outside the cluster, the server URL(s) are:
http://prometheus.monitoring.123.456.789.999.nip.io
The Prometheus alertmanager can be accessed via port 80 on the following DNS name from within your cluster:
prometheus-alertmanager.monitoring.svc.cluster.local
Get the Alertmanager URL by running these commands in the same shell:
export POD_NAME=$(kubectl get pods --namespace monitoring -l "app=prometheus,component=alertmanager" -o jsonpath="{.items[0].metadata.name}")
kubectl --namespace monitoring port-forward $POD_NAME 9093
#################################################################################
###### WARNING: Pod Security Policy has been moved to a global property. #####
###### use .Values.podSecurityPolicy.enabled with pod-based #####
###### annotations #####
###### (e.g. .Values.nodeExporter.podSecurityPolicy.annotations) #####
#################################################################################
The Prometheus PushGateway can be accessed via port 9091 on the following DNS name from within your cluster:
prometheus-pushgateway.monitoring.svc.cluster.local
Get the PushGateway URL by running these commands in the same shell:
export POD_NAME=$(kubectl get pods --namespace monitoring -l "app=prometheus,component=pushgateway" -o jsonpath="{.items[0].metadata.name}")
kubectl --namespace monitoring port-forward $POD_NAME 9091
For more information on running Prometheus, visit:
https://prometheus.io/
```
Note that it will take a short while for the Prometheus service to start, but to speed this up we have disabled the use of persistent storage - of course in a production environment you would **not** do this ! Check the dashboard and wait for the `prometheus-service` pod to be Ready or if you prefer the CLI `kubectl get pods -n monitoring`.
## Task 4 Accessing Prometheus
Let's go to the service web page
1. In your web browser open up the following link (replace with the IP for your Load balancer) - you may have to accept it as an unsafe page due to using a self-signed root certificate.
```
https://prometheus.monitoring..nip.io
```
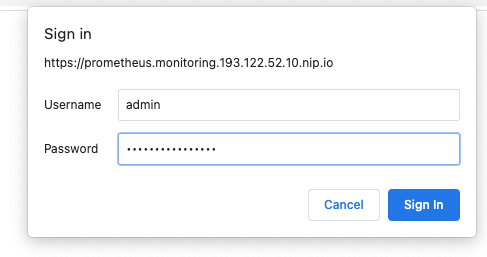
2. When prompted enter the username of `admin` and the password you chose when you setup the credentials (we suggested `ZaphodBeeblebrox` but if you chose your own you'll need to use that).
You'll see the Initial prometheus graph page as below.
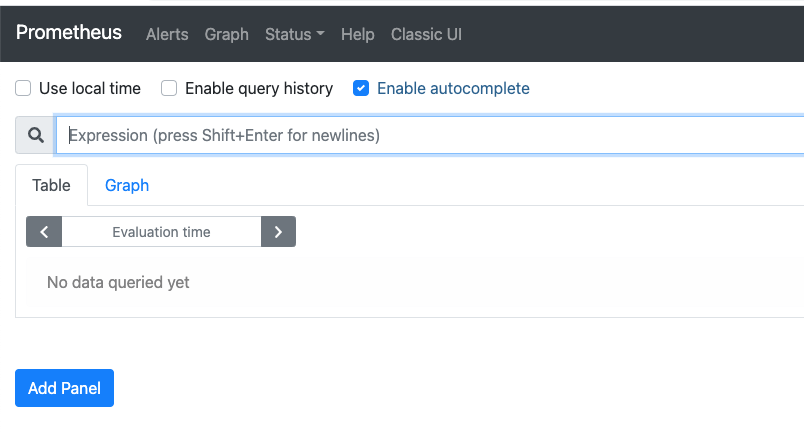
Let's check that Prometheus is scraping some data.
2. Click in the **Expression** box the press the space bar
You will see a *lot* of possible choices exploring the various services built into Kubernetes (Including apiserver, Core DNS, Container stats, the number of various Kubernetes objects like secrets, pods, configmaps and so on).
3. In the dropdown find and select select `kubelet_http_requests_total` (if you type in the box it will reduce the options to match with what you've already entered)
4. Click the **Execute** button.
Alternatively rather than selecting from the list you can just start to type `kubelet_http_requests_total` into the Expression box, as you type a drop down will appear showing the possible metrics that match your typing so far, once the list of choices is small enough to see it chose `kubelet_http_requests_total` from the list (or just finish typing the entire name and press return to select it)
Depending on what Prometheus feels like (It seems to very between versions and your starting view) you will initially be presented with either a table of text data
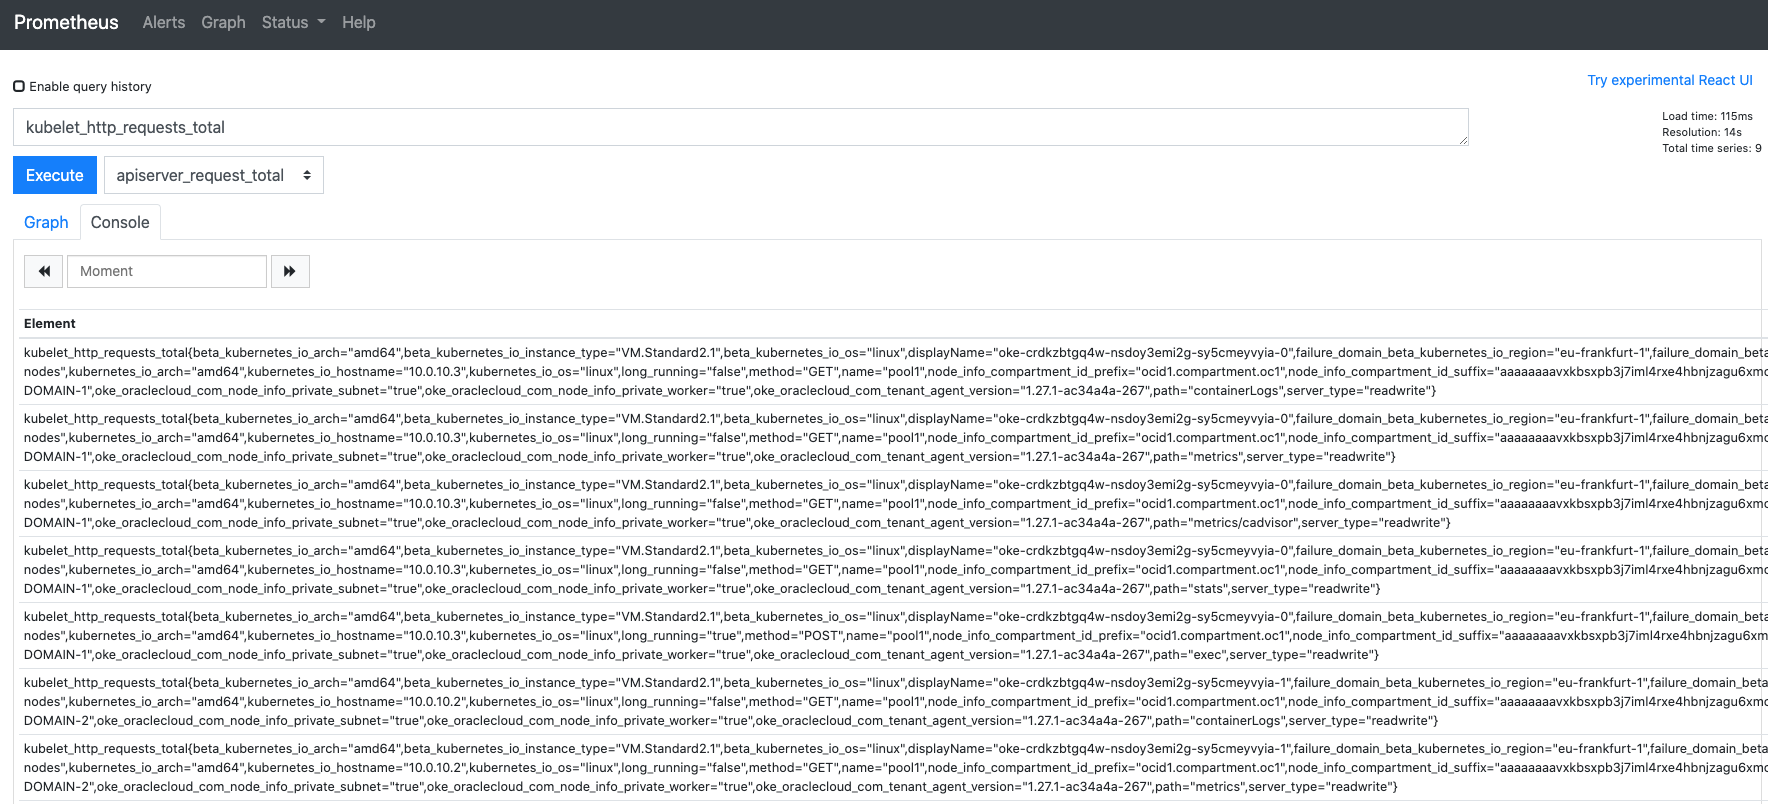
or a graph
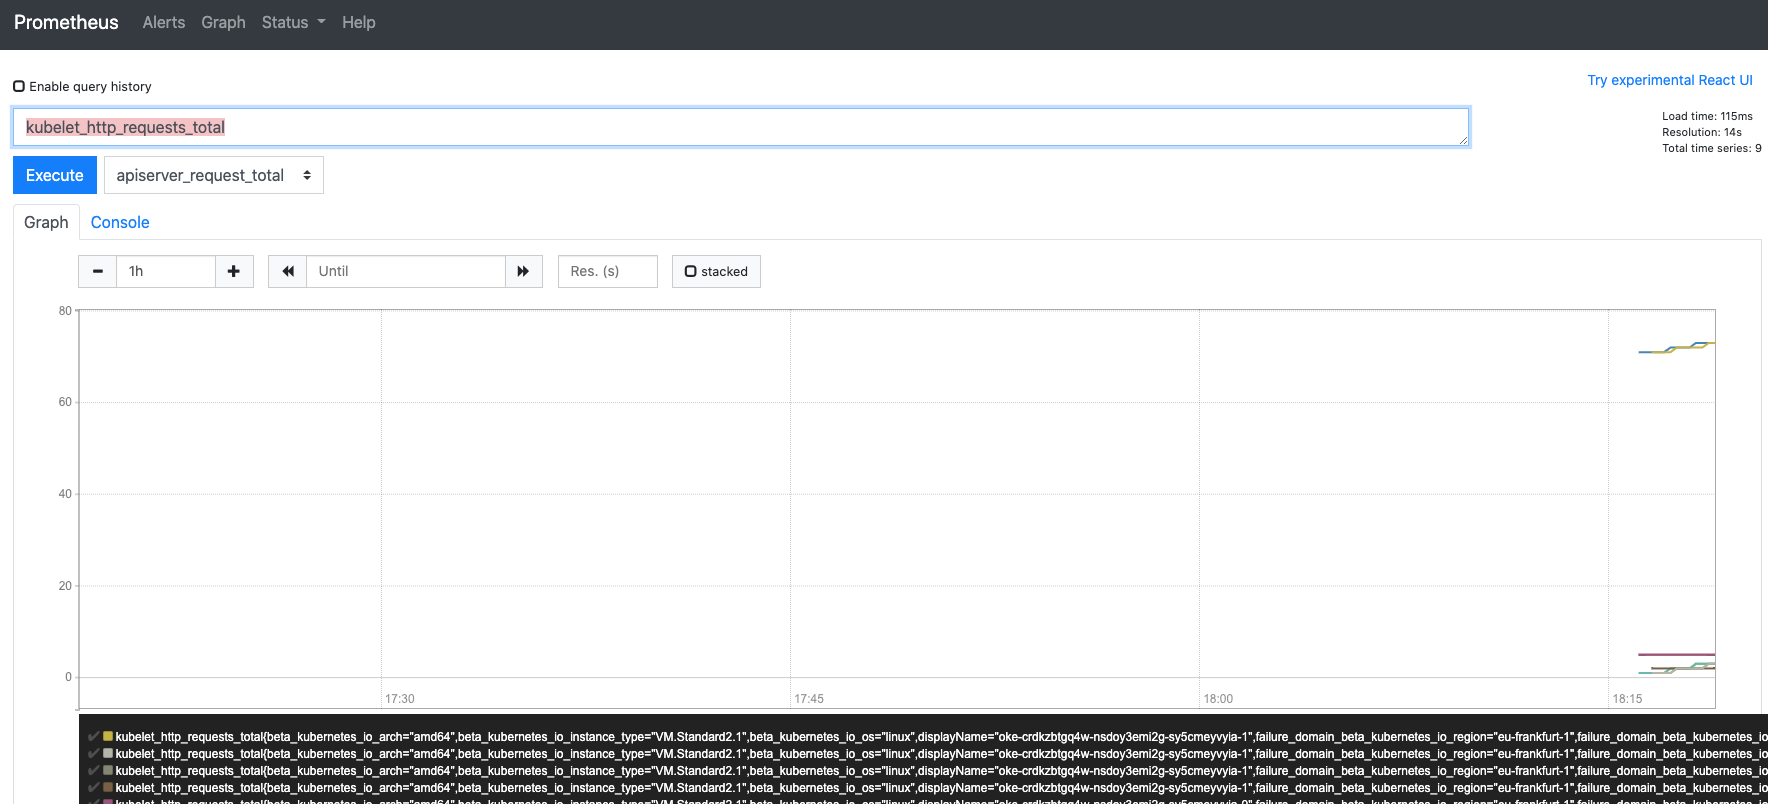
5. Click the **Graph** or **Table** tab names to switch between them
The Kubelet is the code that runs in the worker nodes to perform management actions like starting pods and the like, we can therefore be reasonably confident it'll be available to select.
Note that the precise details shown will of course vary, especially if you've only recently started Prometheus.
6. Click the + and - buttons next to the duration (default is 1 hour) to expand or shrink the time window of the data displayed
7. Use the << and >> buttons to move the time window around within the overall data set (of course these may not be much use if you haven't got much data, but have a play if you like)
## Task 5: Specifying services to scrape
The problem we have is that (currently) Prometheus is not collecting any data from our services. Of course we may find info on the clusters behavior interesting, but our own services would be more interesting!
We can see what services Prometheus is currently scraping :
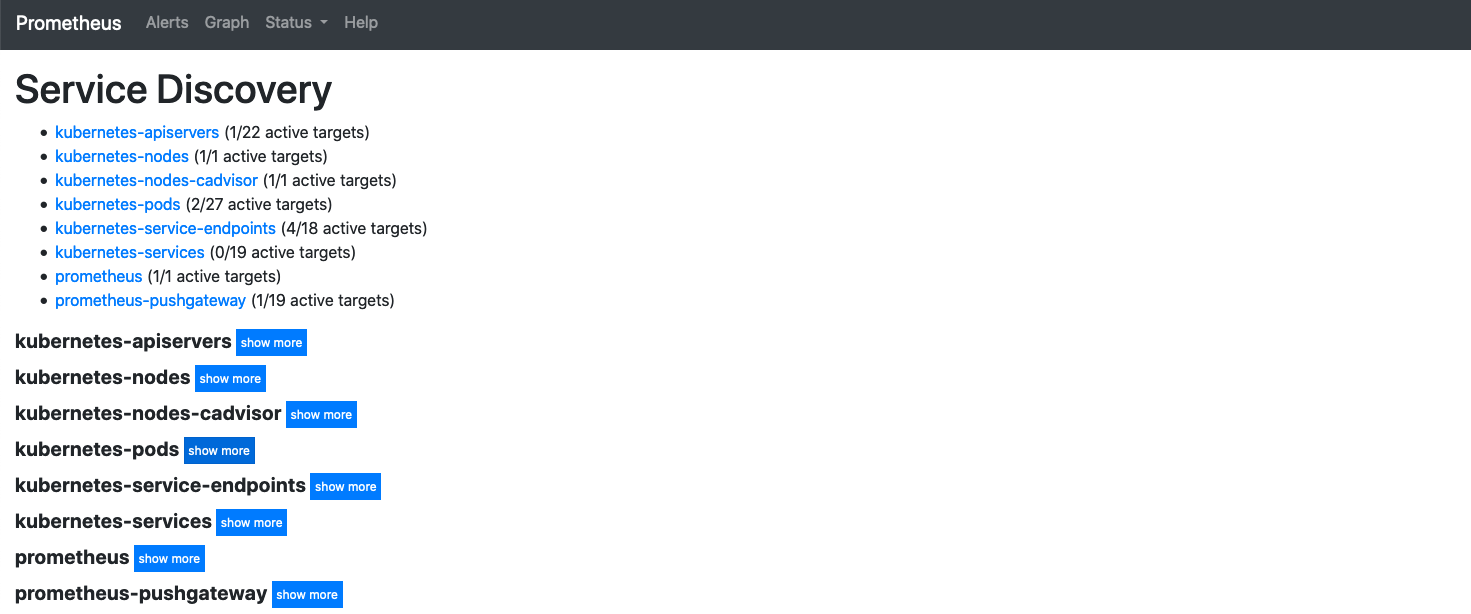
1. Click on the **Status** menu (top of the screen) :
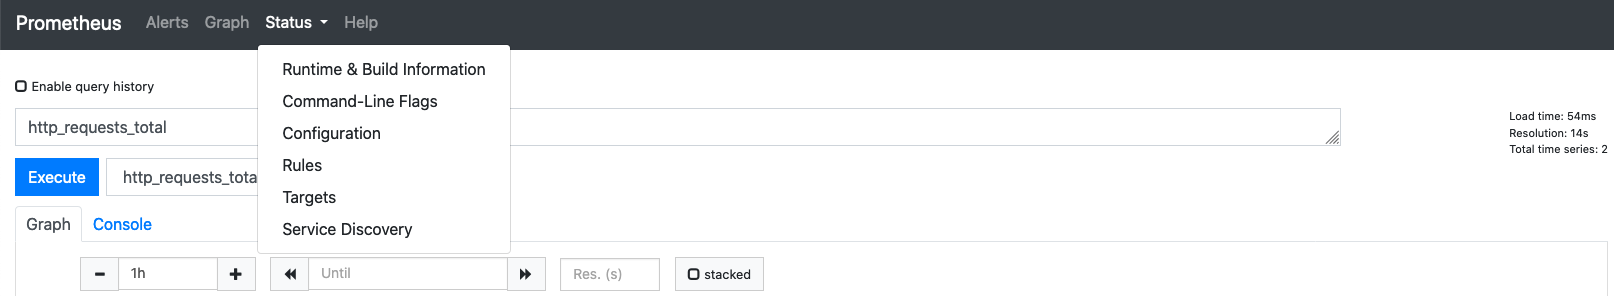
2. Then select **Service Discovery**
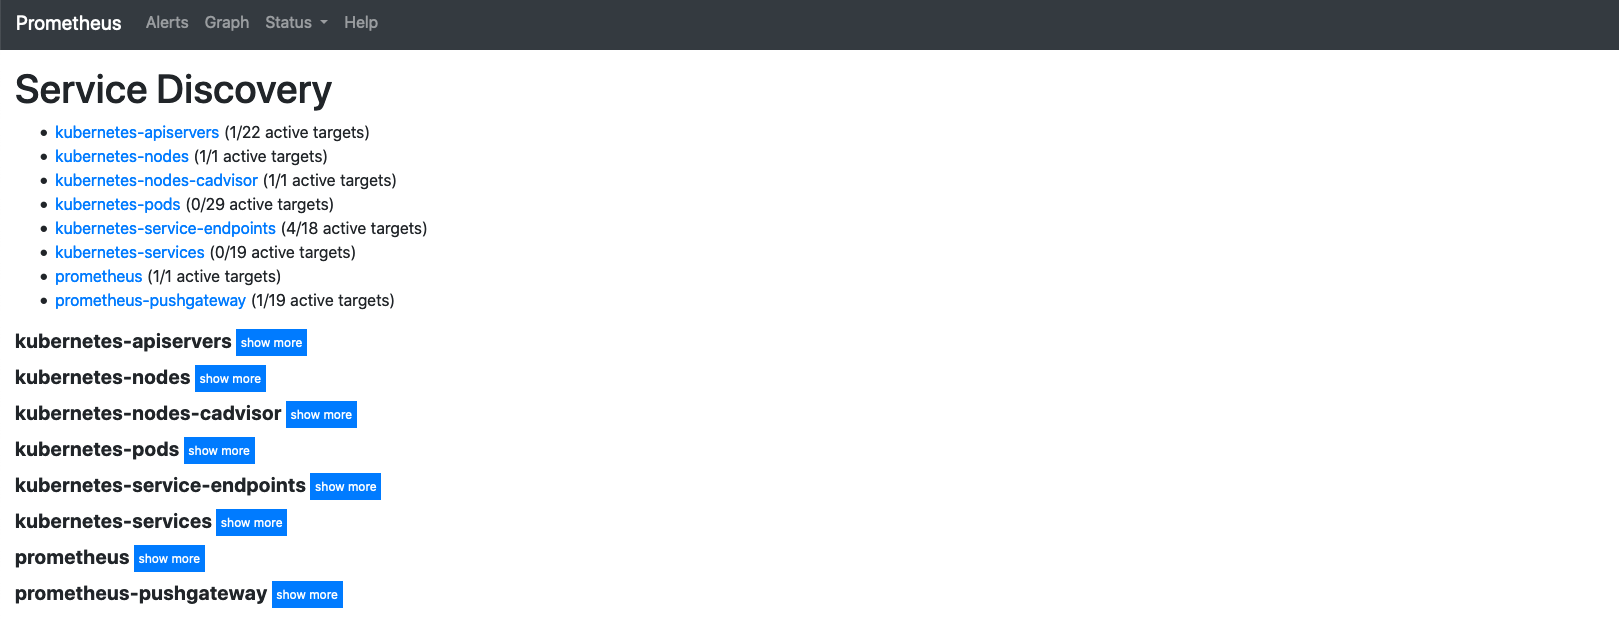
3. Click on the **Show More** button next to the Kubernetes-pods line (this is the 2nd reference to Kubernetes pods, the 1st is just a link that takes you to the 2nd one it it's not on the screen)
You will be presented with a list of all of the pods in the system and the information that Prometheus has gathered about them (it does this by making api calls to the api server in the same way kubectl does)
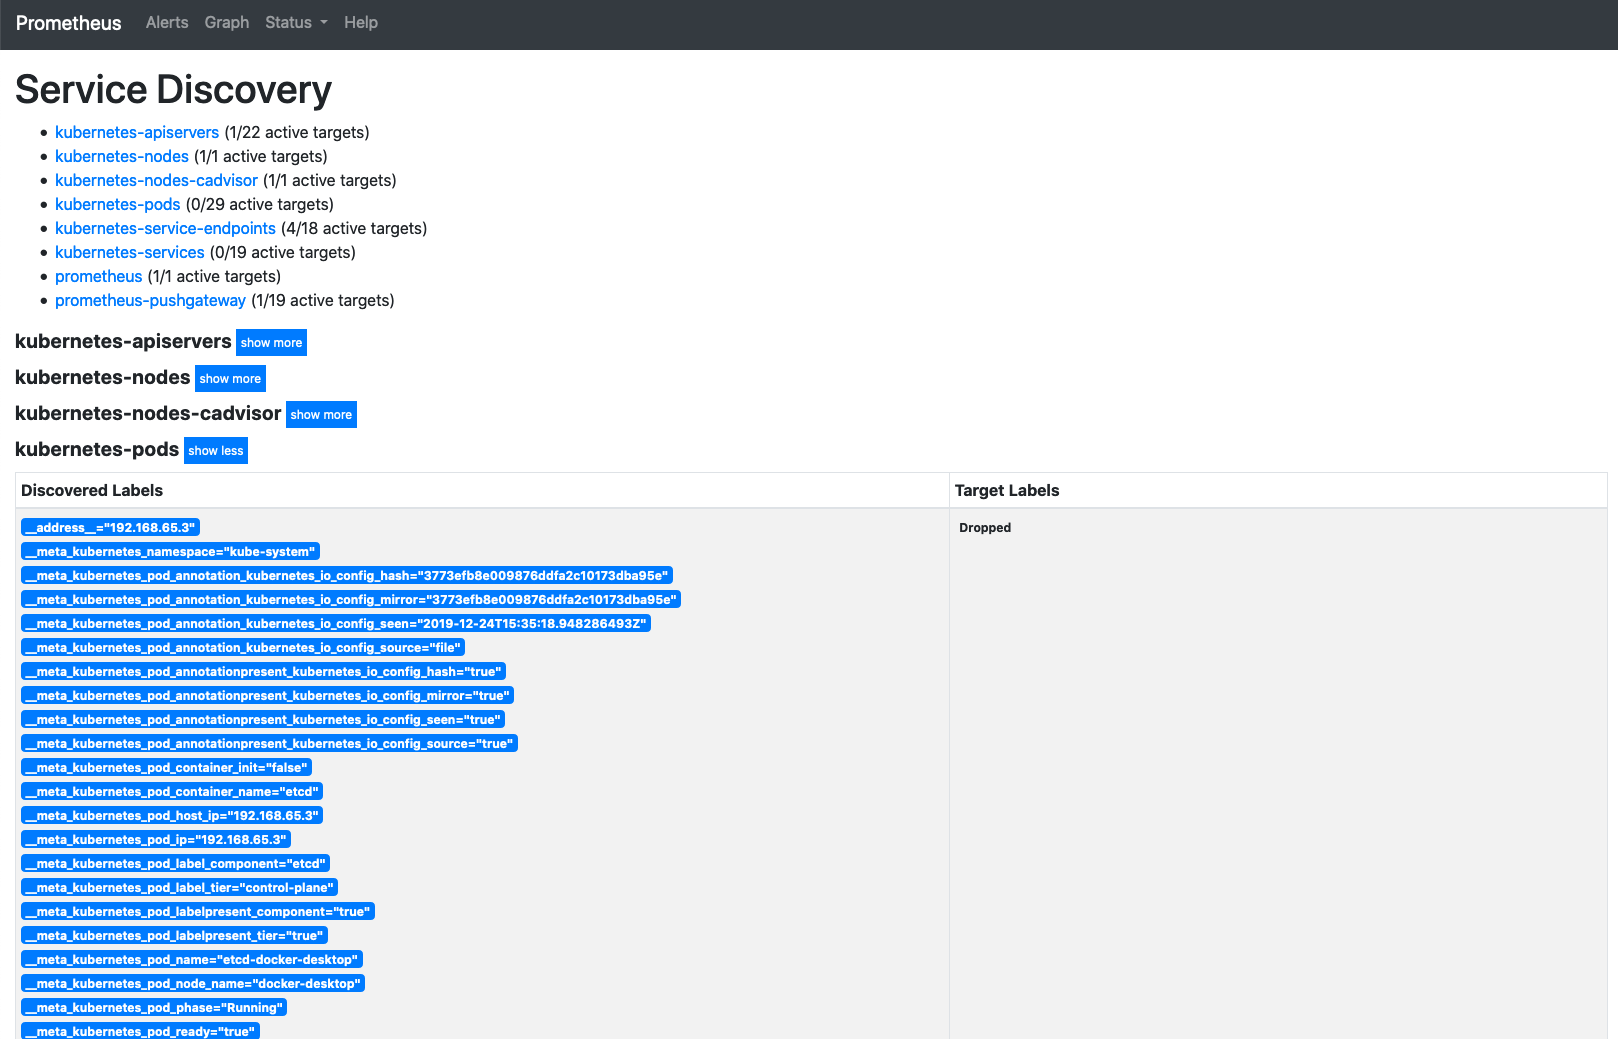
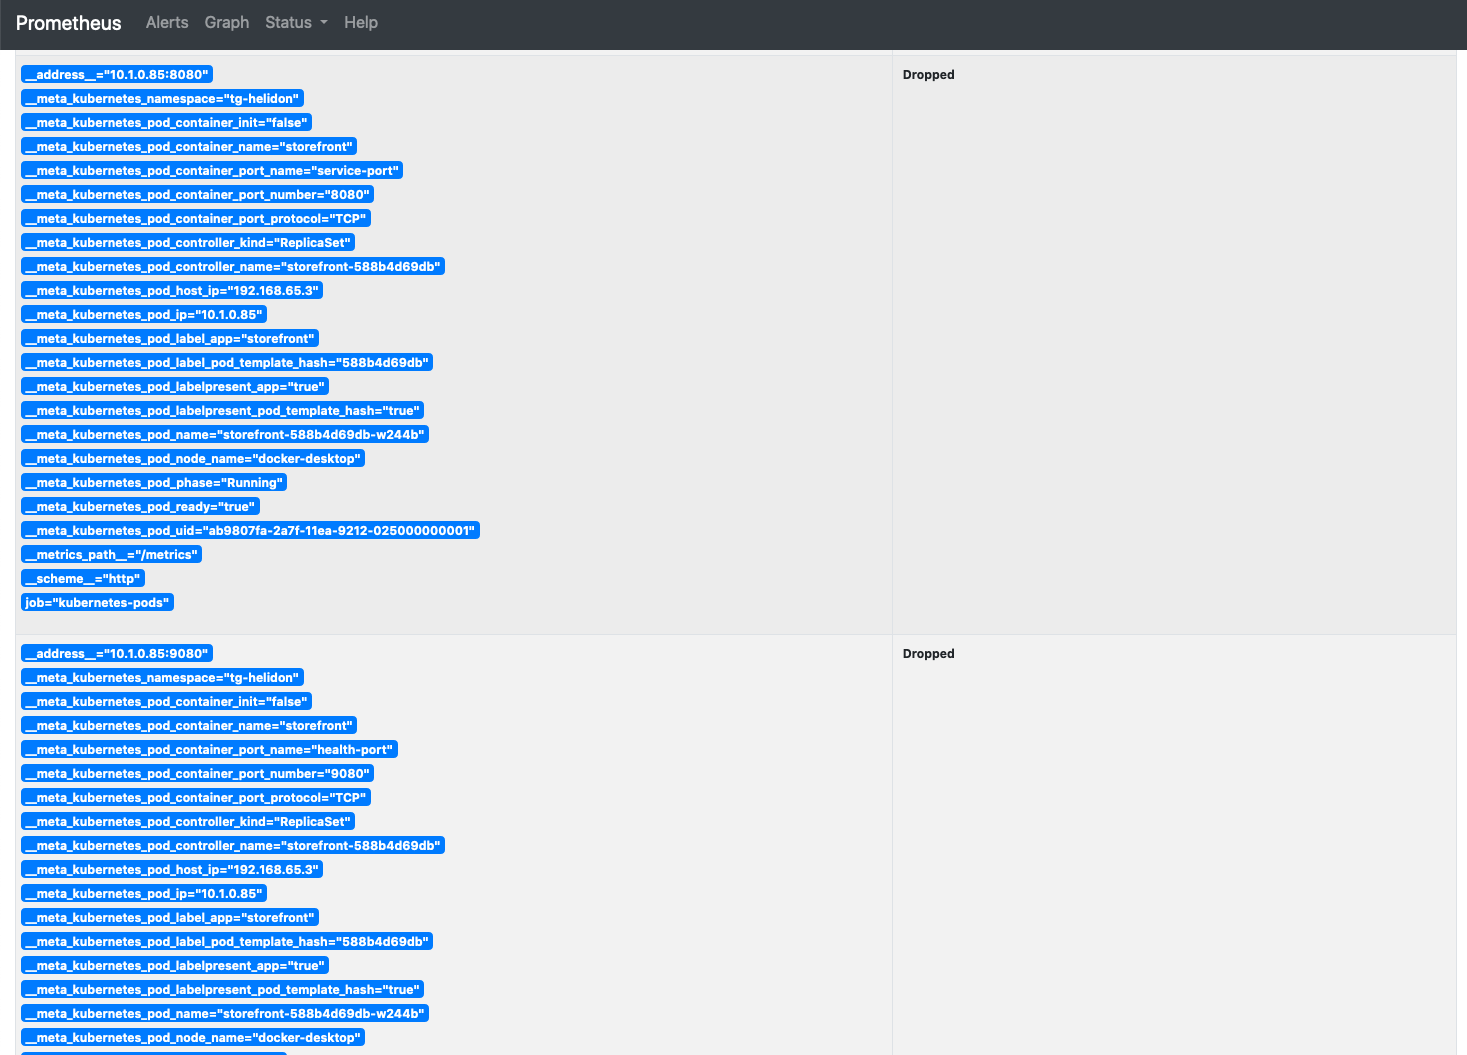
4. Scroll down to find the entries for the storefront and stockmanager pods.
If the pod is exposing multiple ports there may be multiple entries for the same pod as Prometheus is checking every port it can to see if there are metrics available. The image below shows the entries for the storefront on ports 8080 and 9080:
We know that Prometheus can see our pods, the question is how do we get it to scrape data from them ?
The answer is actually very simple. In the same way that we used annotations on the Ingress rules to let the Ingress controller know to scan them we use annotations on the pod descriptions to let Prometheus know to to scrape them (and how to do so)
We can use kubectl to get the pod id, using a label selector to get pods with a label **app** and a value **storefront**, then we're using jsonpath to get the specific details from the JSON output.
Don't actually do this, this is just to show how you could modify a live pod with kubectl
This gets the pod name - Example only, do not run this:
```bash
$ kubectl get pods -l "app=storefront" -o jsonpath="{.items[0].metadata.name}"
storefront-588b4d69db-w244b
```
Now we could use kubectl to add a few annotations to the pod (this is applied immediately, and Prometheus will pick up on it in a few seconds)
These are annotations to apply the live pod - Example only, do not run this:
```bash
$ kubectl annotate pod storefront-588b4d69db-w244b prometheus.io/scrape=true --overwrite
pod/storefront-588b4d69db-w244b annotated
$ kubectl annotate pod storefront-588b4d69db-w244b prometheus.io/path=/metrics --overwrite
pod/storefront-588b4d69db-w244b annotated
$ kubectl annotate pod storefront-588b4d69db-w244b prometheus.io/port=9080 --overwrite
pod/storefront-588b4d69db-w244b annotated
```
We can see what annotations there would be on the pod with kubectl (this works even if you setup the annotations using the deployment yaml file).
This lists the pod annotations - Example only, do not run this:
```bash
$ kubectl get pod storefront-588b4d69db-w244b -o jsonpath="{.metadata..annotations}"
map[prometheus.io/path:/metrics prometheus.io/port:9080 prometheus.io/scrape:true]
```
***However***
In most cases we don't want these to be a temporary change, we want the Prometheus to monitor our pods if they restart (or we re-deploy)
The deployment files in the `$HOME/helidon-kubernetes` directory have the annotations commented out when they were cloned from git. Rather than edit the YAML (which can lead to format errors if the indentation doesn't line up) we're going to run a script that will remove the comments and redeploy the services with the updated annotations for us, if you wanted you could of course do this by hand !
5. Switch to the monitoring directory. In the OCI CLoud shell type
```bash
cd $HOME/helidon-kubernetes/monitoring-kubernetes
```
6. Run the script
```bash
bash configure-pods-for-prometheus.sh
```
```
deployment.apps/stockmanager configured
deployment.apps/storefront configured
```
7. The deployment files now contains annotations like the following
```yaml
annotations:
prometheus.io/path: /metrics
prometheus.io/port: "9080"
prometheus.io/scrape: "true"
spec:
containers:
```
The first path and port annotations define the path and port the metrics service is running on.
The scrape annotation is detected by Prometheus and as in this case it's set to true will trigger Prometheus to start looking for metrics data. This is why we didn't have to configure Prometheus itself, and only needed to
If we use kubectl to get the status after a short while (the pods may have to wait for their readiness probes to be operational) we'll see everything is working as expected and the pods are Running
8. View status:
```bash
kubectl get all
```
```
NAME READY STATUS RESTARTS AGE
pod/stockmanager-d6cc5c9b7-f9dnf 1/1 Running 0 79s
pod/storefront-588b4d69db-vnxgg 1/1 Running 0 79s
pod/zipkin-88c48d8b9-x8b6t 1/1 Running 0 79s
NAME TYPE CLUSTER-IP EXTERNAL-IP PORT(S) AGE
service/stockmanager ClusterIP 10.100.156.12 8081/TCP,9081/TCP 8h
service/storefront ClusterIP 10.110.88.187 8080/TCP,9080/TCP 8h
service/zipkin ClusterIP 10.101.129.223 9411/TCP 8h
NAME READY UP-TO-DATE AVAILABLE AGE
deployment.apps/stockmanager 1/1 1 1 1h
deployment.apps/storefront 1/1 1 1 1h
deployment.apps/zipkin 1/1 1 1 1h
NAME DESIRED CURRENT READY AGE
replicaset.apps/stockmanager-d6cc5c9b7 1 1 1 79s
replicaset.apps/storefront-588b4d69db 1 1 1 79s
replicaset.apps/stockmanager-2fae51269 1 1 1 1h
replicaset.apps/storefront-a458e8bc51 1 1 1 1h
replicaset.apps/zipkin-88c48d8b9 1 1 1 1h
```
We actually redeployed the pods (so applied an updated configuration) this is why we see multiple replica sets. Kubernetes has acted in the same way as if it was an upgrade of the deployment images of other configuration information and if we'd run the kubectl command quickly enough the new replica sets and pods being created before the old pods were terminated. We saw how this actually works in the rolling upgrade lab.
9. Return to your browser and reload the Prometheus Status page
You will see that there are 2 pods showing as being discovered, previously it was 0
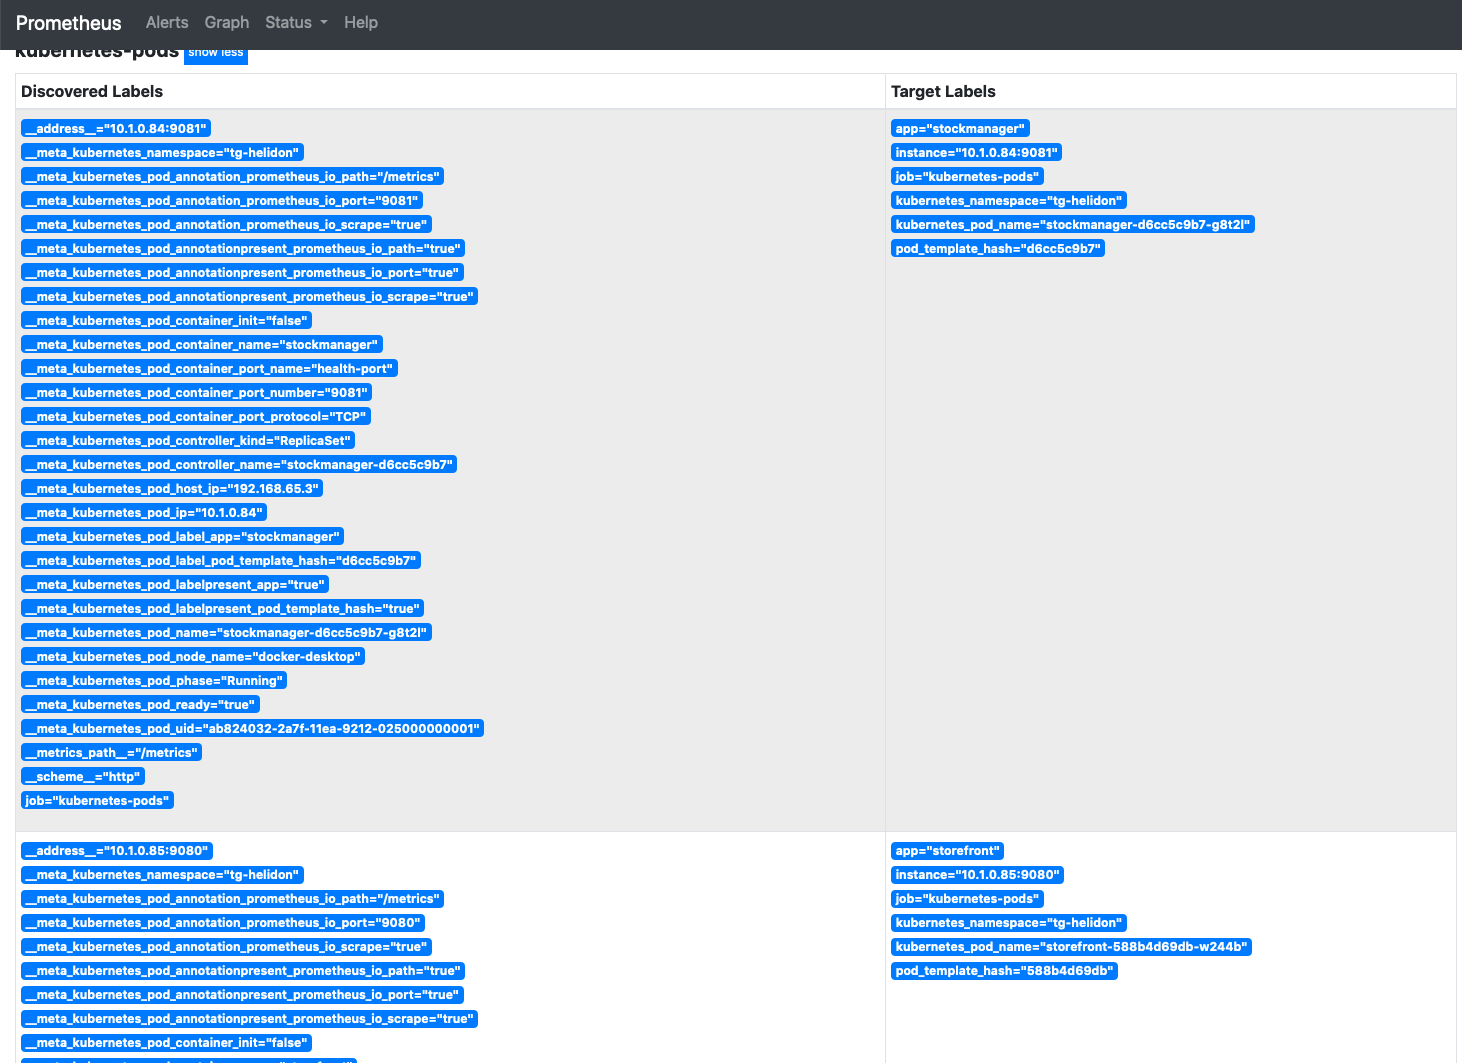
10. Click on the **show more** button next to the kubernetes-pods label
You can see that the storefront pod (port 9080) and stockmanager (port 9081) pods are no longer being dropped and there is now data in the target labels column. The actual data services for storefont (port 8080) and stockmanager (port 8081) are however still dropped.
## Task 6: Let's look at our captured data
Now we have configured Prometheus to scrape the data from our services we can look at the data it's been capturing.
1. Return to the Graph page in the Prometheus web page
2. Click on the **Graph** tab in the lower section.
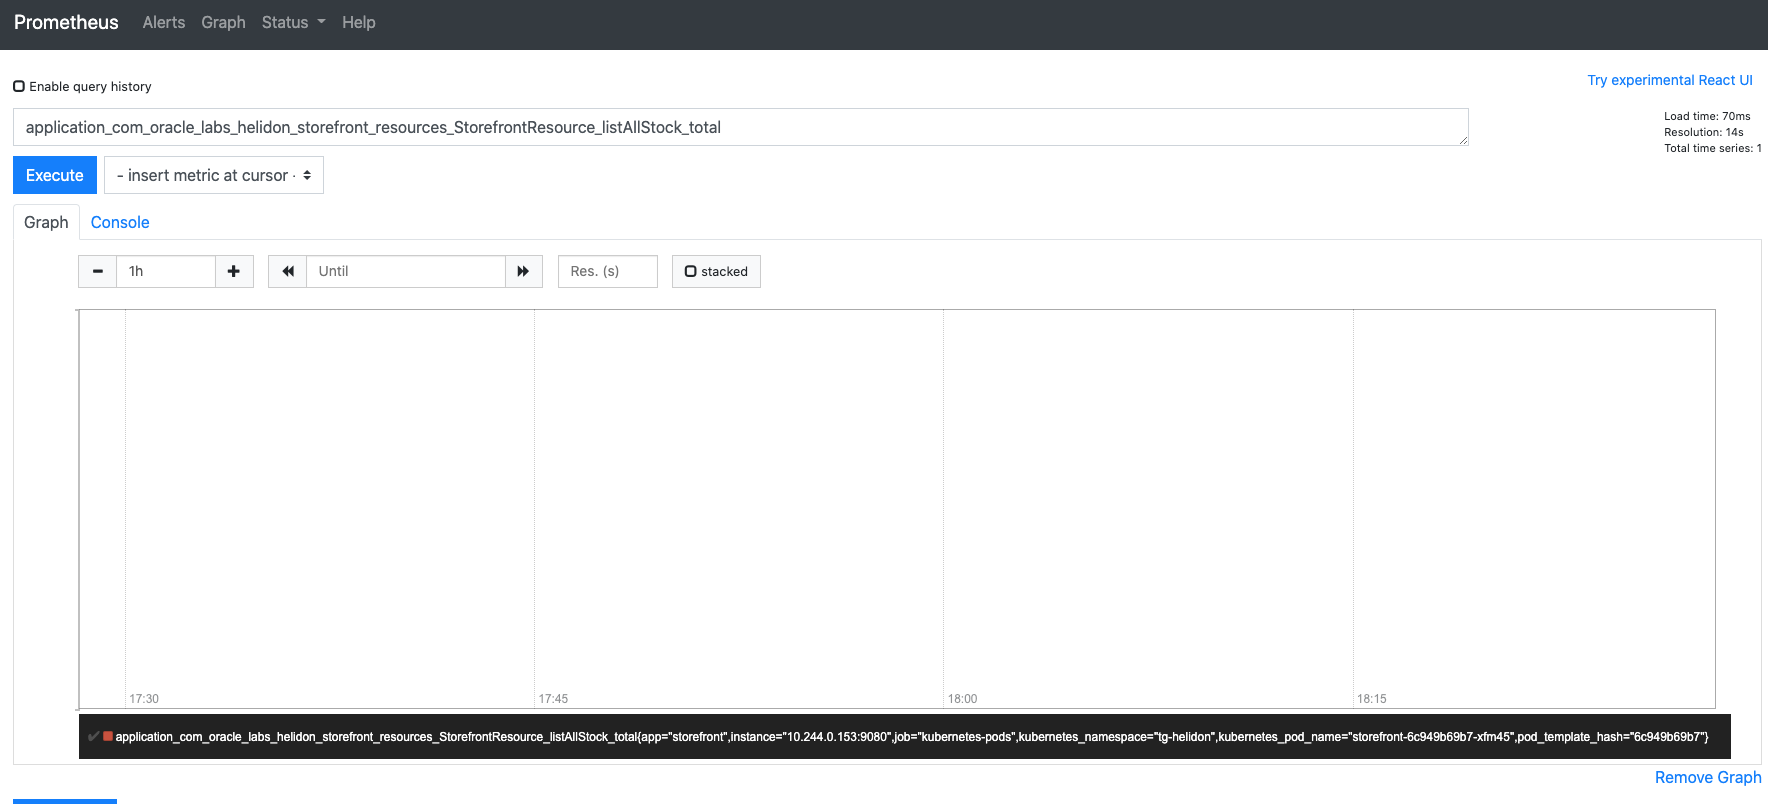
3. In the Expression box use the auto complete function by typing the start of `application_com_oracle_labs_helidon_storefront_resources_StorefrontResource_listAllStock_total` or select it from the list under the **Insert metric at cursor** button.
4. Click the **Execute** button.
If you're on the graph screen you'll probably see a pretty boring graph
5.Look at the **console view** to see a bit more information:
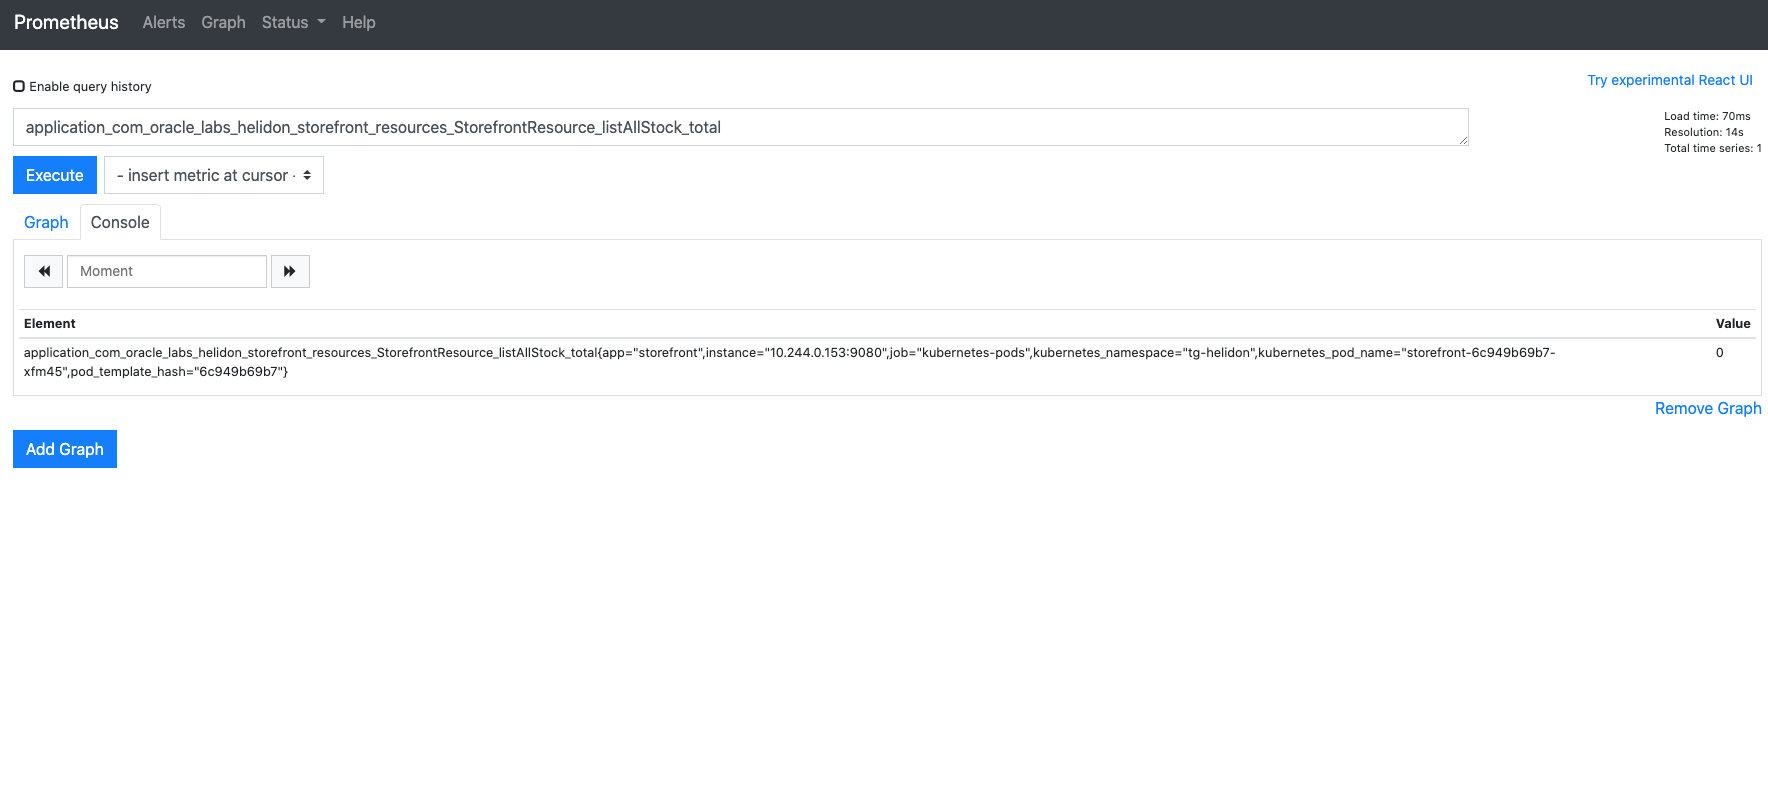
If we look at the data we can see that the retrieved value (in the **Value** column on the right) in this case is 0 (it may be another number, depends on how often you made the call to list the stock in previous labs) of course our graph looks boring, since we've just setup Prometheus we haven't actually done anything)
Let's make a few calls to list the stock and see what we get
If your cloud shell session is new or has been restarted then the shell variable `$EXTERNAL_IP` may be invalid, expand this section if you think this may be the case to check and reset it if needed.
How to check if $EXTERNAL_IP is set, and re-set it if it's not
**To check if `$EXTERNAL_IP` is set**
If you want to check if the variable is still set type `echo $EXTERNAL_IP` if it returns the IP address you're ready to go, if not then you'll need to re-set it.
**To get the external IP address if you no longer have it**
In the OCI Cloud shell type
```bash
kubectl --namespace ingress-nginx get services -o wide ingress-nginx-controller
```
```
NAME TYPE CLUSTER-IP EXTERNAL-IP PORT(S) AGE SELECTOR
ingress-nginx-controller LoadBalancer 10.96.61.56 132.145.235.17 80:31387/TCP,443:32404/TCP 45s app.kubernetes.io/component=controller,app.kubernetes.io/instance=ingress-nginx,app.kubernetes.io/name=ingress-nginx
```
The External IP of the Load Balancer connected to the ingresss controller is shown in the EXTERNAL-IP column.
**To set the variable again** replace `[External IP]` with the IP address you got above
```bash
export EXTERNAL_IP=[External IP]
```
---