Skip to the content.

Title image

Setup Log capture for Processing

Self guided student - video introduction This video is an introduction to the Log Capture for processing labs Depending on your browser settings it may open in this tab / window or open a new one. Once you've watched it please return to this page to continue the labs. [![Kubernetes Log capture for processing video](https://img.youtube.com/vi/QjvhjL0hxLE/0.jpg)](https://youtu.be/QjvhjL0hxLE "Kubernetes log capture for procesing video") ---

Introduction

This is one of the optional sets of Kubernetes labs. This lab currently uses a slightly older version of Elastic Search as the data store, it will soon be updated to use the open source Open Search.

Please be aware that this log capture works if you are using manually managed nodes, for virtual nodes you will need a different approach as they don’t support daemon sets. The approach described here is one of several approaches and this focused on handling the log data capture within Kubernetes, OKE also supports ways of directly capturing log data using OCI log management techniques as well

Estimated module duration 20 mins.

Objectives

This module shows how to install and configure the log capture tool Fluentd, and write data to an elastic search instance where it could be subsequently processed or analyzed (the actual processing / analysis is not covered in this module)

Task 1: Log capture for processing and analysis

Developers create log entries for a reason, but as we’ve seen so far they are not that easy to get at in Kubernetes.

The problem with log data in a distributed cloud native environment Many applications generate log data, in the case of Java programs this is usually achieved by a logging library, in the case of the Helidon parts of the labs we have used the Simple Logging Facade (The @slf4j Lombok annotation in the code) which allows us to easily switch the actuall logging engine being used. Other languages also have their own logging frameworks, for example in Ruby there is the Logger class, and in there are open source libraries like log4c. Most Unix (and Linux) systems provide support for syslogd which enables system operations as well as code to generate log messages. The problem is that the output of the log messages is not always consistent, for example syslogd writes it's data to a system directory and most code logging frameworks have many different output mechanisms including files, the system console, and also standard output. To make things even more complicated there are many different output formats, plain ASCII is common, but json, xml are often used. Even something as simple as the date / time is often specified by the authors of the code itself and is in their local format (it's rare to see a log event using seconds / milliseconds as per Unix / Java time) All of these options make logging complicated, where to capture the data and what it looks like make it very difficult to have consistent logging, and given that micro-service based architectures are often deployed using micro-services from many locations and in many programming languages this is a problem. Fortunately the 12 factors has a [simple recommendation on logging](https://12factor.net/logs) that addresses at least some of these problems. The recommendation is that logs should be treated as a stream of data being sent to the applications standard out, and that the rest of the process is a problem for the execution environment. As part of its design Kubernetes does save all the information sent by a pod to its standard out, and we have seen this when we look at the logs for a pod, we did this earlier on when we used the dashboard to have a log at the logs, and also the command `kubectl logs -n ` let's us see the logs (use `-f` to "follow" the log as new information is added) This is good, but with in a distributed architecture a single request may (almost certainly will) be processed by multiple individual micro-services. We've seen how zipkin can be used to generate trace data as a request traverses multiple micro-services, but how can integrate the log data ? --- </details> If your cloud shell session is new or has been restarted then the shell variable `$EXTERNAL_IP` may be invalid, expand this section if you think this may be the case to check and reset it if needed.
How to check if $EXTERNAL_IP is set, and re-set it if it's not **To check if `$EXTERNAL_IP` is set** If you want to check if the variable is still set type `echo $EXTERNAL_IP` if it returns the IP address you're ready to go, if not then you'll need to re-set it, there are a couple of ways to do this, expand the appropriate section below.
If you used the automated scripts in the kubernetes-lab directory to setup the microservices in Kubernetes - Open the OCI cloud shell The automated scripts will create a script file `$HOME/clusterSettings.one` this can be executed using the shell built in `source` to set the EXTERNAL_IP variable for you. ```bash source $HOME/clusterSettings.one ``` ``` EXTERNAL_IP set to 139.185.45.98 NAMESPACE set to tg ``` Of course the actual IP address and namespace will almost certainly be different from the example here ! ---
If you manually setup the Kubernetes ingress services using helm In this case as you manually set this up you will need to get the information from Kubernetes itself - Open the OCI cloud shell - You are going to get the value of the `EXTERNAL_IP` for your environment. This is used to identify the DNS name used by an incoming connection. In the OCI cloud shell type ```bash kubectl get services -n ingress-nginx ``` ``` NAME TYPE CLUSTER-IP EXTERNAL-IP PORT(S) AGE ingress-nginx-controller LoadBalancer 10.96.182.204 130.162.40.241 80:31834/TCP,443:31118/TCP 2h ingress-nginx-controller-admission ClusterIP 10.96.216.33 443/TCP 2h ``` - Look for the `ingress-nginx-controller` line and note the IP address in the `EXTERNAL-IP` column, in this case that's `130.162.40.121` but it's almost certain that the IP address you have will differ. IMPORTANT, be sure to use the IP in the `EXTERNAL-IP` column, ignore anything that looks like an IP address in any other column as those are internal to the OKE cluster and not used externally. - IN the OCI CLoud shell type the following, replacing `[external ip]` with the IP address you retrieved above. ```bash export EXTERNAL_IP=[external ip] ``` --- </details> </details> ## Task 2: Setting up Elastic search To process log data in a consistent manner we need to get all of the data into one place. We're going to use [fluentd](https://www.fluentd.org/) to capture the data and send it to an Elastic search instance deployed in our Kubernetes cluster in the initial example below, but there are many other options. ### Task 2a: Configuring the environment for the elastic search install As with elsewhere in the labs we'll do this module in it's own namespace, so first we have to create one. 1. In the cloud console type ```bash kubectl create namespace logging ``` ``` namespace/logging created ``` Now let's use helm to install the elastic search engine into the logging namespace 2. First add the Elastic helm chart repository. ```bash helm repo add elastic https://helm.elastic.co ``` ``` "elastic" has been added to your repositories ``` 3. Update the repository cache ```bash helm repo update ``` ``` Hang tight while we grab the latest from your chart repositories... ...Successfully got an update from the "ingress-nginx" chart repository ...Successfully got an update from the "kubernetes-dashboard" chart repository ...Successfully got an update from the "elastic" chart repository Update Complete. ⎈ Happy Helming!⎈ ``` 4. Make sure you are in the right environment which holds the yaml files ```bash cd $HOME/helidon-kubernetes/management/logging ``` ### Task 2b: Setting up the security for the elastic search install The default configuration for the elastic service does not have any password protection. For demo purposes this might be OK, but we **are** on the internet and so should use something more secure (and of course you **must** use a strong password in a production environment!) First let's create a password file for the admin user. In the example below I'm using `ZaphodBeeblebrox` as the password, but please feel free to change this if you like 1. In the OCI Cloud Shell type ```bash htpasswd -c -b auth admin ZaphodBeeblebrox ``` ``` Adding password for user admin ``` Now having create the password file we need to add it to Kuberntes as a secret so the ingress controller can use it. 2. In the OCI Cloud Shell type ```bash kubectl create secret generic web-ingress-auth -n logging --from-file=auth ``` ``` secret/web-ingress-auth created ``` 3. Let's create the certificate for this service. In the OCI cloud shell type the following. ```bash $HOME/keys/step certificate create search.logging.$EXTERNAL_LP.nip.io tls-search-$EXTERNAL_IP.crt tls-search-$EXTERNAL_IP.key --profile leaf --not-after 8760h --no-password --insecure --kty=RSA --ca $HOME/keys/root.crt --ca-key $HOME/keys/root.key ``` ``` Your certificate has been saved in tls-search-123.456.789.123.crt. Your private key has been saved in tls-search-123.456.789.123.key. ``` (The above is example output, your files will be based on the IP you provided) If your output says it's created key files like `tls-search.crt` and does not include the IP address then the `EXTERNAL_IP` variable is not set, please follow the instructions in Task 1 and re-run the step certificate creation command 4. Create the tls secret from the certificate. In the OCI cloud shell type the following., as usual you must replace `` with the IP address of the ingress controller ```bash kubectl create secret tls tls-search --key tls-search-$EXTERNAL_IP.key --cert tls-search-$EXTERNAL_IP.crt -n logging ``` ``` secret/tls-search created ``` ### Task 2c: Installing elastic search 1. Now we can actually install elastic search. In the cloud console type the following. ```bash helm install elasticsearch elastic/elasticsearch --namespace logging --version 8.5.1 --set ingress.enabled=true --set ingress.tls[0].hosts[0]="search.logging.$EXTERNAL_IP.nip.io" --set ingress.tls[0].secretName=tls-search --set ingress.hosts[0].host="search.logging.$EXTERNAL_IP.nip.io" --set ingress.hosts[0].paths[0].path='/' --set ingress.annotations."nginx\.ingress\.kubernetes\.io/auth-type"=basic --set ingress.annotations."nginx\.ingress\.kubernetes\.io/auth-secret"=web-ingress-auth --set ingress.annotations."nginx\.ingress\.kubernetes\.io/auth-realm"="Authentication Required" ``` ``` NAME: elasticsearch LAST DEPLOYED: Wed Jul 21 13:16:34 2021 NAMESPACE: logging STATUS: deployed REVISION: 1 NOTES: 1. Watch all cluster members come up. $ kubectl get pods --namespace=logging -l app=elasticsearch-master -w 2. Test cluster health using Helm test. $ helm test elasticsearch ``` There are a lot of options in this command, this is because the elastic search helm stack is written slightly differently from some of the others we've used so far (it doesn't have a single "Set up an ingress" option) so we need to define the ingress host and tls details more precisely. Additionally to protect thge actuall elastic search service we are also specifying the annotations to make the ingress controller ask for a security password. Let's check on the installation, note that is can take a few mins for the elastic search to be loaded and installed. 2. In the cloud console type ```bash kubectl get all -n logging ``` ``` NAME READY STATUS RESTARTS AGE pod/elasticsearch-master-0 1/1 Running 0 4m57s pod/elasticsearch-master-1 1/1 Running 0 4m57s pod/elasticsearch-master-2 0/1 Pending 0 4m57s NAME TYPE CLUSTER-IP EXTERNAL-IP PORT(S) AGE service/elasticsearch-master ClusterIP 10.96.76.71 9200/TCP,9300/TCP 4m58s service/elasticsearch-master-headless ClusterIP None 9200/TCP,9300/TCP 4m58s NAME READY AGE statefulset.apps/elasticsearch-master 2/3 4m58s ``` 3. We can check that the software has been installed by using the helm test command. In the OCI cloud shell type ```bash helm test elasticsearch -n logging ``` ``` Pod elasticsearch-qepig-test pending Pod elasticsearch-qepig-test pending Pod elasticsearch-qepig-test pending Pod elasticsearch-qepig-test succeeded NAME: elasticsearch LAST DEPLOYED: Wed Jul 21 13:16:34 2021 NAMESPACE: logging STATUS: deployed REVISION: 1 TEST SUITE: elasticsearch-qepig-test Last Started: Wed Jul 21 13:24:23 2021 Last Completed: Wed Jul 21 13:24:25 2021 Phase: Succeeded NOTES: 1. Watch all cluster members come up. $ kubectl get pods --namespace=logging -l app=elasticsearch-master -w 2. Test cluster health using Helm test. $ helm test elasticsearch ``` ### Task 2d: Accessing the service 
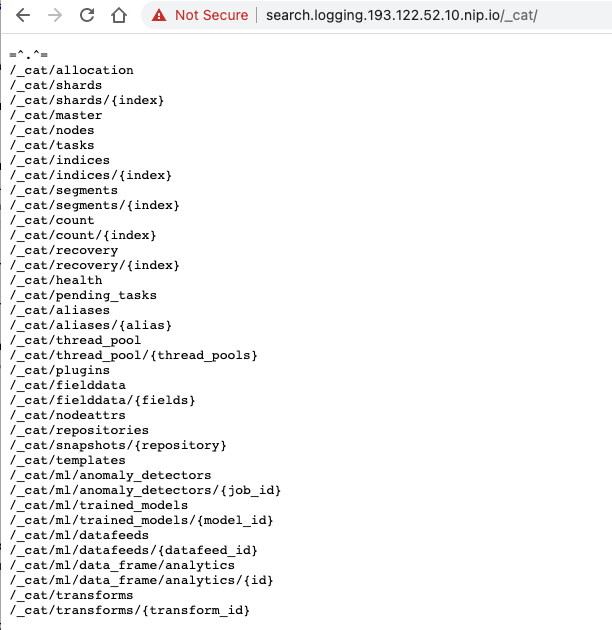
1. In a web browser go to the web page `https://search.logging..nip.io/_cat` (replace `External IP>` with your ingress controller IP address) If you get a 503 or 502 error this means that the elastic search service is still starting up. Wait a short time then retry. 2. If needed in the browser, accept a self signed certificate. The mechanism varies by browser and version, but as of September 2020 the following worked with the most recent (then) browser version. - In Safari you will be presented with a page saying "This Connection Is Not Private" Click the "Show details" button, then you will see a link titled `visit this website` click that, then click the `Visit Website` button on the confirmation pop-up. To update the security settings you may need to enter a password, use Touch ID or confirm using your Apple Watch. - In Firefox once the security risk page is displayed click on the "Advanced" button, then on the "Accept Risk and Continue" button - In Chrome once the "Your connection is not private" page is displayed click the advanced button, then you may see a link titled `Proceed to ....(unsafe)` click that. We have had reports that some versions of Chrome will not allow you to override the page like this, for Chrome 83 at least one solution is to click in the browser window and type the words `thisisunsafe` (copy and past doesn't seem to work, you need to actually type it). Alternatively use a different browser. 
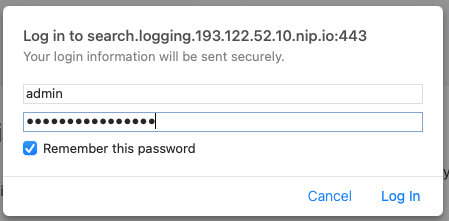
3. When prompted enter the username of `admin` and the password you chose when you setup the credentials (we suggested `ZaphodBeeblebrox` but if you chose your own you'll need to use that). ![Entering the password to access our elastic service](/cloudtestdrive/AppDev/cloud-native/kubernetes/management/logging/images/ES-enter-password.png) We can see that the elastic search service is up and running, let's see what data it holds ![List of elastic endpoints](/cloudtestdrive/AppDev/cloud-native/kubernetes/management/logging/images/ES-catalogue-endpoints.png) 4. In a web browser go to `http:///_cat/indices` (remember to substitute **your** external IP address) look at the indices in the service ![There are currently no indicies in the elastic storage](/cloudtestdrive/AppDev/cloud-native/kubernetes/management/logging/images/ES-no-indices.png) 
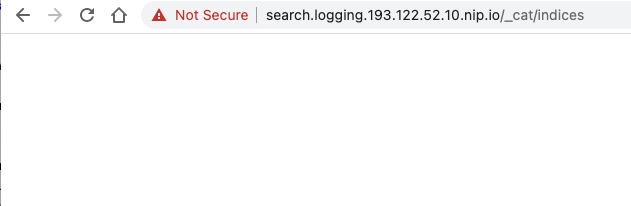
Well, it's empty! Of course that shouldn't be a surprise, we've not put any log data in it yet! ### Task 2e: Capturing the log data from the micro-services Kubernetes writes the log data it captures to files on the host that's running the node. To get the data we therefore need to run a program on every node that accesses the log files and sends them to the storage (elastic search in this case) So far we've just asked Kubernetes to create deployments / replica sets / pods and it's determined the node they will run based on the best balance of availability and resources, how do we ensure that we can run a service in each node ? Well the daemonset in Kubernetes allows the definition of a pod that will run on every node in the cluster, we just have to define the daemonset and the template of the pod that's going to do the work and Kubernetes will deal with the rest, ensuring that even if nodes are added or removed that a pod matching the daemonset definition is running on the node.
Other benefits of using daemon sets The daemon set is a separate pod, running with it's own set of resources, thus while it does consume resources at the node and cluster level it doesn't impact the performance of the pods it's extracting log data for. Additionally the daemon set can look at the log data for all of the pods in the node, if we did the logging within a pod (say by replacing the log processor or your micro-service) then you'd have to modify every pod, but by logging it to standard out and using a deamonset you can capture the data of all of the logs at the same time, and only need to make changes in a single place. ---
Why run the data gathering in a pod ? Well why not ? While we could run the data capture process by hand manually on each node then we'd have to worry about stopping and starting the service, restarting if it fails, managing and updating configuration files and so on. If we just run it in a Kubernetes pod we can let Kubernetes do all of it's magic for us and we can focus on defining the capture process, and leave running it to Kubernetes! How will our capture pod get the log data though ? We've seen previously how we can use volumes to bring in a config map or secret to a pod and make it look like it's part of the local file system, well there are several other types of source for a volume (in the Prometheus section we briefly saw how helm setup an external storage object as a volume for storing the data). One of the volume types provides the ability to bring in a local file system, in this case in the node as part of the pods file structure. Fluentd is an open source solution to processing the log data, it's basically an engine, reading data from input sources and sending them to output sources (that's more complicated than you'd think when dealing with potentially large numbers of high volume sources). it supports multiple input sources, including reading log files saved from the containers by Kubernetes (imported from the node into the pods via a volume) It also supports many output types. We will be using the output that writes to elastic search, this does all the work of creating indices for us and storing the data for each day. There are a number of yaml daemonset configuration files at the [fluentd daemonset github](https://github.com/fluent/fluentd-kubernetes-daemonset) We will be using a modified version of the `fluentd-daemonset-elasticsearch-rbac.yaml` configuration. What are the modifications ? We are telling fluentd the DNS name of the elastic search service. In this case that's `elasticsearch-elasticsearch-master.logging.svc` As we've seen previously the Kubernetes service makes this available on it's internal DNS service and distributes requests across all of the pods that are ready in the service. We need to tell fluentd to ignore the systemd that's running in it's own pod, the base images used by fluentd no longer supports systemd, and if we didn't disable it we'd just get a bunch of log messages complaining that it can't access the service. We have added a volume mount entry and associated volume to bring in the log files. In the case of the OKE installation of Kubernetes those are located in /var/log/containers, but that's actually a link to their real location in /u01/data/docker/containers Finally we have changes the namespace from kube-system to logging, this is really just for convenience as this is an optional lab module, and we didn't want to complicate following modules with text along the lines of "If you've done the logging module you'll see xxxx in kube-system, but if you haven't you'll see yyyy" Also it's generally good practice to separate things by their function. **IMPORTANT** In Kubernetes 1.20 the default container engine switched from Docker to CRI-O, Docker logs were written in JSON format, wheras CRI-O uses a format called Logrus. This lab module has been updated to work with the 1.20 CRI-O log format, but if you are using a version of Kubernetes with Docker as the container engine (Kubernetes removed Docker support in 1.20, so this is probabaly 1.19 or earlier) you will need to modify `fluentd-daemonset-elasticsearch-rbac.yaml` and remove the following lines in the container environment section. ``` - name: FLUENT_CONTAINER_TAIL_PARSER_TYPE value: "cri" - name: FLUENT_CONTAINER_TAIL_PARSER_TIME_FORMAT value: "%Y-%m-%dT%H:%M:%S.%N%:z" ``` Let's create the daemonset 1. Make sure you are in the logging scripts directory ```bash cd $HOME/helidon-kubernetes/management/logging ``` 2. In the OCI Cloud Shell terminal type ```bash kubectl apply -f fluentd-daemonset-elasticsearch-rbac.yaml ``` ``` serviceaccount/fluentd created clusterrole.rbac.authorization.k8s.io/fluentd created clusterrolebinding.rbac.authorization.k8s.io/fluentd created daemonset.apps/fluentd created ``` 3. Let's make sure that everything has started. In the OCI Cloud Shell type ```bash kubectl get daemonsets -n logging ``` ``` NAME DESIRED CURRENT READY UP-TO-DATE AVAILABLE NODE SELECTOR AGE fluentd 3 3 3 3 3 3m4s ``` We can see that there are 3 pods, why 3 ? That's the number of nodes in the cluster I was using to create this module, and the daemonset runs one pod on each node. If your cluster has a different number of nodes the number of pods will of course vary. Let's look at the distribution of the fluent instances, we could do this using kubectl commands, for example ```bash kubectl get nodes ``` ``` NAME STATUS ROLES AGE VERSION 10.0.10.2 Ready node 8d v1.15.7 10.0.10.3 Ready node 8d v1.15.7 10.0.10.4 Ready node 8d v1.15.7 ``` But it's easier to see what's happening using the Kubernetes dashboard in this case. Open the Kubernetes dashboard 4. In a web browser on your laptop go to the dashboard `https://dashboard.kube-system..nip.io/#!/login` (remember to replace `<External IP` with your IP address) 5. If prompted in the browser, accept the self signed certificate. The mechanism varies by browser and version, but as of September 2020 the following worked with the most recent (then) browser version. - In Safari you will be presented with a page saying "This Connection Is Not Private" Click the "Show details" button, then you will see a link titled `visit this website` click that, then click the `Visit Website` button on the confirmation pop-up. To update the security settings you may need to enter a password, use Touch ID or confirm using your Apple Watch. - In Firefox once the security risk page is displayed click on the "Advanced" button, then on the "Accept Risk and Continue" button - In Chrome once the "Your connection is not private" page is displayed click the advanced button, then you may see a link titled `Proceed to ....(unsafe)` click that. We have had reports that some versions of Chrome will not allow you to override the page like this, for Chrome 83 at least one solution is to click in the browser window and type the words `thisisunsafe` (copy and past doesn't seem to work, you need to actually type it). Alternatively use a different browser. If you are presented with the login page use the Token option and the dashboard user token you got previously 6. Click on the **nodes** option in the **cluster** section of the UI menu on the left ![Accessing the list of worker nodes form the Kubernetes dashboard](/cloudtestdrive/AppDev/cloud-native/kubernetes/management/logging/images/dashboard-nodes-menu.png) You'll see the list of nodes ![List of worker nodes in the dashboard](/cloudtestdrive/AppDev/cloud-native/kubernetes/management/logging/images/dashboard-nodes-list.png) I used a different cluster to get this screen grab and it had two nodes, so there are two entries, but yours may have a different number of nodes, and thus entries. In the Oracle Kubertnetes Environment the nodes are names based on their IP address, so 10.0.10.2, 10.0.10.3, and 10.0.10.4 in the case of this cluster. 7. Click on one of the node names, in this case I chose the 10.0.10.2 node ![Details of a worker node in the dashboard](/cloudtestdrive/AppDev/cloud-native/kubernetes/management/logging/images/dashboard-node-details.png) The dashboard is showing the overview of the node, if we scroll down further we'll see the list of the pods running on it (your list will vary from this one). ![List of pods running on our node](/cloudtestdrive/AppDev/cloud-native/kubernetes/management/logging/images/dashboard-node-pods.png)ES-no-indices The fluentd pod is running, along with a number of others, for example the elastic search pods, others are system pods, and our application. If you look at all of the other nodes you'll find that there is a fluentd pod on all of them, even though the other services like storefront or stockmanager aren't running on them all (well unless you've told Kubernetes to run multiple instances of the pod) ## Task 3: Looking the the data If we go back and look at the Elastic search list of indices now we can see that some data has been added (the `?v=true` means that column headings are included the the returned data 1. In a web browser go to the web page `https://search.logging..nip.io/_cat/indices?v=true` (remember to replace ` with your IP address) ![List of elastic indicies](/cloudtestdrive/AppDev/cloud-native/kubernetes/management/logging/images/ES-some-indicies.png) There is an index for each days data. In this case I had started the services yesterday, so data for two days was added (all the existing data in the logs is copied across, not just the new data after fluentd was started) however you may well see only a single entry. We can have a look at the data from a specific day I've used the index for the data gathered most recently, as can be seen in the index listing that's `logstash-2020.04.23` **but yours will be different** 2. Let's look at the captured data. Look at the indecies list and chose one 3. Go to the `_search` URL`https://search.logging..nip.io/logstash-/_search` (remember to replace `` address with yours) replace `` with one of the entries in the indexes list). **Important** Different web browsers will render the resulting JSON differently, this will also depend on the plugins in the browser, so do not be concerned if the output varies and is pure JSON data or is structured as in the image below) ![Output from a quick log query](/cloudtestdrive/AppDev/cloud-native/kubernetes/management/logging/images/ES-quick-log-query.png) There's a lot of data here (and depending on which browser you use it may be nicely formated, or a pure text dump) but this has been running most of the day as I wrote this module, most interesting is that in the hits.total section we can see that there were 66177 entries, and we can see that (in this case) entry 0 is a warning from fluentd about the log data generated by the coredns container. Of course we can focus in on specific entries if we want, in this case we're going to look for entries which have the container_name of storefront 4. Try this URL `https://search.logging..nip.io/logstash-/_search?q=kubernetes.container_name:storefront` to focus on the storefront container (remember to replace `` address with yours) repalce `` to one of the entries in the indexes list). ![Searching on the storefront logs](/cloudtestdrive/AppDev/cloud-native/kubernetes/management/logging/images/ES-search-empty-storefront.png) It may be empty, or you may get log messages (will really depend on if you've used it on the chosen day) If you haven't generated any log messages from the storefront container since we setup up the log capture just do some requests to the stock manager service which will generate log data 5. In the OCI Cloud Shell terminal type. ```bash curl -i -k -X GET -u jack:password https://store.$EXTERNAL_IP.nip.io/store/stocklevel ``` ``` HTTP/1.1 200 OK Server: nginx/1.17.8 Date: Thu, 23 Apr 2020 18:38:50 GMT Content-Type: application/json Content-Length: 149 Connection: keep-alive Strict-Transport-Security: max-age=15724800; includeSubDomains [{"itemCount":100,"itemName":"Book"},{"itemCount":50,"itemName":"Eraser"},{"itemCount":500,"itemName":"Pencil"},{"itemCount":5000,"itemName":"Pins"}] ``` If you get a DNS error that `store..nip.io` cannot be found this means that `EXTERNAL_IP` is not set, follow the instructions above to set it. Hopefully you did have it set when you installed Elastic !. 6. Do this several times, then look at the log URL again ![Viewing the log data from the storefront](/cloudtestdrive/AppDev/cloud-native/kubernetes/management/logging/images/ES-search-storefront-data.png) Now you will can see that there is data in the system, there were 12 hits. You may have seen that the data arrived into the elastic search index pretty fast, fluentd is monitoring the log files all the time, in my testing it's usually less than a second between the log data being generated and the data being in the logs cache, though of course that can very. ## Task 4: Monolith and other log capture options ### How do I handle my Monoliths logging ? It's quite possible (even probable) that you have elements of your overall service that are not running in micro-services in Kubernetes. To capture the log data from those applications you can run fluentd on the operating systems of the environments running them. In the case of some logging frameworks there may even be the ability to send log data direct to a central fluentd server. Of course fluentd is not the only logging solution out there, and elastic search is not the only data storage option, after all you could also write data to an Oracle data warehouse and analyze it using Oracle Analytics! ### Other log capture options Fluentd itself supports many other output plugins for writing the data, including to the OCI Object Storage service, or other services which provide a S3 compatible. We will see in the log capture for archive section how to use those. ## Task 5: Log data processing Once the data has been captured there needs to be analysis of it, as we saw before it's possible to extract specific records from the storage (and far more complex queries can be constructed than those shown) but for proper data analysis we need additional tools. The usage of these tools is outside the scope of this lab, (and as you've only been gathering data for a short time period there just isn't enough log data to perform an analasys on). The process of data ingest and analysis is specific to the particular tool, though many can retrieve data from elasticsearch or a storage bucket, but here are some tools you may like to consider. One such tool that is often used in conjunction with elastic search is Kibana, which is developed by the company that owns Elasticsearch. It's important to note that though parts of Kibana are open source not all the functionality is covered by the open source license, even though it may be in the Kibana container image. You must be careful to follow the licensing restrictions and of course only use the features you have access to either under the open source license or via a [license or subscription.](https://www.elastic.co/subscriptions) The Oracle Log Analytics cloud service can be used when processing logs from many sources including on-premise and in the cloud. It's capable of [taking data direct from fluentd](https://docs.oracle.com/en/cloud/paas/management-cloud/logcs/use-fluentd-log-collection.html) or via the Oracle Object Storage Service. The Kubernetes documentation has a [section covering logging](https://kubernetes.io/docs/concepts/cluster-administration/logging/) ## Task 6: Tidying up the environment If you are in a trial tenancy there are limitations on how many resources you can have in use at any time, and you may need them for other modules. The simplest way to release the resources used in this module is to delete the entire namespace. 1. In the OCI Cloud shell type ```bash kubectl delete namespace logging ``` ``` namespace "logging" deleted ``` ## Summary You've seen that the capture of Log data for Kubernetes hosted microservices is pretty easy, but so far we haven't done a lot of processing of the log data, and though we've seen we can extract the data this approach is not very useful unless you want to look at the specifics of a single log message. Although we haven't looked at the analysis of log data there are many tools available to help with that. ## End of the module, what's next ? You can chose from the various Kubernetes optional module sets. ## Acknowledgements * **Author** - Tim Graves, Cloud Native Solutions Architect, Oracle EMEA Cloud Native Application Development specialists Team * **Contributor** - Jan Leemans, Director Business Development, EMEA Divisional Technology * **Last Updated By** - Tim Graves, May 2023