Set up the cluster and get your services running in Kubernetes
Self guided student - video introduction
This video is an introduction to the Kubernetes core features lab. Depending on your browser settings it may open in this tab / window or open a new one. Once you've watched it please return to this page to continue the labs.
[](https://youtu.be/kc1SvmTbvZ8 "Kubernetes core features lab introduction video")
---
Introduction
This is one of the core Kubernetes labs
Estimated module duration 45 mins.
Objectives
This module takes you through the process of setting up your environment for the Kubernetes labs (including the optional labs)
Prerequisites
If you are doing the full labs (these include modules on Helidon and Docker) you need to have completed the tasks in the Helidon modules (including the setup)
If you are only doing the Kubernetes based labs you need to have completed the tasks in the Tenancy Setup for the Kubernetes Labs module.
In both cases you need to complete the Create your Kubernetes cluster and Cloud Shell Setup for the Kubernetes Labs modules.
Copy tags
In many cases in this lab you will find text in a box with a Copy label which is text you may need to execute in the cloud shell or enter into a file.
<copy>echo "For example like this echo command"</copy>
Clicking the Copy will copy the text to the clip board, this will make it easier for you to simply paste it into the shell to do the lab.
However… in some cases the commands you’d need to type will vary from the commands shown (for example a different identifier). Obviously in this case just pasting text that has been copied will not work as these need to be changed. Usually in those cases though the command will be given as an example there will not be a Copy box present - this indicates that you will need to modify the command to make it work.
Of course in some cases what you will see is example output from a program or a file, from the context it shoudl be clear that this is not somethign you will need to enter into a shell.
Task 1: Configure the Helm repository
Helm is the tool we will be using to install standard software into Kubernetes. While it’s possible to load software into Kubertetes by hand Helm makes it much easier as it has pre-defined configurations (called charts) that it pulls from an internet based repository.
The OCI Cloud Shell has helm already installed for you, however it does not know what repositories to use for the helm charts. We need to tell helm what repositories to use.
Add the Kubernetes nginx based ingress repo to helm
“ingress-nginx” has been added to your repositories
  2. Run the following command to add the dashboard repo to helm

  ```bash
  <copy>helm repo add kubernetes-dashboard https://kubernetes.github.io/dashboard</copy>
"kubernetes-dashboard" has been added to your repositories
To can get the current list of repositories run the following command :
<copy>helm repo list</copy>
NAME                    URL
ingress-nginx           https://kubernetes.github.io/ingress-nginx
kubernetes-dashboard    https://kubernetes.github.io/dashboard
Lastly let’s update the helm cache, run the following command :
<copy>helm repo update</copy>
Hang tight while we grab the latest from your chart repositories...
...Successfully got an update from the "ingress-nginx" chart repository
...Successfully got an update from the "kubernetes-dashboard" chart repository
Update Complete. ⎈ Happy Helming!⎈
Task 2: Getting your cluster access details
Access to the cluster is managed via a config file that by default is located in the $HOME/.kube folder, and is called config.
If you used the scripts to create your OKE cluster this will have been configured for you.
Verify you can access the cluster:
<copy>kubectl get nodes</copy>
NAME        STATUS   ROLES   AGE     VERSION
10.0.10.2   Ready    node    9m16s   v1.16.8
10.0.10.3   Ready    node    9m2s    v1.16.8
Of course the details and number of nodes will vary depending on the settings you set when you created the cluster, be warned it may take a few mins for the nodes to be configured after the cluster management is up and running, so if you get a No resources found. message try again in a short while.
How would I get the config file by hand ?
To check the setup, make sure to have copied your personal kubeconfig file to this location :
1. Create a directory for the Kubernetes config
```bash
mkdir -p $HOME/.kube
```
2. Open the OCI Console UI
3. Open the "Hamburger" menu on the upper left scroll down to the **Solutions and Platform** section
4. Click on the **Developer Services** menu option, then **Kubernetes Clusters**
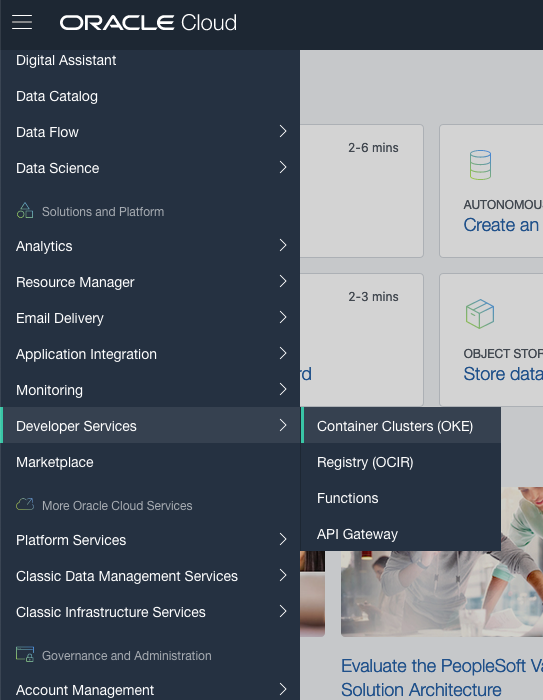
5. Locate **your** cluster in the list, this will be the one you've been assigned or the one you just created. Click on the name to get to the cluster details.
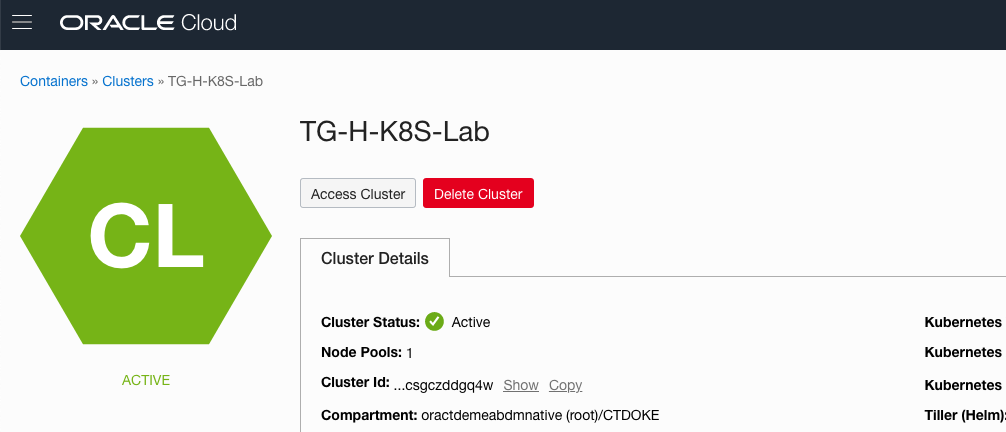
6. Click the **Accesss Cluster** button to get the configuration for **your** cluster.
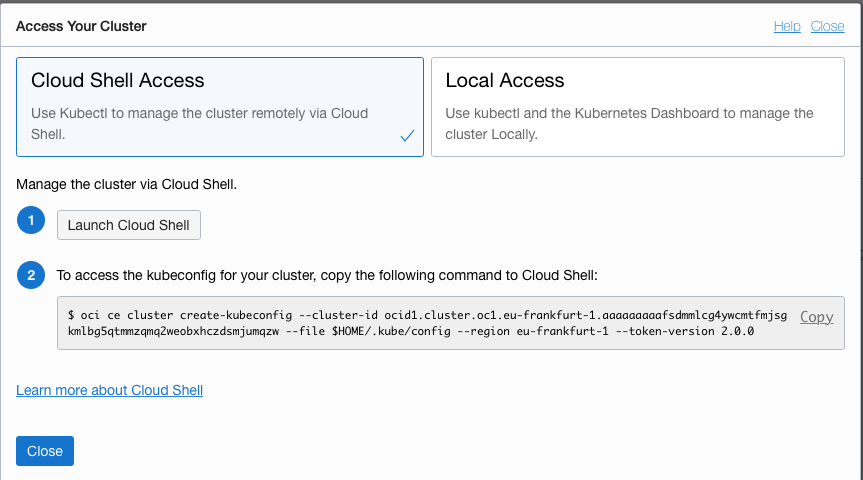
You will be presented with a page with details for downloading the kubeconfig file. Make sure the **OCI Cloud Shell Access** is the selected option.
Look for the section with the download command, it will look something like this (yours of course will have a different OCID)
```bash
oci ce cluster create-kubeconfig --cluster-id ocid1.cluster.oc1.eu-frankfurt-1.abababababj472oaexzkmkvm5lsue2usqfkrcizupdx64o2qg4dcsvt62fhrgq --file $HOME/.kube/config --region eu-frankfurt-1 --token-version 2.0.0 --kube-endpoint PUBLIC_ENDPOINT
```
7. Click the **Copy** to get *your* config download script (the above is an example and won't work for real)
8. Open your OCI Cloud Shell window and **paste** the line to execute it.
```
New config written to the kubeconfig file /home/oracle/.kube/config
```
Note that if there was an existing Kubernetes config file (most likely because you're using an existing tenancy) then the output will say
```
Existing kubeconfig file found at /home/oracle/.kube/config and new config merged into it
```
9. Set the config file to be accessible only by you (This stops warnings from helm about it having the wrong permissions)
```bash
chmod 600 $HOME/.kube/config
```
10. Verify you can access the cluster:
```bash
kubectl get nodes
```
```
NAME STATUS ROLES AGE VERSION
10.0.10.2 Ready node 9m16s v1.16.8
10.0.10.3 Ready node 9m2s v1.16.8
```
If the kubectl command returns `No resources found.` and you have only just created the cluster it may still be initializing the worker nodes (They have to be created, the OS installed and then the Kubernetes software installed before they report ready). Wait a short time and try again until you get the nodes list.
Your Kubernetes config file is now downloaded into the `.kube/config` file. It's stored as a context and in situations where you have multiple kubernetes clusters it's possible to use the name of the context to target a kubectl command at a specific cluster.
11. In the OCI cloud shell type
```bash
kubectl config get-contexts
```
```
CURRENT NAME CLUSTER AUTHINFO NAMESPACE
* context-czpet5do3oq cluster-czpet5do3oq user-czpet5do3oq default
```
Of course this is an example from when I ran the command in my environment, the details returned will be different in your case.
If you are in an environment where you have multiple clusters in use and their kubectl config downloaded you will see multiple entries here. The current context (indicated by the `*` in the `CURRENT` column) is the one that will be used if you don't target a kubectl command at a specific cluster using it's context name. Of course if you were running with multiple clusters having to type `context-czpet5do3oq` every time would be painful, and it's not exactly memorable either, so let's rename it to something easier to work with.
12. In the OCI Cloud shell type the following, replace `[Context name]` with the context name you just got for your cluster, I'd recommend copy-and-paste ! The output shows it when the context is names `context-czpet5do3oq` as in my example above.
```bash
kubectl config rename-context [Context name] one
```
```
Context "context-czpet5do3oq" renamed to "one".
```
13. Let's look at the updated info. In the OCI clouds shell type :
```bash
kubectl config get-contexts
```
```
CURRENT NAME CLUSTER AUTHINFO NAMESPACE
* one cluster-czpet5do3oq user-czpet5do3oq default
```
Now whenever we run a kubectl command it will run against the default cluster. If we did have multiple clusters then we may need to use the non default cluster, so to specify the cluster we just use `--context=` (e.g. `--context=one`) to specify the context and thus kubernetes cluster to target the command to (if you are frequently switching between clusters this is good practice to do always as it will be clear to you which cluster you are working on). Fortunately for us by the most recent context added to the kubectl config file is used as a default, so in the vast majority of steps in this lab you don't need to specify the context at all - we've only made the changes here to make things easier in case you decide to do some of the lab steps where multiple clusters are needed.
</details>
## Task 3: Basic cluster infrastructure services install
Usually a Kubernetes cluster comes with only the core Kubernetes services installed that are needed to actually run the cluster (e.g. the API, DNS services). Some providers also give you the option of installing other elements, but here we're going to assume you have a minimal cluster with only the core services and will need to setup the other services before you run the rest of the system.
For most standard services in Kubernetes Helm is used to install and configure not just the pods, but also the configuration around them. Helm has templates (called charts) that define how to install potentially multiple services and to set them up.
The latest version of helm is helm 3. This is a client side only program that is used to configure the Kubernetes cluster with the services you chose. If you're familiar with previous versions of helm you will know about the cluster side component "tiller". This is no longer used in Helm 3
Fortunately for us helm 3 is installed within the OCI Cloud Shell, but if later on you want to use your own laptop to manage a Kubernetes cluster [here are the instructions for a local install of helm](https://helm.sh/docs/intro/install/)
### Task 3a: Starting an Ingress controller for accepting external data
There is a core service we need to install before we can start running the web based system services, or indeed our microservices, the Ingress controller. An Ingress controller provides the actual ingress capability, but it also needs to be configured (we will look at that later).
An Ingress in Kubernetes is one mechanism for external / public internet clients to access http / https connections (and thus REST API's) It is basically a web proxy which can process specific URL's forwarding data received to a particular microservice / URL on that microservice.
Ingresses themselves are a Kubernetes service, they do however rely on the Kubernetes environment to support a load balancer to provide the external access. As a service they can have multiple instances with load balancing across them etc. as per any other Kubernetes service.
The advantage of using an ingress compared to a load balancer is that as the ingress understands the payload a single ingress service can support connections to multiple microservices (we'll see more on this later) whereas a load balancer just forwards data on a single port to a specific destination. As commercially offered Kubernetes environments usually charge per load balancer this can be a significant cost saving. However, because it is a layer 7 (http/https) proxy it can't handle raw TCP/UCP connections (for those you need a load balancer)
Though an Ingress itself is a Kubernetes concept Kubernetes does not itself provide a specific Ingress service, it provides a framework in which different Ingress services can be deployed, with the user chosing the service to use. Though it uses the Kubernetes configuration mechanism the actual configuration specifics of an Ingress controller unfortunately very between the different controllers.
For this lab we're going to use an nginx based Ingress controller. The nginx based Ingress controller we use here is maintained by the Kubernetes team, but there are several others that could be used in your environments if you want. There are a list of commercial and open source Ingress controllers in the [Kubernetes ingress documentation](https://kubernetes.io/docs/concepts/services-networking/ingress-controllers/)
Firstly we need to create a namespace for the ingress controller.
1. Run the following command :
```bash
kubectl create namespace ingress-nginx
```
```
namespace/ingress-nginx created
```
2. Run the following command to install **ingress-nginx** using Helm 3:
```bash
helm install ingress-nginx ingress-nginx/ingress-nginx --namespace ingress-nginx --version 4.6.1 --set rbac.create=true --set controller.service.annotations."service\.beta\.kubernetes\.io/oci-load-balancer-protocol"=TCP --set controller.service.annotations."service\.beta\.kubernetes\.io/oci-load-balancer-shape"=flexible --set controller.service.annotations."service\.beta\.kubernetes\.io/oci-load-balancer-shape-flex-min"=10 --set controller.service.annotations."service\.beta\.kubernetes\.io/oci-load-balancer-shape-flex-max"=10
```
```
NAME: ingress-nginx
LAST DEPLOYED: Fri Jul 3 12:06:33 2020
NAMESPACE: ingress-nginx
STATUS: deployed
REVISION: 1
TEST SUITE: None
NOTES:
The nginx-ingress controller has been installed.
It may take a few minutes for the LoadBalancer IP to be available.
You can watch the status by running 'kubectl --namespace ingress-nginx get services -o wide -w ingress-nginx-nginx-ingress-controller'
```
Explaining the helm options
The helm options are :
- `install` do an install operation, helm has many other operations type helm --help` for a list.
- `ingress-nginx` - the name to give the installation to it can be identified later
- `ingress-nginx/ingress-nginx` the repository and location of the helm chart (yes I know having all these ingress-nginx is confusing, but it does make sense when you get used to it)
- `--namespace ingress-nginx` The kubernetes namespace to install the software into
- `--version 4.6.1` The version of the helm chart to use to specify the install (the software version is defined in the chart, so is indirectly specified for you)
- `--set rbac.create=true` Tells the helm chart to specifiy the role based access control features, we're not really using these in this lab, but they make this a lot more secure in a production env ironment.
- `--set controller.service.annotations."service\.beta\.kubernetes\.io/oci-load-balancer-protocol"=TCP` This tells helm to set a specific attribute, in this case to be passed to OCI to create a load balancer that uses TCP and not any other protocol.
- `--set controller.service.annotations."service\.beta\.kubernetes\.io/oci-load-balancer-shape"=flexible` As above this sets a specific flag, in this case to be passed to OCI to create a load balancer which supports variable levels of throughput.
- `--set controller.service.annotations."service\.beta\.kubernetes\.io/oci-load-balancer-shape-flex-min"=10` and `--set controller.service.annotations."service\.beta\.kubernetes\.io/oci-load-balancer-shape-flex-max"=10` also set specific flags which are passed on when creating the load balancer and specify the minimum and maximum throughput for the flexible load balancer
This will install the ingress controller. We're using a 10Mbps load balancer as the free trial accounts have limits on the overall load balancer capacity, and we'll be creating some more later on.
Why are we specifying a particular chart version ?
Helm is a great tool for installing software for us, but you don't always want to install the absolute latest version of the software (which is what would happen if you didn't specify a version). There are several reasons for this :
- You may only have tested a particular version in your environment, and you don't want a later version being installed by accident which might not be compatible with other software in your environment (for example your ingress controller may not have been updated, but a helm chart might be looking to use specific annotations on the ingress controller that are not supported in that version of the ingress controller).
- Not all versions of a helm chart (and the SW it installs) are compatible with all versions of Kubernetes, this is especially true in a production environment where you may not be running the absolutely leading edge version of Kuberntes, but are focused on a version you know works for you. For example over time the `apiVersion` defined in a yaml file might switch from beta to release, and the helm chart might be updated to reflect that. If you're still running an older version of Kubernetes the new version or the chart might try and use an `apiVersion` that is not yet available in your cluster.
- You may be in a very regulated industry, for example aviation, medical or banking that have legally binding regulations which require you to maintain very tight version control of your environment.
---
Note that Helm does all the work needed here, it creates the service, deployment, replica set and pods for us and starts things running. Unless you need a very highly customised configuration using helm is **way** simpler than setting each of these individual elements up yourself.
Because the Ingress controller is a service, to make it externally available it still needs a load balancer with an external port. Load balancers are not provided by Kubernetes, instead Kubernetes requests that the external framework delivered by the environment provider create a load balancer. Creating such a load balancer *may* take some time for the external framework to provide.
7. To see the progress in creating the Ingress service type :
```bash
kubectl --namespace ingress-nginx get services -o wide ingress-nginx-controller
```
```
NAME TYPE CLUSTER-IP EXTERNAL-IP PORT(S) AGE SELECTOR
ingress-nginx-controller LoadBalancer 10.96.61.56 132.145.235.17 80:31387/TCP,443:32404/TCP 45s app.kubernetes.io/component=controller,app.kubernetes.io/instance=ingress-nginx,app.kubernetes.io/name=ingress-nginx
```
In this case we can see that the load balancer has been created and the external-IP address is available. If the External IP address is listed as `` then the load balancer is still being created, wait a short while then try the command again.
In the helm command you'll have seen a couple of `--set`` options. These are oci specific annotations (more on annotations later) which tell Kubernetes to setup the load balancer using the TLS secret we created earlier
8. **Make a note of this external IP address, you'll be using it a lot!** We'll also set a OCI Shell variable so you can reference it directly when running subsequent commands that use it, that'll make running those commands much easier ! In the OCI Shell type the following, replacing `[External IP]` with the ip address you've just got.
```bash
export EXTERNAL_IP=[External IP]
```
**IMPORTANT** Ths OCI Cloud shall variable you've just set will persist for the duration of the cloud shell session (it will "time out" after approximately 20 mins of no interaction), if you exit and re-open the browser window / tab, start using a different OCI Cloud Shell instance, or reconnect after a timeout the variable will need to be set again using the `export EXTERNAL_IP=[External IP]` you just used - if you don't then commands that use the variable will not fail, potentially silently. If you are in doubt if the variable is set then entering `echo $EXTERNAL_IP` into the cloud shell will display the IP address, if it returns nothing or an empty line then you will need to re-set the variable.
Note that in a production environment you might want to terminate the encryption in the load balancer for efficiency reasons, and also between the microservices using a service mesh (which is a later optional lab).
### Task 3b: Installing the Kubernetes dashboard
Setting up the Kubernetes dashboard (or any) service using helm is pretty easy. it's basically a simple command.
1. To install the dashboard we will be using the environment variable `EXTERNAL_IP` which we earlier set to the IP address of the Load balancer of the Ingress controller service. The variable `$EXTERNAL_IP` in the test below will be replaced by the value you set it to when the command is run. **IMPORTANT** if you have for any reason had to create a new cloud shell that variable will need to be setup again.
How to check if $EXTERNAL_IP is set, and re-set it if it's not
**To check if `$EXTERNAL_IP` is set**
If you want to check if the variable is still set type `echo $EXTERNAL_IP` if it returns the IP address you're ready to go, if not then you'll need to re-set it.
**To get the external IP address if you no longer have it**
In the OCI Cloud shell type
```bash
kubectl --namespace ingress-nginx get services -o wide ingress-nginx-controller
```
```
NAME TYPE CLUSTER-IP EXTERNAL-IP PORT(S) AGE SELECTOR
ingress-nginx-controller LoadBalancer 10.96.61.56 132.145.235.17 80:31387/TCP,443:32404/TCP 45s app.kubernetes.io/component=controller,app.kubernetes.io/instance=ingress-nginx,app.kubernetes.io/name=ingress-nginx
```
The External IP of the Load Balancer connected to the ingresss controller is shown in the EXTERNAL-IP column. If you've only just created the ingress controller it may say `Pending` in which case re-do the request after a few minutes.
**To set the variable again**
```bash
export EXTERNAL_IP=[External IP]
```
---
```bash
helm install kubernetes-dashboard kubernetes-dashboard/kubernetes-dashboard --namespace kube-system --set ingress.enabled=true --set ingress.annotations."kubernetes\.io/ingress\.class"=nginx --set ingress.hosts="{dashboard.kube-system.$EXTERNAL_IP.nip.io}" --version 6.0.7
```
```
NAME: kubernetes-dashboard
LAST DEPLOYED: Tue Jun 30 13:07:36 2020
NAMESPACE: kube-system
STATUS: deployed
REVISION: 1
TEST SUITE: None
NOTES:
*********************************************************************************
*** PLEASE BE PATIENT: kubernetes-dashboard may take a few minutes to install ***
*********************************************************************************
From outside the cluster, the server URL(s) are:
https://dashboard.kube-system.123.456.789.999.nip.io
```
Note the URL to use to access the dashboard (this is of course an example and won't work, the IP address will be the one you specified) If there is no IP address in the URL or it's incorrect then you'll need to expand the following section and complete the steps in it
What to do if your External IP Address was not set
If the variable `$EXTERNAL_IP` was not set or was set incorrectly then you will have to uninstall the dashboard and try again, this time with the right External IP
To uninstall the dashboard type
```bash
helm uninstall kubernetes-dashboard --namespace kube-system
```
It will take a short while to remove the dashboard, after which set re-try with the **correct external IP address for your ingress service**
How to check if $EXTERNAL_IP is set, and re-set it if it's not
**To check if `$EXTERNAL_IP` is set**
If you want to check if the variable is still set type
```bash
echo $EXTERNAL_IP
```
If it returns the IP address you're ready to go, if not then you'll need to re-set it.
**To get the external IP address if you no longer have it**
In the OCI Cloud shell type
```bash
kubectl --namespace ingress-nginx get services -o wide ingress-nginx-controller
```
```
NAME TYPE CLUSTER-IP EXTERNAL-IP PORT(S) AGE SELECTOR
ingress-nginx-controller LoadBalancer 10.96.61.56 132.145.235.17 80:31387/TCP,443:32404/TCP 45s app.kubernetes.io/component=controller,app.kubernetes.io/instance=ingress-nginx,app.kubernetes.io/name=ingress-nginx
```
The External IP of the Load Balancer connected to the ingresss controller is shown in the EXTERNAL-IP column. If you've only just created the ingress controller it may say `Pending` in which case re-do the request after a few minutes.
**To set the variable again**
```bash
export EXTERNAL_IP=[External IP]
```
---
---
Explaining the helm options
The helm options are :
- `install` do an install operation, helm has many other operations type helm --help` for a list.
- `kubernetes-dashboard` This is the "human" name to give the installation, it's easier to use that later on than using a machine generated one.
- `kubernetes-dashboard/kubernetes-dashboard` is the name of the *chart* to install. Helm will download the chart from the repo kubernetes-dashboard and then execute it. if you had need a specific chart version (see a few lines down) then you could have added a version specifier, for example `--version=1.2.3`
- `--namespace kube-system` This tells helm to install the dashboard into the kube-system namespace. Namespaces are ways of partitioning the physical cluster into a virtual cluster to help you manage related resources, they are similar to the way you organize files using folders on your computer, but can also restrict resource usage like memory and cpu and future versions of Kubernetes plan to support role based access controls based on namespaces.
- `--set ingress.enabled=true`, `--set ingress.annotations."kubernetes\.io/ingress\.class"=nginx` and `--set ingress.hosts='{dashboard.kube-system.158.101.210.253.nip.io}'` These tell helm to configure an ingress rule, this basically tells the nginx ingress controller we installed earlier how to identify requests to the dashboard, and send them to the dashboard service.
- `--version 6.0.7` This tells helm to use a specific version of the helm chart.
---
2. Check the staus of the Helm deployment
```bash
`helm list --namespace kube-system
```
```
NAME NAMESPACE REVISION UPDATED STATUS CHART APP VERSION
kubernetes-dashboard kube-system 1 2021-10-04 14:56:39.913725424 +0000 UTC deployed kubernetes-dashboard-5.0.0 2.3.1
```
We've seen it's been deployed by Helm, this doesn't however mean that the pods are actually running yet (they may still be downloading)
3. Check the status of the objects created:
```bash
kubectl get all --namespace kube-system
```
```
NAME READY STATUS RESTARTS AGE
pod/coredns-78f8cf49d4-8pq5c 1/1 Running 0 3d23h
pod/kube-dns-autoscaler-9f6b6c9c9-76tw5 1/1 Running 0 3d23h
pod/kube-flannel-ds-5kn8m 1/1 Running 1 3d23h
pod/kube-flannel-ds-bqmct 1/1 Running 1 3d23h
pod/kube-proxy-dlpln 1/1 Running 0 3d23h
pod/kube-proxy-tzgzp 1/1 Running 0 3d23h
pod/kubernetes-dashboard-bfdf5fc85-djnvb 1/1 Running 0 66s
pod/proxymux-client-b8cdk 1/1 Running 0 3d23h
pod/proxymux-client-dnzv8 1/1 Running 0 3d23h
NAME TYPE CLUSTER-IP EXTERNAL-IP PORT(S) AGE
service/kube-dns ClusterIP 10.96.5.5 53/UDP,53/TCP,9153/TCP 3d23h
service/kubernetes-dashboard LoadBalancer 10.96.104.87 158.101.177.127 443:32169/TCP 66s
NAME DESIRED CURRENT READY UP-TO-DATE AVAILABLE NODE SELECTOR AGE
daemonset.apps/kube-flannel-ds 2 2 2 2 2 beta.kubernetes.io/arch=amd64 3d23h
daemonset.apps/kube-proxy 2 2 2 2 2 beta.kubernetes.io/os=linux 3d23h
daemonset.apps/nvidia-gpu-device-plugin 0 0 0 0 0 3d23h
daemonset.apps/nvidia-gpu-device-plugin-1-8 0 0 0 0 0 3d23h
daemonset.apps/proxymux-client 2 2 2 2 2 node.info.ds_proxymux_client=true 3d23h
NAME READY UP-TO-DATE AVAILABLE AGE
deployment.apps/coredns 1/1 1 1 3d23h
deployment.apps/kube-dns-autoscaler 1/1 1 1 3d23h
deployment.apps/kubernetes-dashboard 1/1 1 1 66s
NAME DESIRED CURRENT READY AGE
replicaset.apps/coredns-78f8cf49d4 1 1 1 3d23h
replicaset.apps/kube-dns-autoscaler-9f6b6c9c9 1 1 1 3d23h
replicaset.apps/kubernetes-dashboard-bfdf5fc85 1 1 1 66s
```
We see all the elements of the dashboard: a pod, a replica set, a deployment and a service.
If you want more detailed information then you can extract it, for example to get the details on the pods do the following
4. Execute below command, replacing the ID with the ID of your pod. You can get the ID of your pod by looking at the output from the previous kubectl command, in the pods list for a pod starting kubernetes-dashboard.
```bash
kubectl get pod kubernetes-dashboard-bfdf5fc85-djnvb -n kube-system -o yaml
```
```yaml
apiVersion: v1
kind: Pod
metadata:
annotations:
seccomp.security.alpha.kubernetes.io/pod: runtime/default
creationTimestamp: "2020-09-30T19:28:17Z"
generateName: kubernetes-dashboard-bfdf5fc85-djnvb
labels:
app.kubernetes.io/component: kubernetes-dashboard
app.kubernetes.io/instance: kubernetes-dashboard
app.kubernetes.io/managed-by: Helm
app.kubernetes.io/name: kubernetes-dashboard
app.kubernetes.io/version: 2.0.4
helm.sh/chart: kubernetes-dashboard-2.8.0
pod-template-hash: 866ddb74dc
name: kubernetes-dashboard-866ddb74dc-7t7zz
namespace: kube-system
ownerReferences:
- apiVersion: apps/v1
blockOwnerDeletion: true
controller: true
kind: ReplicaSet
name: kubernetes-dashboard-866ddb74dc
uid: f468b51e-7ccd-403c-8b1d-76b4ba34286f
resourceVersion: "5280"
selfLink: /api/v1/namespaces/kube-system/pods/kubernetes-dashboard-866ddb74dc-7t7zz
uid: 78773476-3b42-4be5-a20c-d159a1fa4129
spec:
containers:
- args:
- --namespace=kube-system
- --auto-generate-certificates
image: kubernetesui/dashboard:v2.0.4
(lots more lines of output)
```
If you want the output in json then replace the -o yaml with -o json.
If you're using JSON and want to focus in on just one section of the data structure you can use the JSONPath printer in kubectl to do this, in this case we're going to look at the image that's used for the pod
5. Get a specific element from a configuration, replacing the pod ID of course :
```bash
kubectl get pod kubernetes-dashboard-bfdf5fc85-djnvb -n kube-system -o=jsonpath='{.spec.containers[0].image}'
```
```
kubernetesui/dashboard:v2.0.4
```
(This is correct at the time of writing, but as the Kubernetes dashboard updates over time that the version will change)
This used the "path" in json of .spec.containers[0].image where the first . means the "root" of the JSON structure (subsequent . are delimiters in the way that / is a delimiter in Unix paths) the spec means the spec object (the specification) containers[0] means the first object in the containers list in the spec object and image means the attribute image in the located container.
We can use this coupled with kubectl to identify the specific pods associated with a service, for example
6. Run this to get the selectors used by the dashboard service
```bash
kubectl get service kubernetes-dashboard -n kube-system -o=jsonpath='{.spec.selector}'
```
```
map[app.kubernetes.io/component:kubernetes-dashboard app.kubernetes.io/instance:kubernetes-dashboard app.kubernetes.io/name:kubernetes-dashboard]
```
Tells us that any thing with label app.kubernetes.io/name (or /component of /instance) matching kubernetes-dashboard and label release matching kubernetes-dashboard will be part of the service
7. Get the list of pods providing the dashboard service by name (the service just goes by it's name, no random identifiers added to it)
```bash
kubectl get pod -n kube-system --selector=app.kubernetes.io/name=kubernetes-dashboard
```
```
NAME READY STATUS RESTARTS AGE
kubernetes-dashboard-bfdf5fc85-djnvb 1/1 Running 0 43m
```
### Task 3c: Setting up the Kubernetes dashboard user
First we're going to need create a user to access the dashboard. This involves creating the user, then giving it the kubernetes-dashbaord role that helm created for us when it installed the dashbaord chart.
1. Go to the helidon-kubernetes project folder, then the base-kubernetes directory
```bash
cd $HOME/helidon-kubernetes/base-kubernetes
```
2. Create the user and role
```bash
kubectl apply -f dashboard-user.yaml
```
```
serviceaccount/dashboard-user created
clusterrolebinding.rbac.authorization.k8s.io/dashboard-user created
```
---
Explaining the dashboard-file.yaml
Open up the dashboard-file.yaml and let's have a look at a few of the configuration items
```yaml
apiVersion: v1
kind: ServiceAccount
metadata:
name: dashboard-user
namespace: kube-system
```
This first line tells us that kubectl will be using the core Kubernetes API to do the work, then the remainder of the section tells Kubernetes to create an object of kind ServiceAccount called dashboard-user in the kube-system namespace.
There is then a "divider" of `---` between the next section, this tells kubectl / kubetnetes to start the next section as if it was a separate command, the benefit here is that it allows us to basically issue one command that does two actions.
```yaml
apiVersion: rbac.authorization.k8s.io/v1beta1
kind: ClusterRole
metadata:
name: kubernetes-dashboard-role
rules:
- apiGroups:
- "*"
resources:
- "*"
verbs:
- "*"
```
This section is potentially dangerous, it's tells Kubernetes to use the rbac.authorization.k8s.io service (This naming scheme uses DNS type naming and basically means the role based access controls capability of the authorization service in Kubernetes.io) to define a cluster role that has all permissions to everything. In a production environment you'd want to restrict to specific capabilities, but for this lab it's easier to do the lot rather than jump into the Kubernetes security configuration, which is a large topic in it's own right (But something you should study before moving into production).
```yaml
apiVersion: rbac.authorization.k8s.io/v1
kind: ClusterRoleBinding
metadata:
name: dashboard-user-role-binding
roleRef:
apiGroup: rbac.authorization.k8s.io
kind: ClusterRole
name: kubernetes-dashboard-role
subjects:
- kind: ServiceAccount
name: dashboard-user
namespace: kube-system
```
The last section tells Kubernetes to create a binding that connects the user dashboard-user in namespace kube-system to the kubernetes-dashboard role, basically anyone logged in as dashboard-user has cluster the ability to run the commands specified in the cluster kubernetes-dashboard role.
In practice this means that when the kubernetes-dashboard asks the RBAC service it the user identified as dashboard-user is allowed to use the dashboard it will return yes, and this the dashboard service will allow the dashbaord user to log in and process requests. So basically standard type of Role Based Access Control ideas.
---
A Note on YAML
kubectl can also take JSON input as well as YAML. Personally I think that using any data format (including YAML) where whitespace is sensitive and defines the structure is just asking for trouble (get an extra space to many or too few and you've completely changed what you're trying to do) so my preference would be to use JSON. However (to be fair) JSON is a lot more verbose compared to YAML and the syntax can also lead to problems (though I think that a reasonable JSON editor will be a lot better than a YAML editor at finding problems and helping you fix them)
Sadly (for me at least) YAML has been pretty widely adopted for use with Kubernetes, so for the configuration files we're using here I've used YAML, if you'd like to convert them to JSON however please feel free :-)
---
Before we can login to the dashboard we need to get the access token for the dashboard-user. Prior to Kubernrtes 1.24 creating the user would create the access token, but in Kubernetes 1.24 which changed and you need to create the token as a separate step - We do this using kubectl. Note that the tokens generated are time limited, so here we request one with a life of 1000 hours (about 40 days) which is fine for a lab
3. Create the token for the newly created user:
```bash
kubectl create token dashboard-user --namespace kube-system --duration=1000h
```
(The following is just an example, not a real token)
```
eyJhbGciOiJSUzI1NiIsImtpZCI6IiJ9.eyJpc3MiOiJrdWJlcm5ldGVzL3NlcnZpY2VhY2NvdW50Iiwia3ViZXJuZXRlcy5pby9zZXJ2aWNlYWNjb3VudC9uYW1lc3BhY2UiOiJrdWJlLXN5c3RlbSIsImt1YmVybmV0ZXMuaW8vc2VydmljZWFjY291bnQvc2VjcmV0Lm5hbWUiOiJhZG1pbi11c2VyLXRva2VuLW1odGY5Iiwia3ViZXJuZXRlcy5pby9zZXJ2aWNlYWNjb3VudC9zZXJ2aWNlLWFjY291bnQubmFtZSI6ImFkbWluLXVzZXIiLCJrdWJlcm5ldGVzLmlvL3NlcnZpY2VhY2NvdW50L3NlcnZpY2UtYWNjb3VudC51aWQiOiJhMDljZDQwYy0yNjYzLTExZWEtYTc1Yi0wMjUwMDAwMDAwMDEiLCJzdWIiOiJzeXN0ZW06c2VydmljZWFjY291bnQ6a3ViZS1zeXN0ZW06YWRtaW4tdXNlciJ9.HUg_9-3HBAG0IJKqCNZvXOS8xdt_n2qO4yNc0Lrh4T4AXnUdMHBR1H8uO6J_GoKSKKeuTJpaIB4Ns4QGaWAvcatFxJWmOywwT6CtbxOeLIyP61PCQju_yfqQO5dTUjNW4O1ciPqAWs6GXL-MRTZdvSiaKvUkD_yOrnmacFxVVZUIKR8Ki4dK0VbxF9VvN_MjZS2YgMz8CghsM6AB3lusqoWOK2SdM5VkIGoAOZzsGMjV2eCYJP3k6qIy2lfOD6KrvERhGZLk8GwEQ7h84dbTa4VHqZurS63fle-esKjtNS5A5Oarez6BReByO6nYwEVQBty3VLt9uKPJ7ZRr1FW5iA
```
4. Copy the contents of the token (in this case the `eyJh........W5iA` text, but it *will* vary in your environment) This is a **single line** fo make sure any test editor, notepad etc. doesn't split it into multiple lines.
5. Save it in a plain text editor on your laptop for easy use later in the lab
### Task 3d: Looking around the dashboard.
In several of the labs we're going to be using the dashboard, so let's look around it a bit to get familiar with it's operation.
1. Open a web browser and go to the dashbaord URL you got above, it will be something like `https://dashboard.kube-system.123.456.789.999.nip.io` but the IP address will be that of your ingress service (this is just an example)
```text
https://dashboard.kube-system.[External IP].nip.io/#!/login
```
2. In the browser, accept a self signed certificate the mechanism varies by browser and version, but as of August 2020 the following worked.
- In Safari you will be presented with a page saying "This Connection Is Not Private" Click the "Show details" button, then you will see a link titled `visit this website` click that, then click the `Visit Website` button on the confirmation pop-up. To update the security settings you may need to enter a password, use Touch ID or confirm using your Apple Watch.
- In Firefox once the security risk page is displayed click on the "Advanced" button, then on the "Accept Risk and Continue" button
- In Chrome once the "Your connection is not private" page is displayed click the advanced button, then you may see a link titled `Proceed to ....(unsafe)` click that.
We have had reports that some versions of Chrome will not allow you to override the page like this, for Chrome 83 at least one solution is to click in the browser window and type the words `thisisunsafe` (copy and past doesn't seem to work, you need to actually type it). Alternatively use a different browser.
(Of course if you were doing this in a real deployment you's use a real certificate so wouldn't have to worry about a self-signed certificate causing browser problems).
You'll now be presented with the login screen for the dashboard.
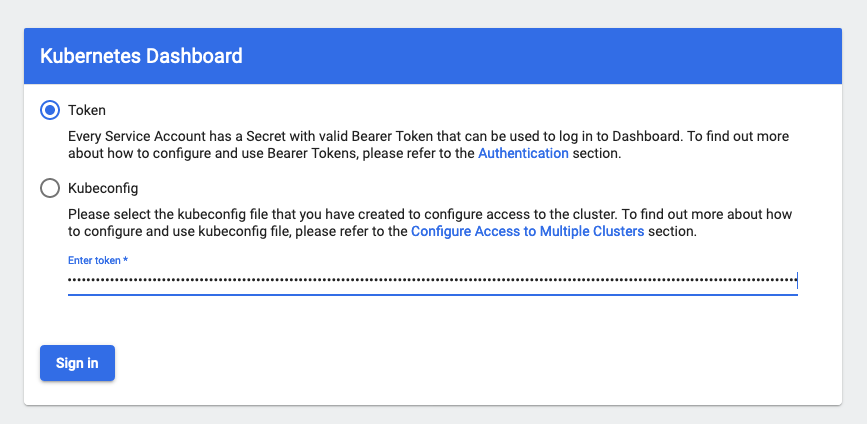
3. Click the radio button for the **Token**
4. Enter the token for the admin-user you retrieved earlier
5. Accept to save the password if given the option, it'll make things easier on the next login
6. Press **Sign In**
**Important** The Kubernetes dashboard will only keep the login session open for a short time, after which you will be logged out. Unfortunately when your login session expires the Kubernetes dashboard doesn't always return you to the login screen. If you find that you are making changes and the dashboard doesn't reflect them, or that you can see something using kubectl - but not in the dashboard, or you trigger an action on the dashboard (e.g. switching to a different a namespace) but the content doesn't update it's probable that the session has expired. In this case **reload** the web page or go to the login URL (above), this will reset the pages state and present you with the login screen again, login using your token as previously (the token does not change, so you don't have to extract it again)
You now should see the **Overview** dashboard :
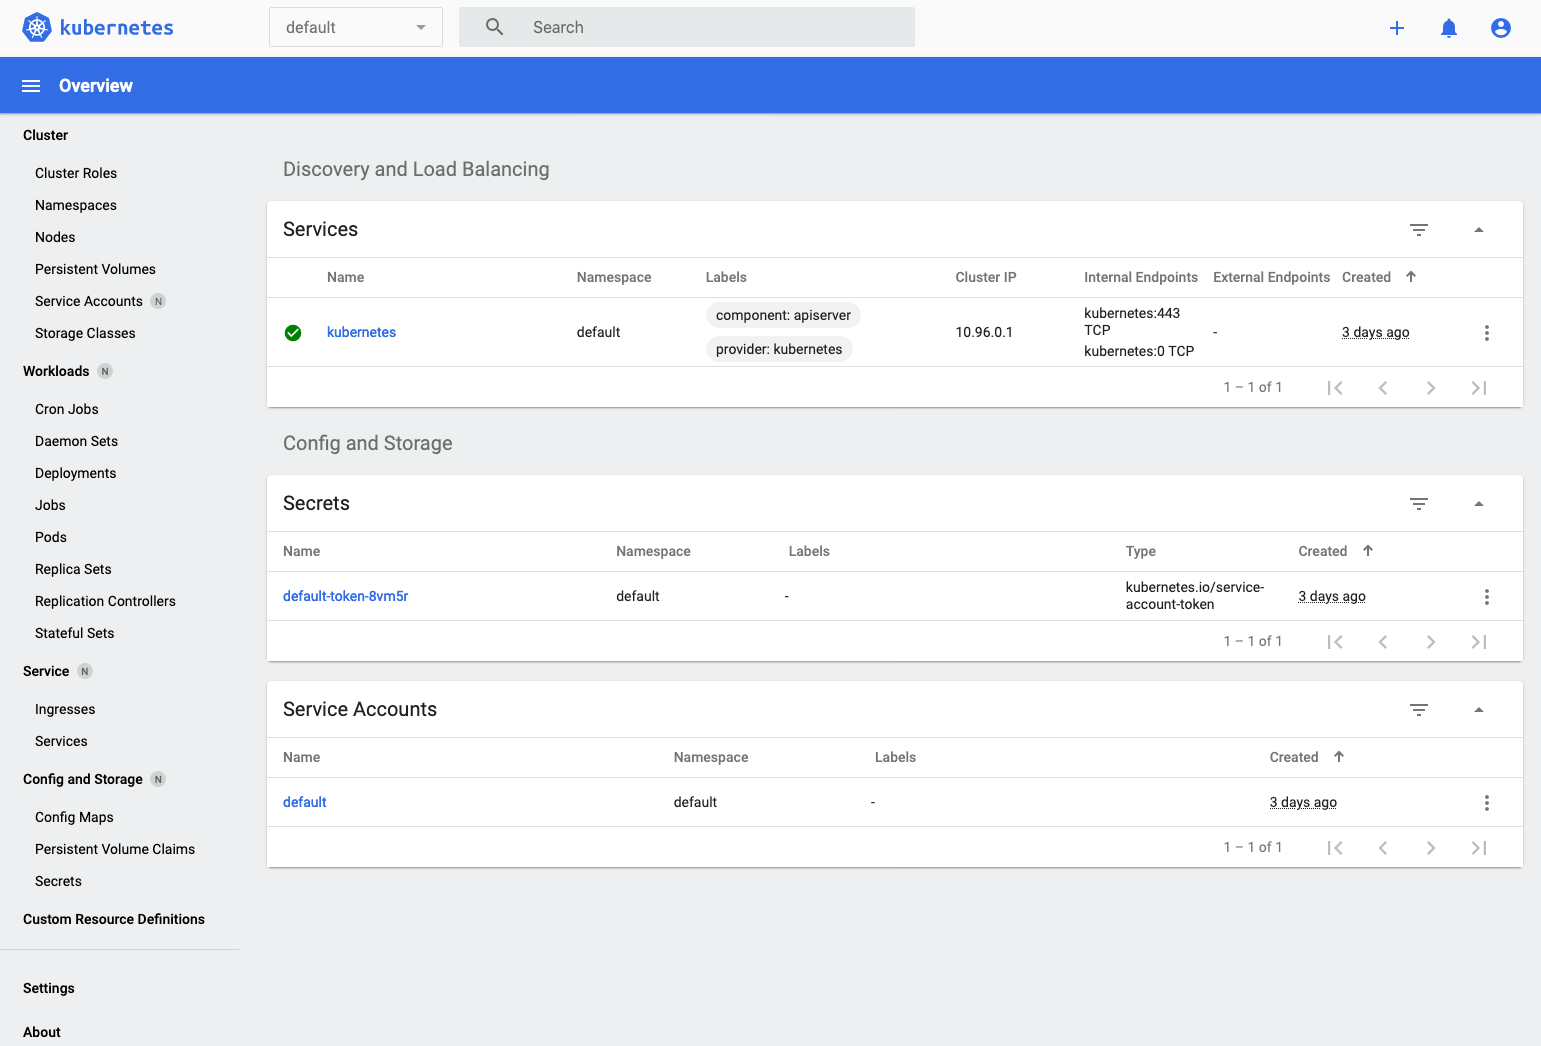
Note that some options on the left menu have a little N by them (if you hover your mouse it becomes "Namespaced") This is a reminder that this menu item (or in the case of Workloads, Service, and Config and storage) will display / allow you to manage stuff that is namespace specific.
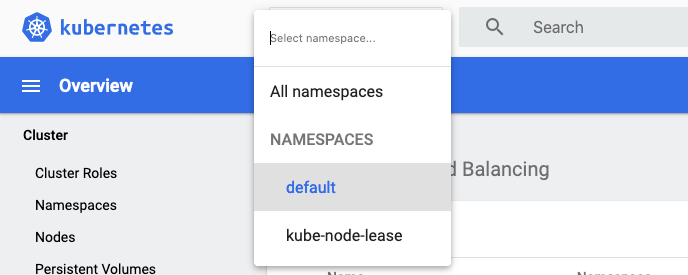
7. To select a namespace use the dropdown on the upper right of the web page.
7. Initially it will probably say default, if you click on it you will get a choice of namespaces.
---
Exploring the details of the dashboard
The Kubernetes dashboard gives you a visual interface to many the features that kubectl provides.
If you do not have the menu on the left click the three bars to open the menu up.
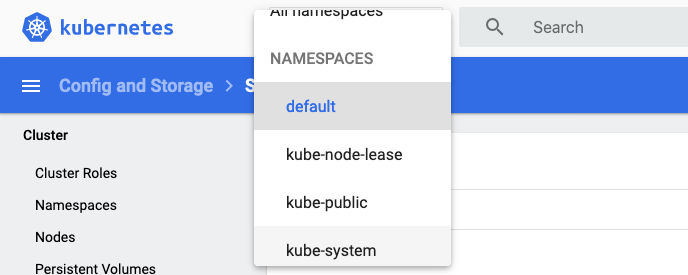
The first thing to remember with the dashboard is that (like kubectl) you need to select a namespace to operate in, or you can chose to extract data from all namespaces. The namespace selection is on the top left by the Kubernetes logo, initially it may well be set to "default".
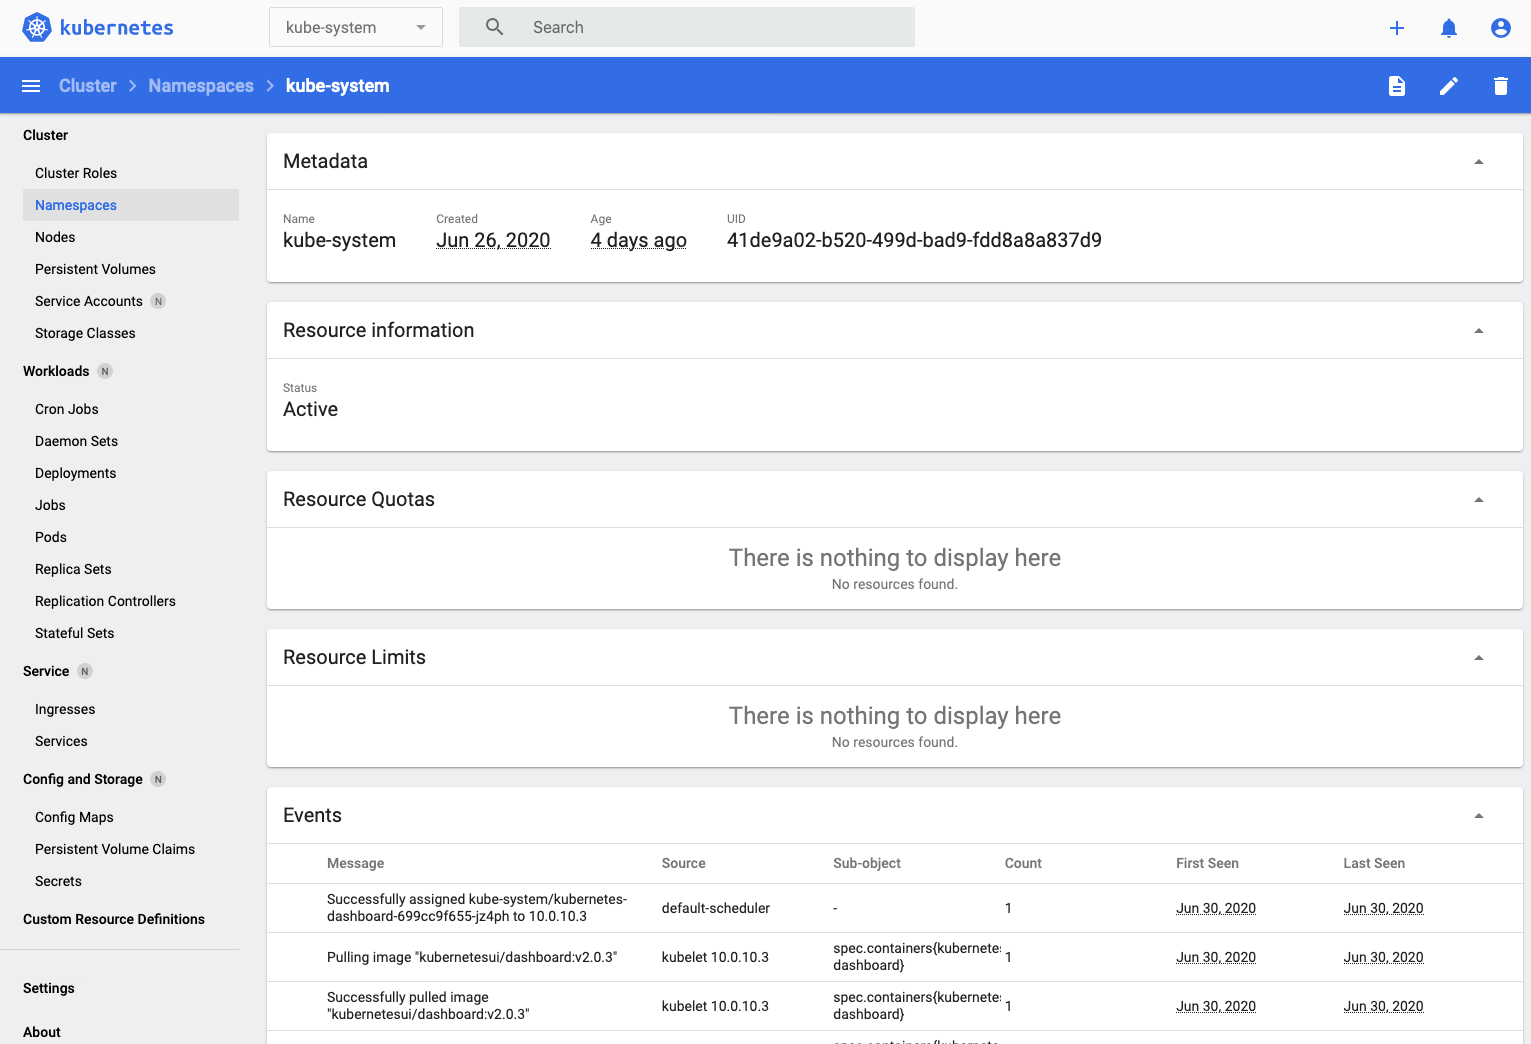
- In the Namespace section on the click the dropdown to select the kube-system namespace
- Select kube-system, precisely which page you'll go to will depend on what was selected in the left menu when you switched namespaces, but in my case it took me to an overview page.
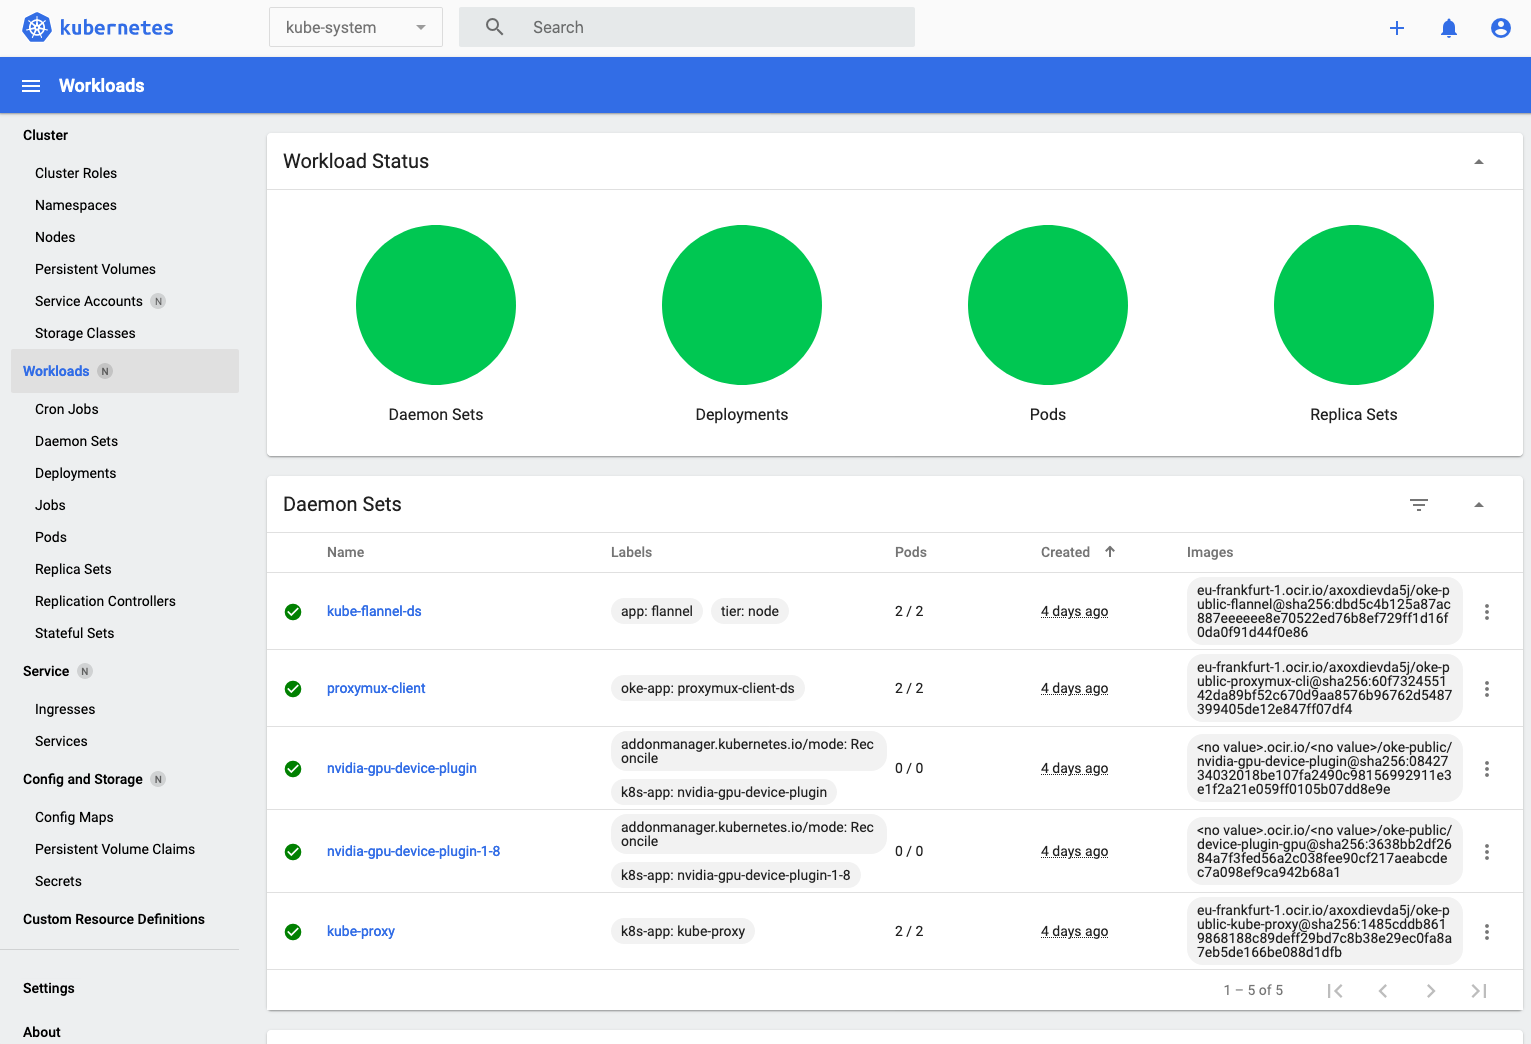
- Let's switch to see the details of the workspace, Click **Workloads** on the left menu
You can use the Kubernetes dashboard to navigate the relationships between the resources. Let's start by looking at the services in the kube-system namespace
- In the **Service** section on the left menu click **Services**
- If you scroll down the page to services you'll see the kubentes-dashboard service listed,
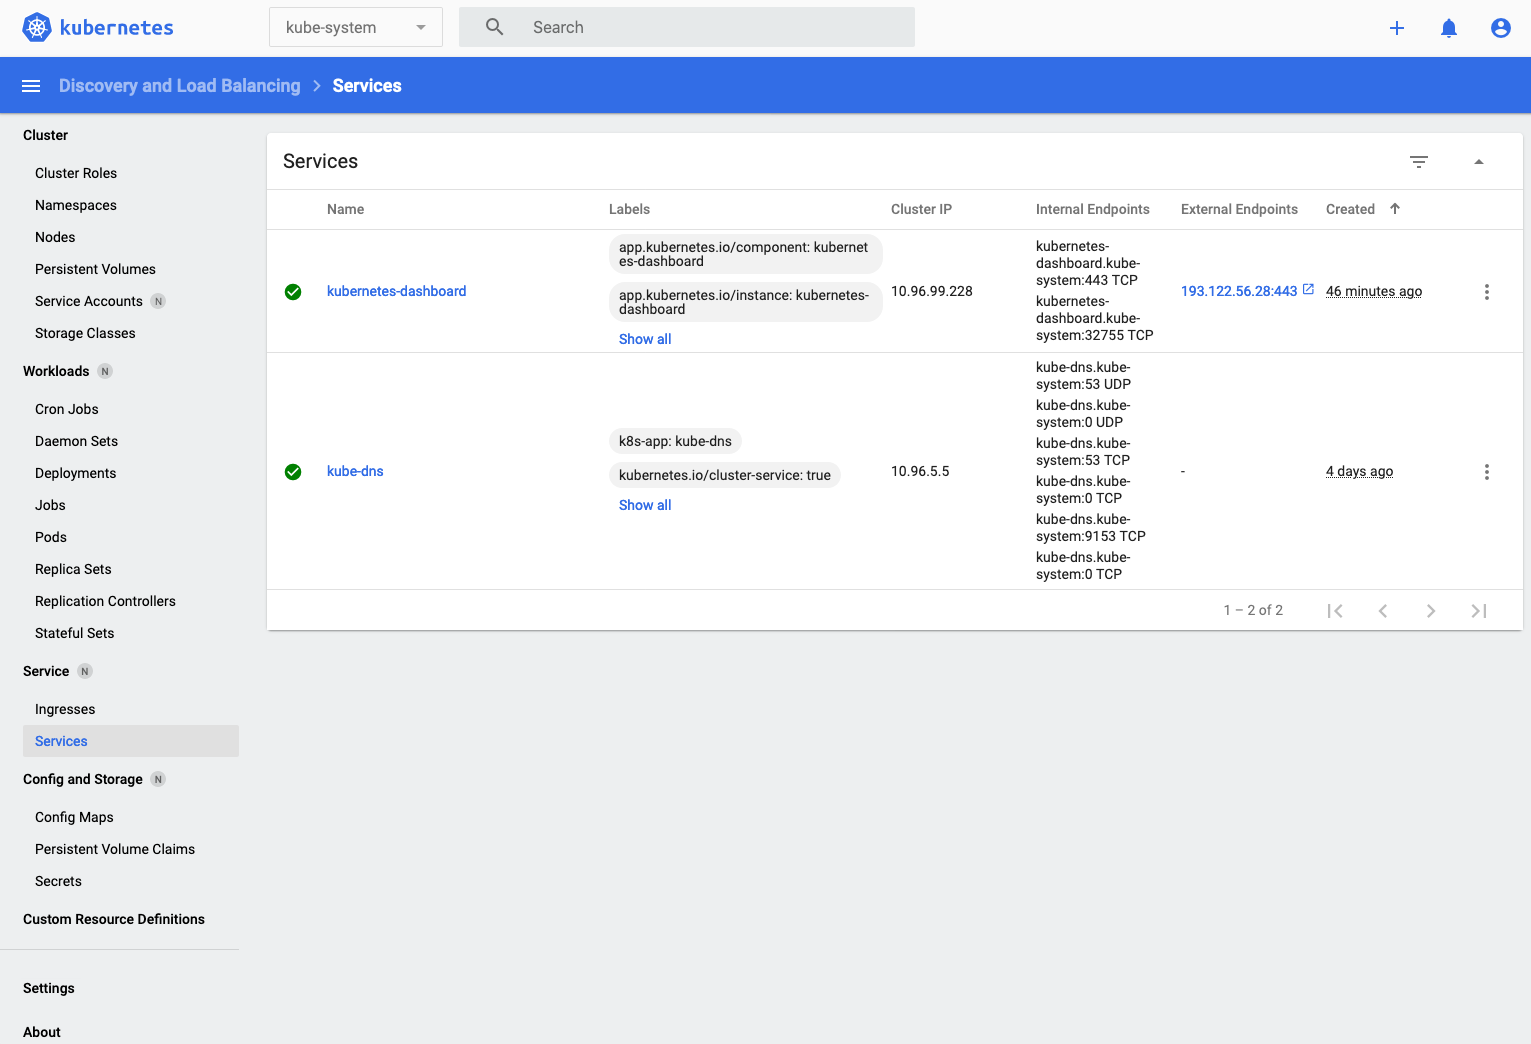
- Click on the service name `kubernetes-dashboard` to get the details of the service, including the pods it's running on.
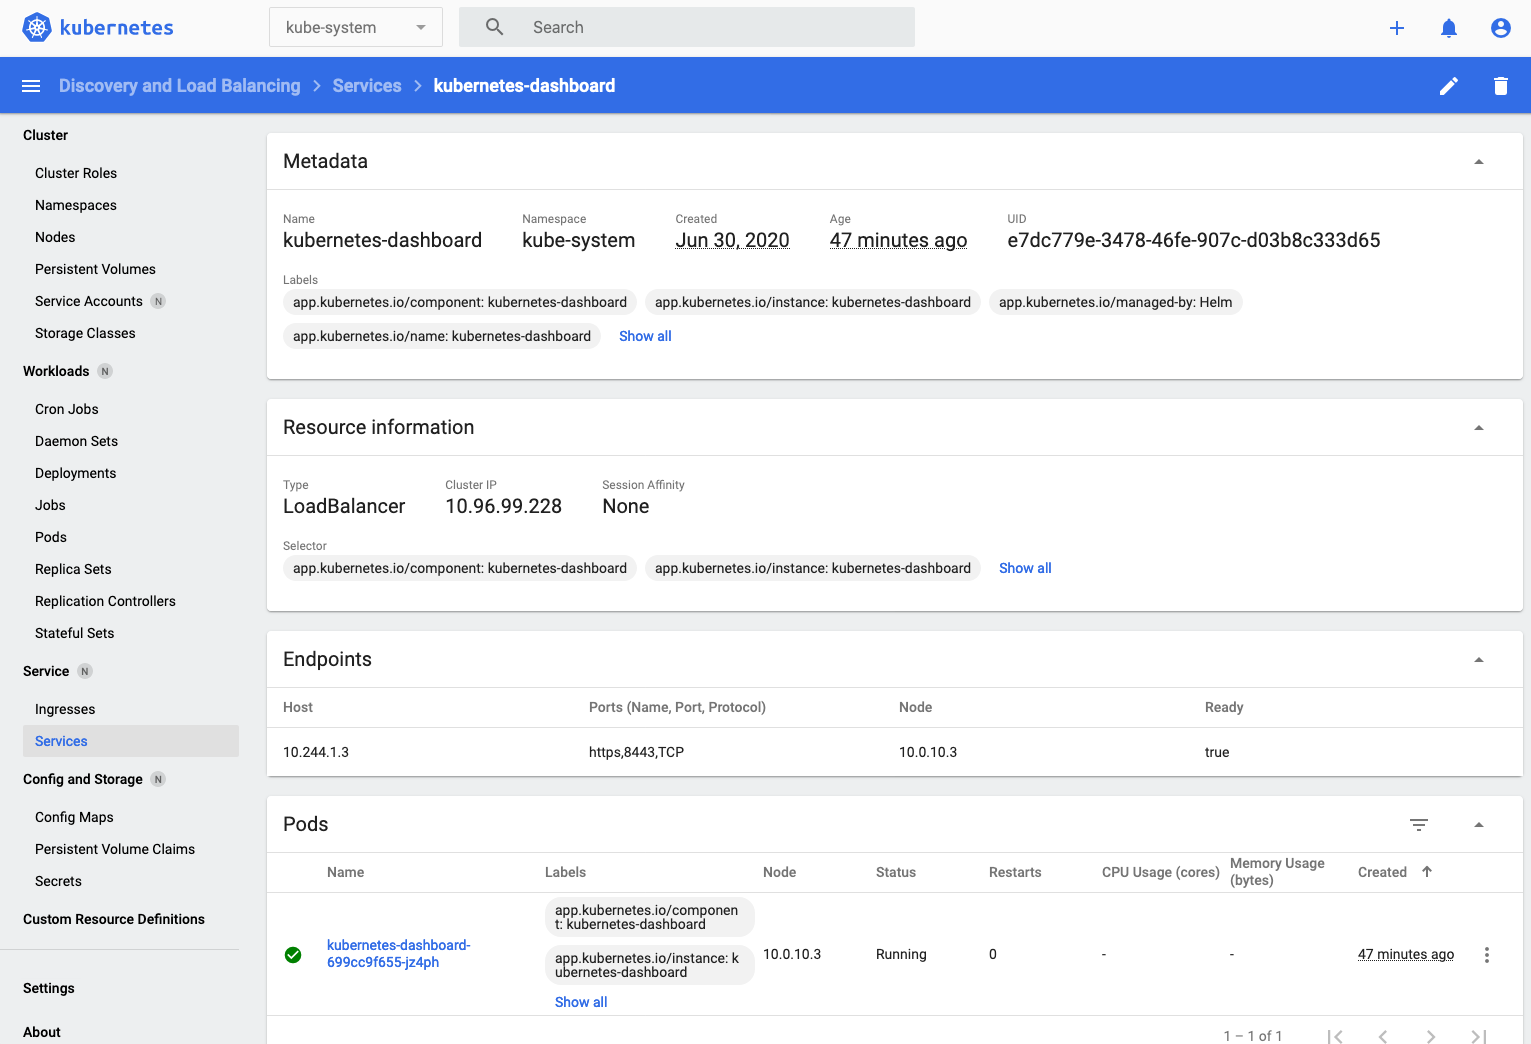
(You may have to scroll down to see the pods list and some other details)
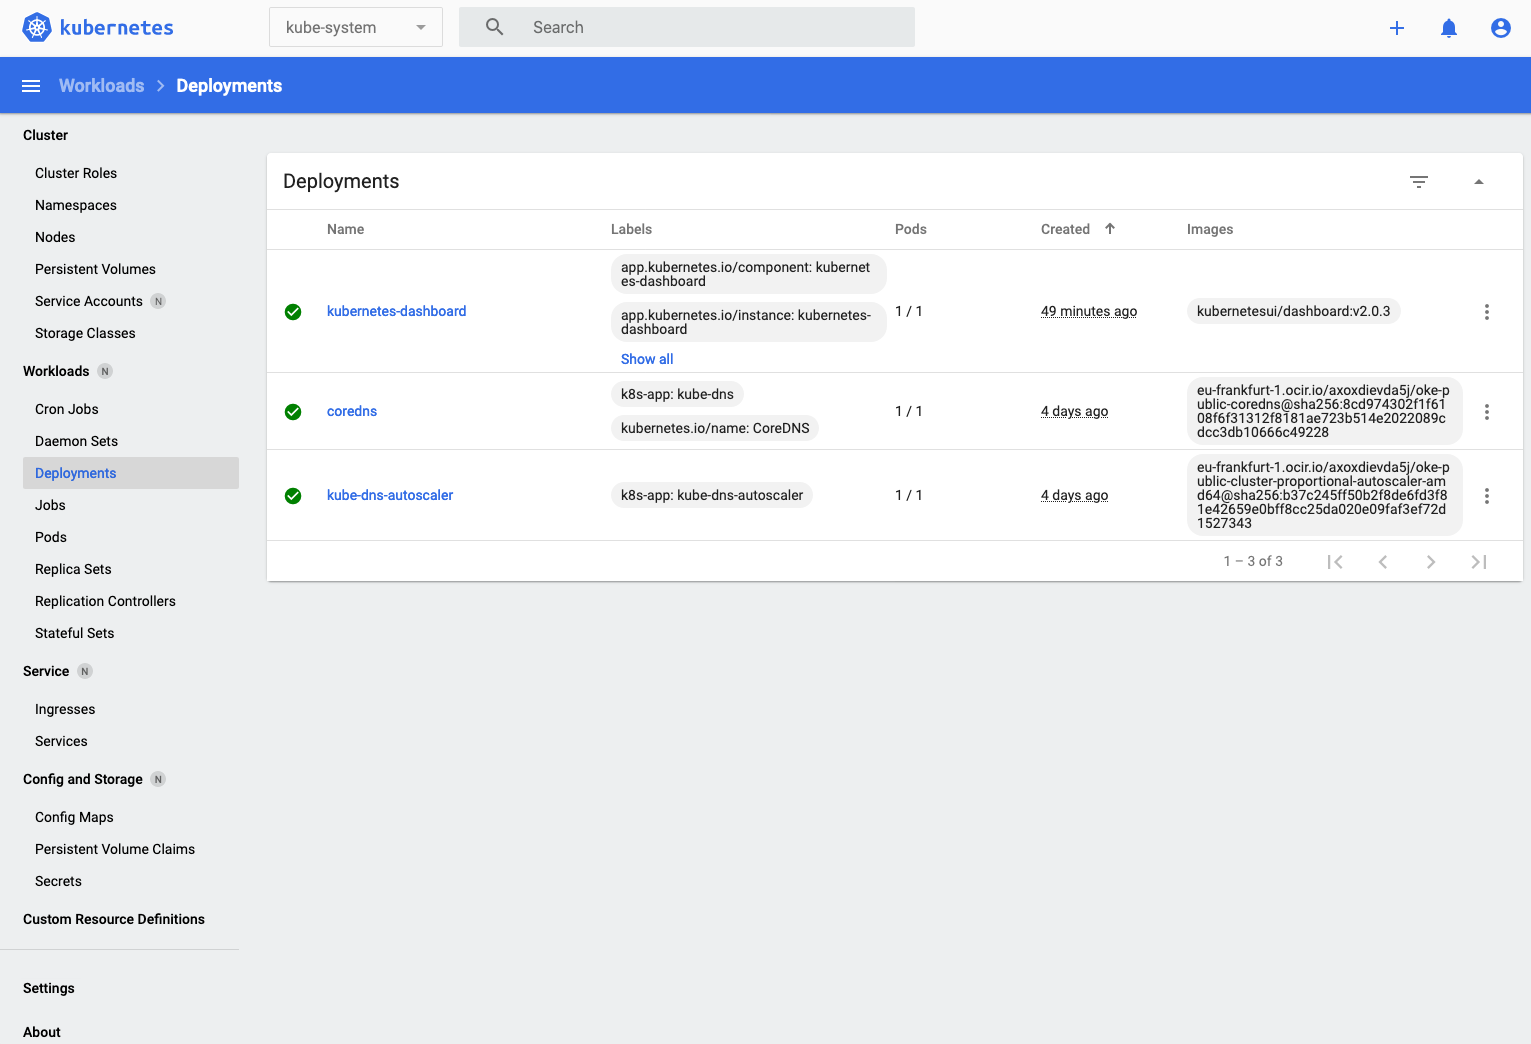
- If you click the **Deployments** in the **Workloads** section of the left menu you'll see the deployments list (the dashboard, coredns and auto-scaler services)
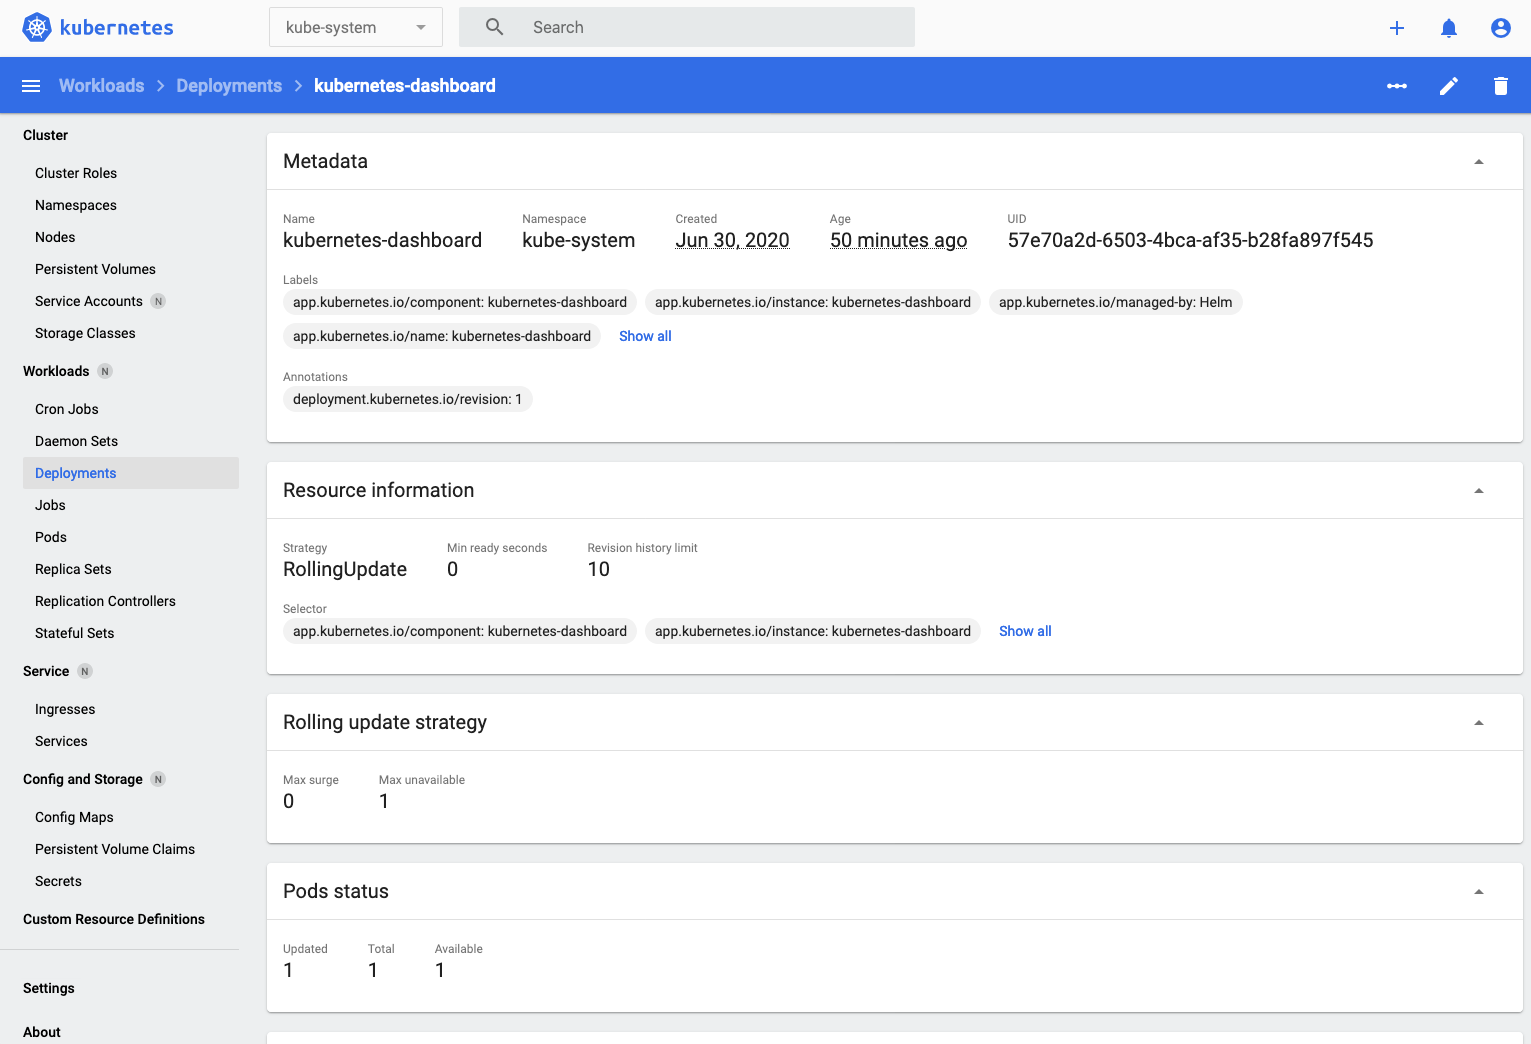
- Click on the kubernetes-dashboard deployment to look into the detail of the deployment and you'll see the deployment details, including the list of replica sets that are in use. We'll look into the old / new distinction when we look at rolling upgrades)
- Scroll down until you can see the replica set section
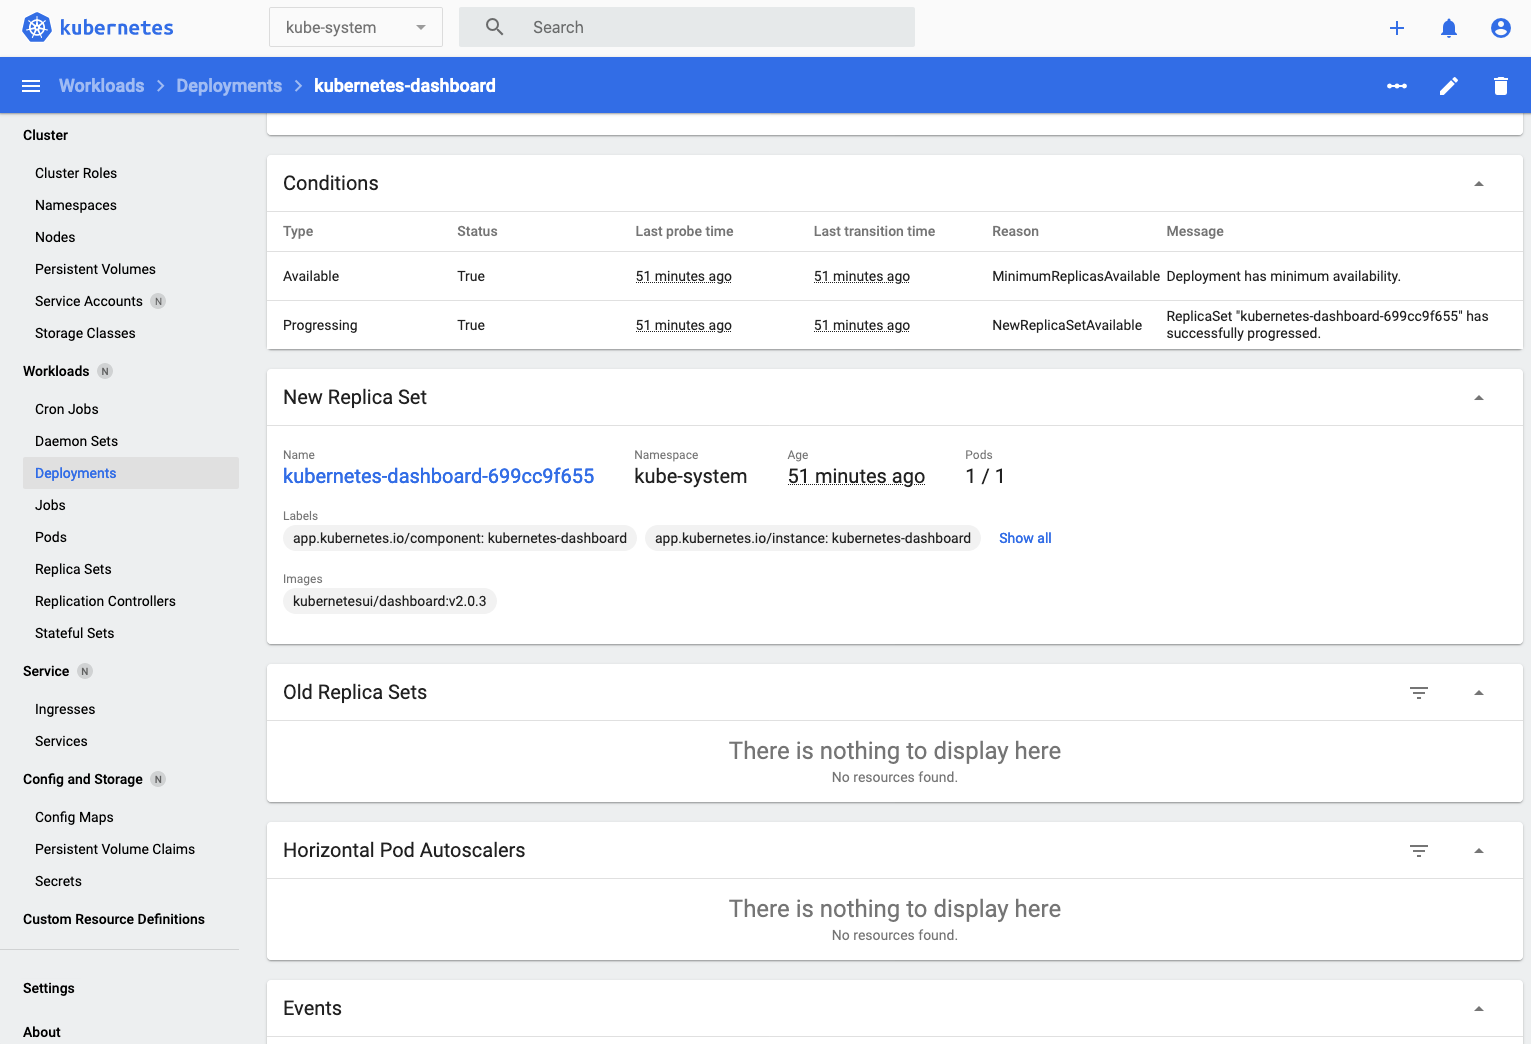
- Click on the replica set name (kubernetes-dashboard-699cc9f655 in this case) then scroll down a bit to see the pods in the replica set.
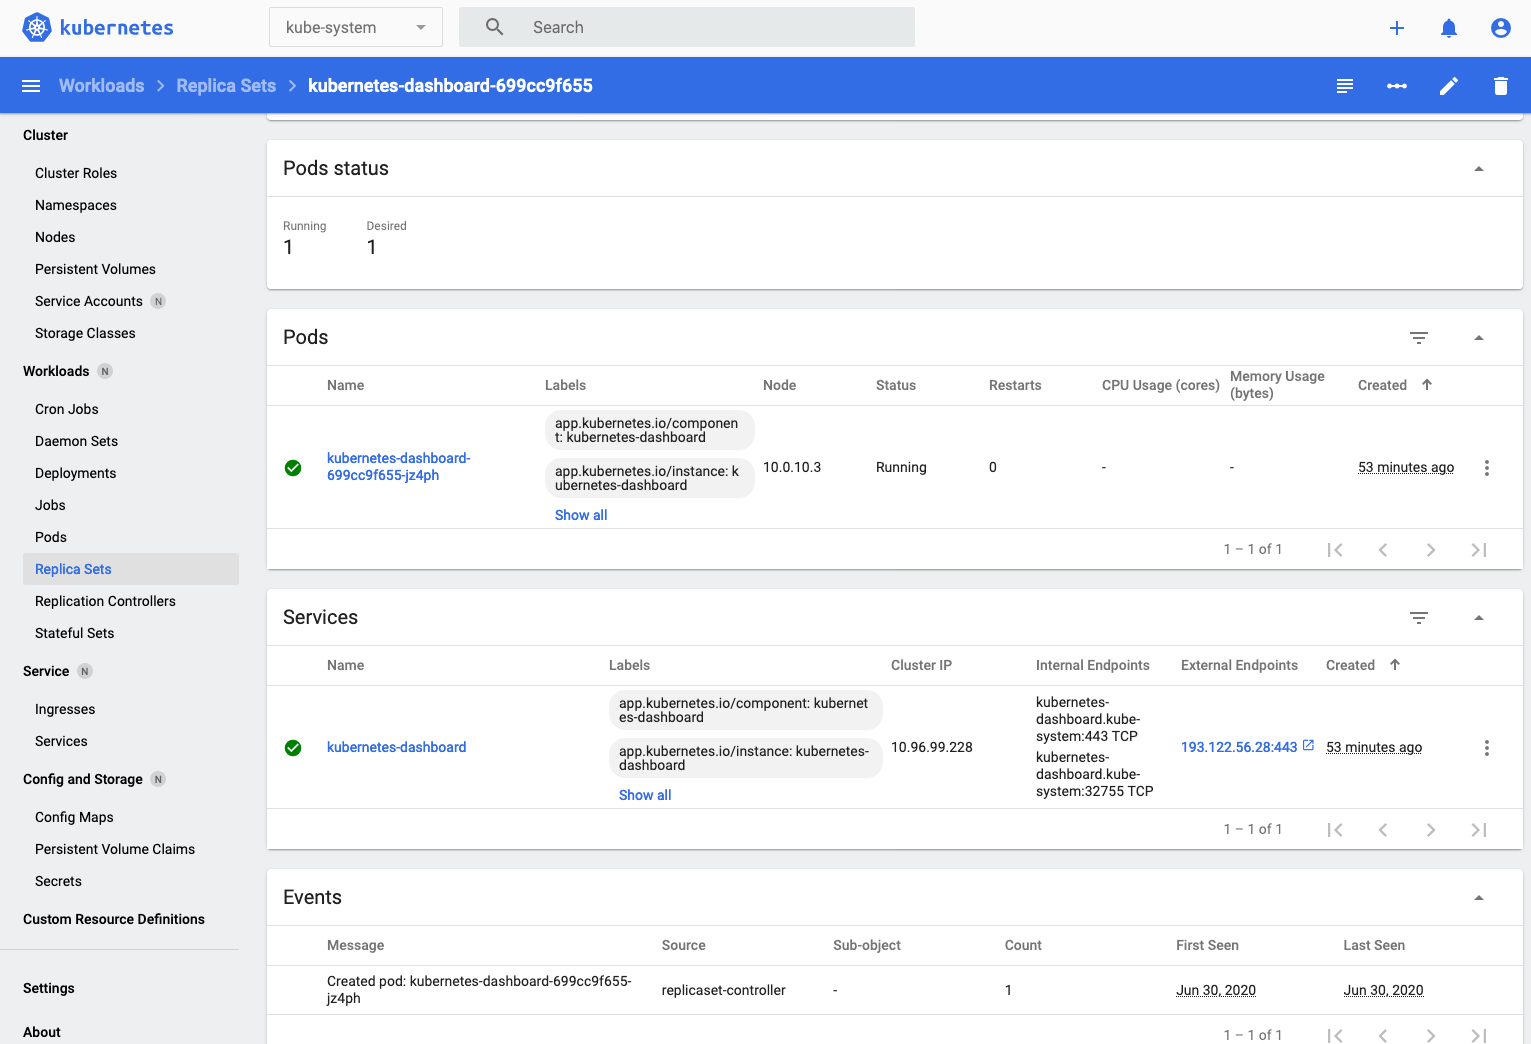
- In this case there's only one pod (kubernetes-dashboard-699cc9f655-jz4ph in this case, yours will vary) so click on that to see the details of the pod.
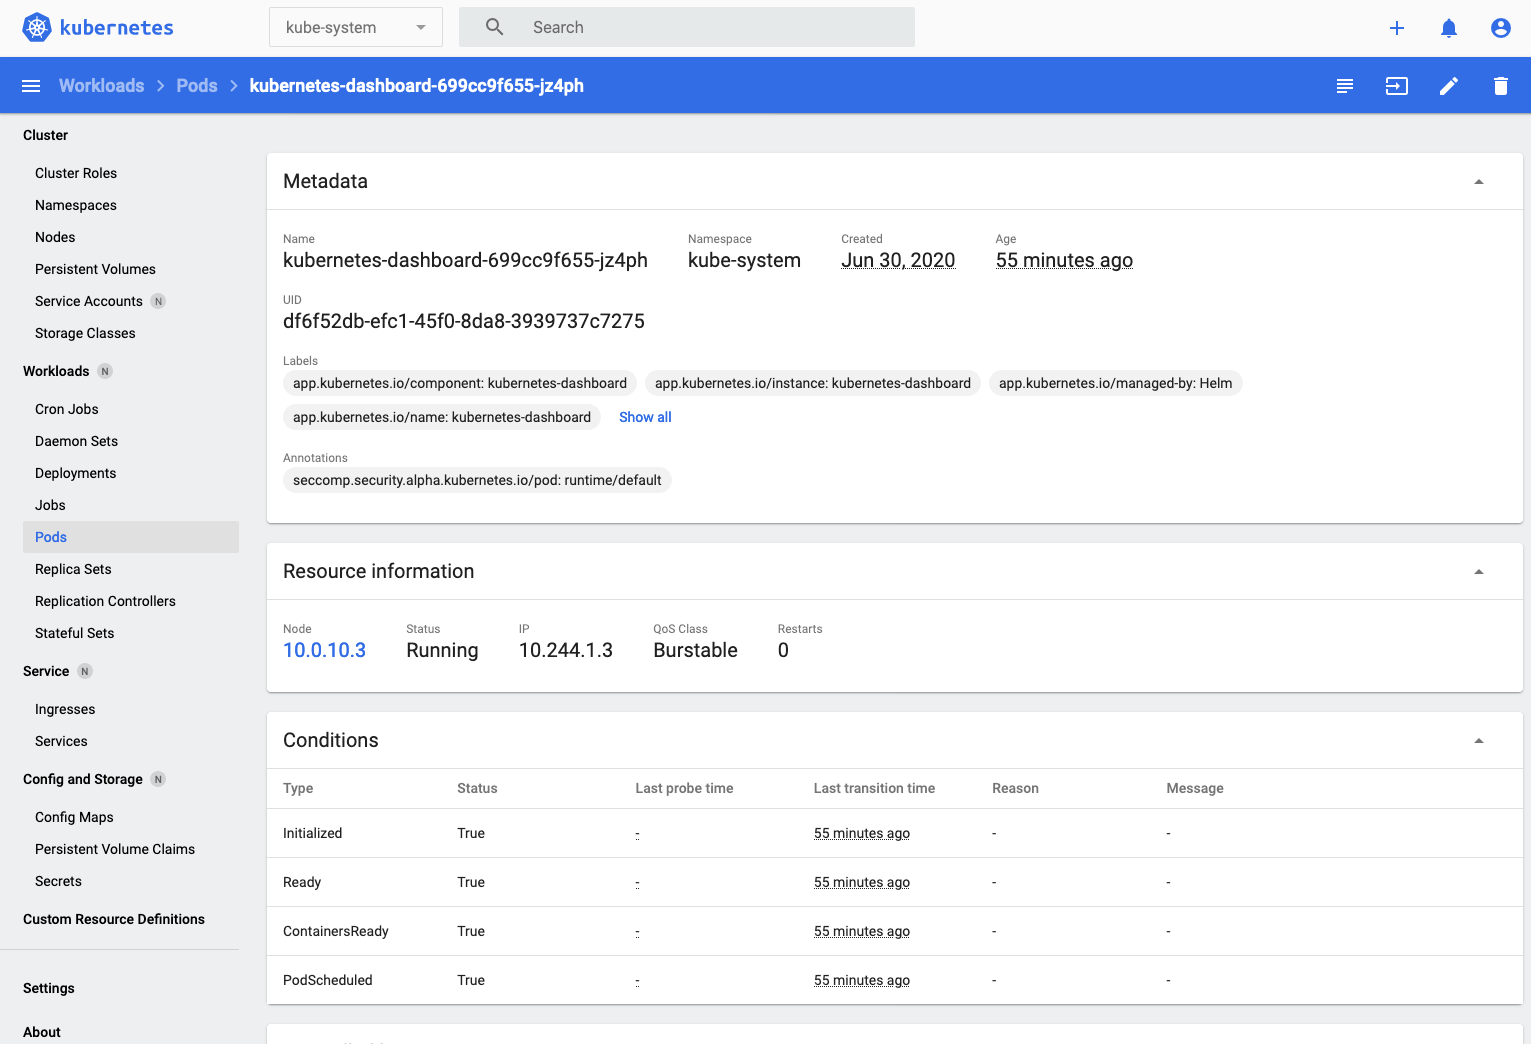
Using kubernetes-dashboard to look at a pod provides several useful features, we can look at any log data it's generated (output the pod has written to stderr or stdout)
- Click the Logs button on the upper right - 
That displays the logs for the dashboard pod
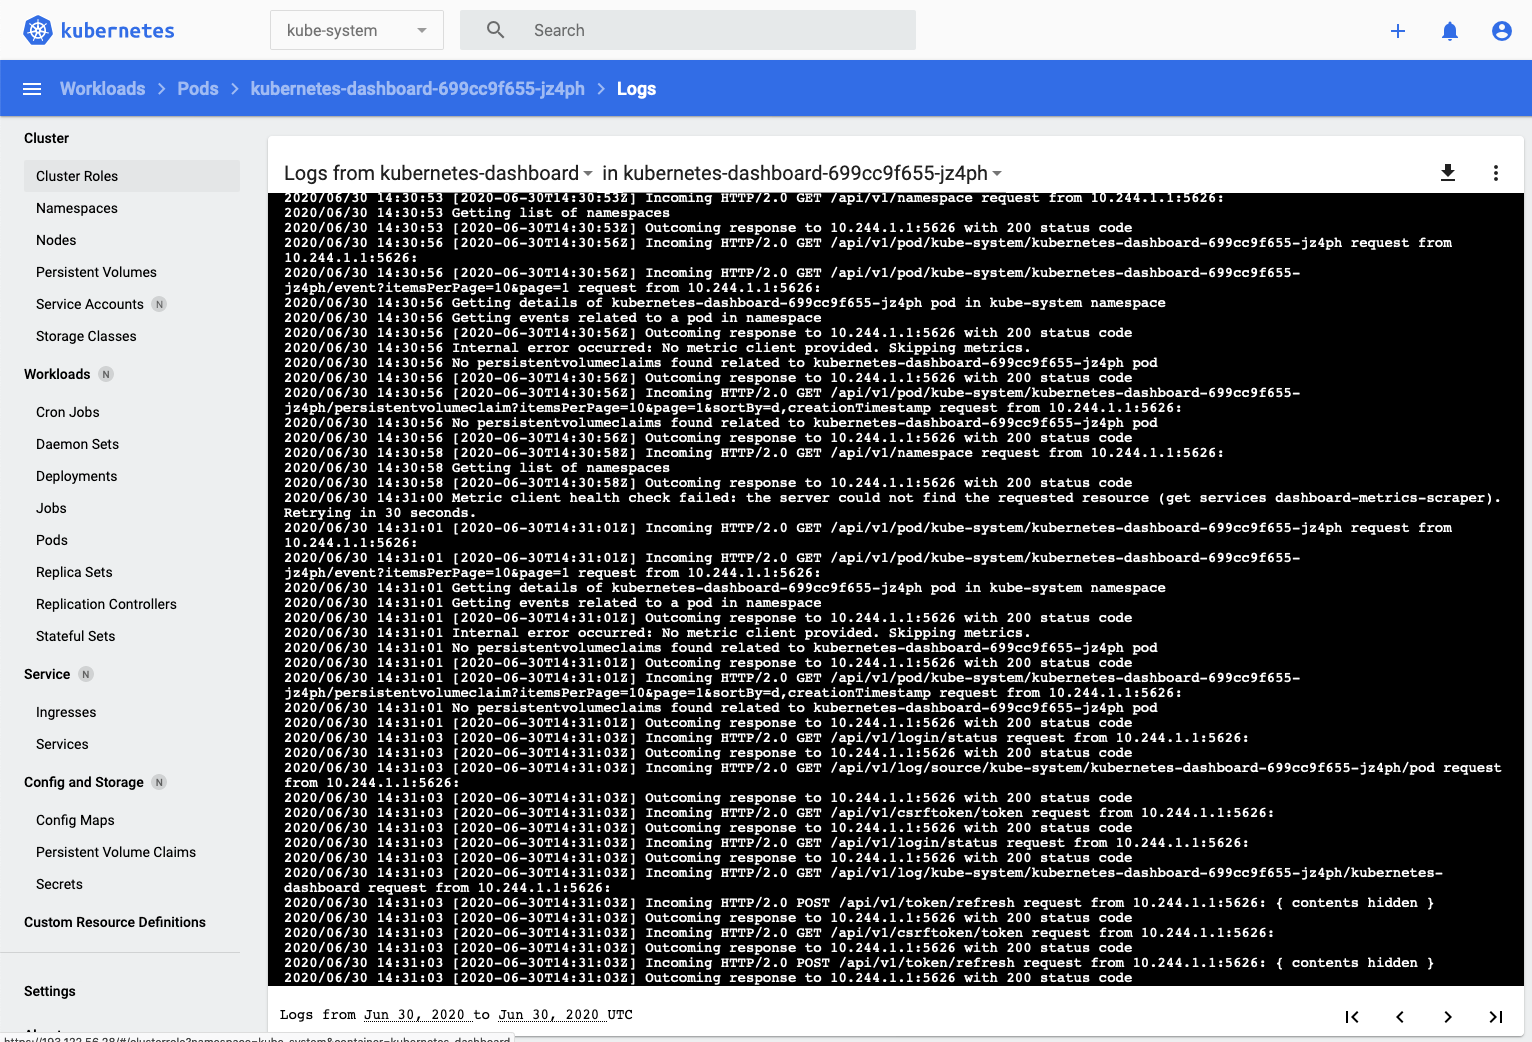
This displays the log data which can be very useful when debugging. Of course it's also possible to use kubectl to download logs info if you wanted to rather than just displaying it in the browser.
There is also the ability to use the dashboard to connect to a running container in a pod. This could be useful for debugging, and later on we'll use this to trigger a simulated pod failure when we explore service availability.
---
Other management tools
There are a lot of other management tools available, some community, for example [K8-Dash](https://github.com/indeedeng/k8dash), and [Kubernetor](https://github.com/smpio/kubernator), and some Open source, but with commercial support, e.g. [Rancher](https://rancher.com/products/rancher/), but they are not part of the official Kubernetes offering, and often require the deployment of additional components to operate, which would mean more work in the initial stages of the lab, so for this lab we're going to use the Kubernetes Dashboard.
Outside a lab environment you may well want to take a little longer to configure these management tools and their dependencies.
---
## Task 4: Namespace, Services and Ingress rules
You now have the basic environment to deploy services, and we've looked at how to use the Kubernetes dashboard and the kubectl command line.
### Task 4a: Creating a namespace to work in
Kubernetes supports the concept of namespaces, these logically split the cluster up, effectively into multiple virtual clusters. It's similar to having different directories to store documents for different projects, and like directories you can have multiple namespaces. In this case you are going to be using your own cluster, but having a separate namespace splits your work from the system functions (those are in a namespace called kube-system). We're not going to be using it in this lab, but namespaces can also be used to control management of the cluster by role based access control to specific namespaces, and to control resource usage in Kubernetes enabling you to limit the usage of resources used by the pods in a namespace (memory, CPU etc). It's also possible to restrict resources on individual pods and we'll look at that later.
In a production cluster where you may have many applications running composed of many microservices having separate namespaces is basically essential to avoid mistakes and misunderstandings that could impact the service operation.
1. Create a namespace for your projects and setup the environment to make it the default, to make it easier we have created a script called create-namespace.sh that does this for you. You must use **your initials** as a parameter (for example in my case that's `tg-helidon`, **but yours will probably differ !**)
2. Switch to the directory
```bash
cd $HOME/helidon-kubernetes/base-kubernetes
```
3. Create the namespace (remember to substitute `[your-initials]`)
```bash
bash create-namespace.sh [your-initials]-helidon
```
```
create-namespace.sh Using default context name of one
Deleting old tg namespace in cluster one
Creating new tg namespace in cluster one
namespace/tg created
Setting default kubectl namespace in cluster one
Context "one" modified.
```
The script tries to delete any existing namespace with that name, creates a new one, and sets it as a default. The output above was using tg-helidon as the namespace, but of course you will have used your initials and so will see them in the output instead of tg.
4. We can check the namespace has been created by listing all namespaces:
```bash
kubectl get namespace
```
```
NAME STATUS AGE
default Active 2d23h
docker Active 2d23h
kube-node-lease Active 2d23h
kube-public Active 2d23h
kube-system Active 2d23h
tg-helidon Active 97s
```
5. If we look into the namespace we've just created we'll see it contains nothing yet:
```bash
kubectl get all
```
```
No resources found in tg-helidon namespace.
```
As we've set the namespace we just created as the default we don't need to specify it in the kubectl commands from now on, but if we want to refer to a different namespace, for example the kube-system namespace then we need to use the -n flag to tell kubectl we are not using the default namespace, e.g. `kubectl get all -n kube-system`
---
Details on the script used
A namespace is basically a "virtual" cluster that let's us separate our services from others that may be running in the cluster. If you have your own cluster it's still a good idea to have your own namespace so you can separate the lab from other activities in the cluster, letting you easily see what's happening in the lab and also no interfering with other cluster activities, and also easily delete it if needs be (deleting a namespace deletes everything in it)
The following command will create a namespace (don't actually do this)
```bash
kubectl create namespace
```
We list available namespaces using kubectl
```bash
$ kubectl get namespace
NAME STATUS AGE
default Active 2d23h
docker Active 2d23h
kube-node-lease Active 2d23h
kube-public Active 2d23h
kube-system Active 2d23h
```
Once you have a namespace you can use it by adding `--namespace ` to all of your kubectl commands (otherwise the default namespace is used which is called `default`). That's a bit of a pain, but fortunately for us there is a way to tell kubectl to use a different namespace for the default
```bash
kubectl config set-context --current --namespace=
```
Of course the Kubernetes dashboard also understands namespaces. If you go to the dashboard page you can chose the namespace to use (initially the dashboard uses the "default" namespace, so if you can't see what you're expecting there remember to change it to the namespace you've chosen.
---
</details>
### Task 4b: Creating Services
The next task is to create services. A service effectively defines a logical endpoint that has a internal dns name inside the cluster and a virtual IP address bound to that name to enable communication to a service. It's also internal load balancer in that if there are multiple pods for a service it will switch between the pods, and also will remove pods from it's load balancer if they are not operating properly (We'll look at this side of a service later on).
Explaining the service concept in Kubernetes and sample service yaml
Services determine what pods they will talk to using selectors. Each pod had meta data comprised of multiple name / value pairs that can be searched on (e.g. type=dev, type=test, type=production, app=stockmanager etc.) The service has a set of labels it will match on (within the namespace) and gets the list of pods that match from Kubernetes and uses that information to setup the DNS and the virtual IP address that's behind the DNS name. The Kubernetes system uses a round robin load balancing algorithm to distribute requests if there are multiple pods with matching labels that are able to accept requests (more on that later)
Services can be exposed externally via load balancer on a specific port (the type field is LoadBalancer) or can be mapped on to an external to the cluster port (basically it's randomly assigned when the type is NodePort) but by default are only visible inside the cluster (or if the type is ClusterIP). In this case we're going to be using ingress to provide the access to the services from the outside world so we'll not use a load balancer.
The various services files define the services for us. Below is the definition of the storefront service (there are also files which define the stock manager and zipkin services as well)
```yaml
apiVersion: v1
kind: Service
metadata:
name: storefront
spec:
type: ClusterIP
selector:
app: storefront
ports:
- name: storefront
protocol: TCP
port: 8080
- name: storefront-mgt
protocol: TCP
port: 9080
```
We are using the core api to create an object of type Service. The meta data tells us we're naming it storefront. The spec section defines what we want the service to look like, in this case it's a ClusterIP, so it's not externally visible. The selector tells us that any pods with a label app and a value storefront will be considered to be part of the service (in the namespace we're using of course). Lastly the network ports offered by the service are defin, each has a name and also a protocol and port. By default the port applies to the port the pods actually provide the service on as well as the port the service itself will be provided on. It's possible to have these on differing values if desired (specify the targetPort label for the port definition)
These could of course be manually specified using a kubectl command line.
***Important***
You need to define the services before defining anything else (e.g. deployments, pods, ingress rules etc.) that may use the services, this is especially true of pods which may use the DNS name created by the service as otherwise those dependent pods may fail to start up.
---
1. The `create-services.sh` script applies the YAML files to create the cluster services for us. Using a script makes this easily reproducible, though of course you could store the YAML in a git repo and use a deployment tool like Oracle DevOps CD or ArgoCD to apply them from the repo. Note that as you may be running this in a the script deletes any existing servcies for saftey first.
```bash
bash create-services.sh
```
```
create-services.sh Using default context name of one
Deleting existing services
Storefront
Stockmanager
Zipkin
Deleted services
Services remaining in namespace are
No resources found in tg namespace.
Creating services
Zipkin
service/zipkin created
Stockmanager
service/stockmanager created
Storefront
service/storefront created
Current services in namespace are
NAME TYPE CLUSTER-IP EXTERNAL-IP PORT(S) AGE
stockmanager ClusterIP 10.96.168.159 8081/TCP,9081/TCP 5s
storefront ClusterIP 10.96.123.84 8080/TCP,9080/TCP 2s
zipkin ClusterIP 10.96.246.168 9411/TCP 8s
```
Note that the service defines the endpoint, it's not actually running any code for your service yet. It's like creating a DNS entry does not mean there is any thing at that IP address.
2. To see the services we can use kubectl :
```bash
kubectl get services
```
```
Current services in namespace are
NAME TYPE CLUSTER-IP EXTERNAL-IP PORT(S) AGE
stockmanager ClusterIP 10.96.51.195 8081/TCP,9081/TCP 9s
storefront ClusterIP 10.96.130.202 8080/TCP,9080/TCP 8s
zipkin ClusterIP 10.96.148.204 9411/TCP 11s
```
The clusterIP is the virtual IP address assigned in the cluster for the service, note there is no external IP as we haven't put a load balancer in front of these services. The ports section specified the ports that the service will use (and in this case the target ports in the pods)
We can of course also use the kuberntes dashboard. Open the dashboard and make sure that the namespace it correctly selected, then click the services in the Discovery and Load Balancing section on the left menu. Basically the same information is displayed.
If however you click on the service name in the services list in the dashboard you'll see that there are no endpoints, or pods associated with the service. This is because we haven't (yet) started any pods with labels that match those specified in the selector of the services.
### Task 4c: Accessing your services using an ingress rule
Why not use multiple Load Balancers?
Services can configure externally visible load balancers for you (and helm did this for you when the ingress controller was installed), however this is not recommended for every REST service for many reasons.
Firstly the load balancers that are created are not part of Kubernetes, the service needs to communicate with the external cloud infrastructure to create them, this means that the cloud needs to provide load balancers and drivers for Kubernetes to configure them, not all clouds may provide this in a consistent manner, so you may get unexpected behavior.
Secondly the load balancers are at the port level, this is fine if you are dealing with a TCP connection (say a JDBC driver) however it means that you can't inspect the data contents and take actions based on it (for example requiring authentication)
Thirdly most cloud services charge on a per load balancer basis, this means that if you need to expose 10 different REST endpoints you are paying for 10 separate load balancers
Fourthly from a security perspective it means that you can't do things like enforcing SSL on your connections, as that's done at a level above TCP/IP
Fortunately for REST activities there is another option, the ingress controller (and coincidentally we installed one earlier !) This can service multiple REST API endpoints as it operates at the http level and is aware of the context of the request (e.g. URL, headers etc.) The downside of an ingress controller is that it does not operate on non http / https requests
***Update***
Saying that an ingress cannot handle TCP / UDP level requests is actually a slight lie, in more recent versions of the nginx ingress controller it's possible to define a configuration that can process TCP / UDP connections and forward those untouched to a service / port. This is however not a standard capability and needs to be configured separately with specific IP addresses for the external port defined in the ingress configuration. However, different ingress controllers will have different capabilities, so you can't rely on this being the case with all ingress controllers.
---
We have already installed the Ingress controller which actually operates the ingress service and configured the associated load balancer. You can see this by looking at the services. The ingress service is in the ingress-nginx namespace, so we have to specify that :
1. Let's look at the Ingress services
```bash
kubectl get services -n ingress-nginx
```
```
NAME TYPE CLUSTER-IP EXTERNAL-IP PORT(S) AGE
ingress-nginx-nginx-ingress-controller LoadBalancer 10.111.0.168 130.61.15.77 80:31934/TCP,443:31827/TCP 4h9m
ingress-nginx-nginx-ingress-default-backend ClusterIP 10.108.194.91 80/TCP 4h9m
```
Earlier we stored the value of the external IP address in the `$EXTERNAL_IP` variable, if you want to check if it's correct do `echo $EXTERNAL_IP` in the OCI Cloud Shell and compare it to the one shown when you looked at the ingress service.
How to check if $EXTERNAL_IP is set, and re-set it if it's not
**To check if `$EXTERNAL_IP` is set**
If you want to check if the variable is still set type `echo $EXTERNAL_IP` if it returns the IP address you're ready to go, if not then you'll need to re-set it.
**To get the external IP address if you no longer have it**
In the OCI Cloud shell type
```bash
kubectl --namespace ingress-nginx get services -o wide ingress-nginx-controller
```
```
NAME TYPE CLUSTER-IP EXTERNAL-IP PORT(S) AGE SELECTOR
ingress-nginx-controller LoadBalancer 10.96.61.56 132.145.235.17 80:31387/TCP,443:32404/TCP 45s app.kubernetes.io/component=controller,app.kubernetes.io/instance=ingress-nginx,app.kubernetes.io/name=ingress-nginx
```
The External IP of the Load Balancer connected to the ingresss controller is shown in the EXTERNAL-IP column. If you've only just created the ingress controller it may say `Pending` in which case re-do the request after a few minutes.
**To set the variable again**
```bash
export EXTERNAL_IP=[External IP]
```
---
For the moment there are no actual ingress rules defined yet,
As we will be providing a secure TLS protected connection we need to create a certificate to protect the connection. In a **production** environment this would be accomplished by going to a certificate authority and having them issue a certificate. This however can take time as certificates are (usually) based on a DNS name and a commercial provider may well require that you prove your organizations identity before issuing a certificate.
To enable the lab to complete in a reasonable time we will therefore be generating our own self-signed certificate. For a lab environment that's fine, but in a production environment you wouldn't do this.
3. Run the following command to generate a certificate (you installed the step command in the cloud shell setup). The value of the IP address of the Ingress controllers load balancer is in `$EXTERNAL_IP` and will be replaced in the command below automatically.
```bash
$HOME/keys/step certificate create store.$EXTERNAL_IP.nip.io tls-store-$EXTERNAL_IP.crt tls-store-$EXTERNAL_IP.key --profile leaf --not-after 8760h --no-password --insecure --kty=RSA --ca $HOME/keys/root.crt --ca-key $HOME/keys/root.key
```
```
Your certificate has been saved in tls-store-123.456.789.123.crt.
Your private key has been saved in tls-store-123.456.789.123.key
```
(The above is example output, your files will be based on the IP you provided)
The certificate needs to be in a Kubernetes secret, we'll look at these in more detail, but for now :
4. Run the following command to save the certificate as a secret in the ingress-nginx namespace.
```bash
kubectl create secret tls tls-store --key tls-store-$EXTERNAL_IP.key --cert tls-store-$EXTERNAL_IP.crt
```
```
secret/tls-store created
```
5. Let's use kubectl to confirm we have no rules yet
```bash
kubectl get ingress
```
```
No resources found in tg-helidon namespace.
```
More on Ingress rules
We need to define the ingress rules that will apply. The critical thing to remember here is that different Ingress Controllers may have different syntax for applying the rules. We're looking at the nginx-ingress controller build and maintained by the Kubernetes project here which is commonly used, but remember there are others.
The rules define URL's and service endpoints to pass those URLs to, the URL's can also be re-written if desired.
An ingress rule defines a URL path that is looked for, when it's discovered the action part of the rule is triggered and that
There are ***many*** possible types of rules that we could define, but here we're just going to look at two types: Rules that are plain in that the recognize part of a path, and just pass the whole URL along to the actual service, and rules that re-write the URL before passing it on. Let's look at the simpler case first, that of the forwarding.
```yaml
apiVersion: networking.k8s.io/v1
kind: Ingress
metadata:
name: zipkin-direct-ingress
annotations:
# use the shared ingress-nginx
kubernetes.io/ingress.class: "nginx"
spec:
tls:
- hosts:
# ${EXTERNAL_IP} must be replaced with the IP address of the ingress controller
- store.123.456.789.123.nip.io
secretName: tls-store
rules:
# ${EXTERNAL_IP} must be replaced with the IP address of the ingress controller
- host: store.123.456.789.123.nip.io
http:
paths:
- path: /zipkin
pathType: Prefix
backend:
service:
name: zipkin
port:
name: zipkin
```
Firstly note that the api here is the `networking.k8s.io/v1` API. Since Kubernetes 1.19 was changed from `networking.k8s.io/v1beta1` to indicate that Ingress configuration is part of the core Kubernetes networking released features. This change also resulted in a number of structural changes to the YAML, the version above represents the latet structure.
The metadata specifies the name of the ingress (in this case zipkin) and also the annotations. Annotations are a way of specifying name / value pairs that can be monitored for my other services. In this case we are specifying that this ingress Ingress rule has a label of Kubernetes.io/ingress.class and a value of nginx. The nginx ingress controller will have setup a request in the Kubernetes infrastructure so it will detect any ingress rules with that annotation as being targeted to be processed by it. This allows us to define rules as standalone items, without having to setup and define a configuration for each rule in the ingress controller configuration itself. This annotation based approach is a simple way for services written to be cloud native to identify other Kubernetes objects and determine how to hendle them, as we will see when we look at monitoring in kubenteres.
The spec section basically defines the rules to do the processing, basically if there's an connection coming in with a url that starts with /zipkin then the connection will be proxied to the zikin service on port 9411. The entire URL will be forwarded including the /zipkin. (Note that you could in the spec section also specify a certificate for that connection, but in our case we did that in the load balancer).
In some cases we don't want the entire URL to be forwarded however, what if we were using the initial part of the URL to identify a different service, perhaps for the health or metrics capabilities of the microservices which are on a different port (http://storefront:9081/health for example) In this case we want to re-write the incomming URL as it's passed to the target
```yaml
apiVersion: networking.k8s.io/v1
kind: Ingress
metadata:
name: stockmanager-rewrite-ingress
annotations:
kubernetes.io/ingress.class: "nginx"
# nginx.ingress.kubernetes.io/use-regex: "true"
# rewrite the requests
nginx.ingress.kubernetes.io/rewrite-target: /$2
spec:
tls:
- hosts:
# ${EXTERNAL_IP} must be replaced with the IP address of the ingress controller
- store.123.456.789.123.nip.io
secretName: tls-store
rules:
# ${EXTERNAL_IP} must be replaced with the IP address of the ingress controller
- host: store.$123.456.789.123.nip.io
http:
paths:
#any path starting with sm will have the /sm removed before being passed to the service on the specified url
#for example this handles /sm/status -> /status on arrival at the storefront server
- path: /sm(/|$)(.*)
pathType: ImplementationSpecific
backend:
service:
name: stockmanager
port:
name: stockmanager
... more paths ...
```
In this case the annotations section is slightly different, it still triggers nginx when the path matches, but it uses a variable so that the URL will be `/` followed by whatever matches the `$2` in the regular expression. The rule itself looks for anything that starts with /smmgt followed by the regexp which matches `/` followed by a sequence of zero or more characters OR the end of the pattern. The regexp will be extracted and substituted for `$2`. The regexp matched two fields, the first match `$1` is `(/|$)` which matches either / or no further characters. The 2nd part of the regexp `$2` is `(.*)` which matches zero or more characters (the . being any character and * being a repeat of zero or more).
Thus `/smmgt` will result in a call to `/`, because `$1` matches no characters after `/smmgt`.
On the other hand, `/smmgt/health/ready` will be mapped to `/health/ready` : the `$1` is `/` and `$2` is `health/ready`, but the rewrite rule puts a `/` in front of `$2` thus becoming `/health/ready`)
Note that it is possible to match multiple paths in the same ingress, and they can forward to different ports, however the re-write target (the updated URL) will be the same structure in both cases.
---
As we've mentioned before for the purposes of this lab we are not setting up official DNS domain entries (we're using `nip.io` to get around that) or creating official certificates (we're creating them locally using `step`) for this to work however that means that we need to use the `nip.io` "Fake" DNS Names with the IP address embedded in them
4. The multiple ingress rules files have a placeholder in them and there is a script that will replace the placeholder with the IP address in a new version of the file. In the OCI Cloud shell type the following, at the prompts enter `y`
```bash
bash set-ingress-ip.sh $EXTERNAL_IP
```
```
set-ingress-ip.sh Using default context name of one
Updating the ingress config to set 141.147.119.246 as the External IP address. (y/n) ?y
Updating the ingress config to set 141.147.119.246 as the External IP address..
set-ingress-config.sh Operating on context name one
Templating the ingress rules yaml in /home/tim_graves/helidon-kubernetes/base-kubernetes to set 141.147.119.246 as the External IP address.
Proceed (y/n) ?y
Templating the ingress rules
Templating ingress rules - updating the template ingress rules yaml in /home/tim_graves/helidon-kubernetes/base-kubernetes setting 141.147.119.246 as the external IP address
template-ingress.sh Operating on context name one
Templating /home/tim_graves/helidon-kubernetes/base-kubernetes/ingressStockmanagerRules.yaml to /home/tim_graves/helidon-kubernetes/base-kubernetes/ingressStockmanagerRules-one.yaml
Templating /home/tim_graves/helidon-kubernetes/base-kubernetes/ingressStockmanagerRules.yaml replacing ${EXTERNAL_IP}.nip.io with 141.147.119.246.nip.io into destination /home/tim_graves/helidon-kubernetes/base-kubernetes/ingressStockmanagerRules-one.yaml
Templating /home/tim_graves/helidon-kubernetes/base-kubernetes/ingressStorefrontRules.yaml to /home/tim_graves/helidon-kubernetes/base-kubernetes/ingressStorefrontRules-one.yaml
Templating /home/tim_graves/helidon-kubernetes/base-kubernetes/ingressStorefrontRules.yaml replacing ${EXTERNAL_IP}.nip.io with 141.147.119.246.nip.io into destination /home/tim_graves/helidon-kubernetes/base-kubernetes/ingressStorefrontRules-one.yaml
Templating /home/tim_graves/helidon-kubernetes/base-kubernetes/ingressZipkinRules.yaml to /home/tim_graves/helidon-kubernetes/base-kubernetes/ingressZipkinRules-one.yaml
Templating /home/tim_graves/helidon-kubernetes/base-kubernetes/ingressZipkinRules.yaml replacing ${EXTERNAL_IP}.nip.io with 141.147.119.246.nip.io into destination /home/tim_graves/helidon-kubernetes/base-kubernetes/ingressZipkinRules-one.yaml
```
Note that the output above is for an external IP of `123.456.789.999` This is of course not a real world IP address and your output will reflect the IP address of your controller.
5. There is a shell script that will apply each of the ingress rules yaml files. Using a script here is prefered as it is reproducible and minimises the chance of typo's, mistakes or forgetting to apply a file. of course in a production system you'd probabaly be using an automated deployment tool instead of this script. In the OCI cloud shell type
```bash
bash create-ingress-rules.sh
```
```
create-ingress-rules.sh Using default context name of one
Applying /home/tim_graves/helidon-kubernetes/base-kubernetes/ingressStockmanagerRules-one.yaml
ingress.networking.k8s.io/stockmanager-direct-ingress created
ingress.networking.k8s.io/stockmanager-rewrite-ingress created
Applying /home/tim_graves/helidon-kubernetes/base-kubernetes/ingressStorefrontRules-one.yaml
ingress.networking.k8s.io/storefront-direct-ingress created
ingress.networking.k8s.io/storefront-rewrite-ingress created
Applying /home/tim_graves/helidon-kubernetes/base-kubernetes/ingressZipkinRules-one.yaml
ingress.networking.k8s.io/zipkin-direct-ingress created
```
6. We can see the resulting ingresses using kubectl
```bash
kubectl get ingress
```
```
NAME CLASS HOSTS ADDRESS PORTS AGE
stockmanager-direct-ingress store.123.456.789.999.nip.io 80, 443 79s
stockmanager-rewrite-ingress store.123.456.789.999.nip.io 80, 443 79s
storefront-direct-ingress store.123.456.789.999.nip.io 80, 443 77s
storefront-rewrite-ingress store.123.456.789.999.nip.io 80, 443 77s
zipkin-direct-ingress store.123.456.789.999.nip.io 80, 443 75s
```
One thing that you may have noticed is that the ingress controller is running in the ingress-nginx namespace, but when we create the rules we are using the namespace we specified (in this case tg_helidon) This is because the rule needs to be in the same namespace as the service it's defining the connection two, but the ingress controller service exists once for the cluster (we could have more pods if we wanted, but for this lab it's perfectly capable of running all we need) We could put the ingress controller into any namespace we chose, kube-system might be a good choice in a production environment. If we wanted different ingress controllers then for nginx at any rate the --watch-namespace option restricts the controller to only look for ingress rules in specific namespaces.
7. Look at the ingress yaml files and you'll see the rules in them sets up the following mappings
Direct mappings
`/zipkin -> zipkin:9411/zipkin`
`/store -> storefront:8080/store`
`/stocklevel -> stockmanager:8081/stocklevel`
`/sf/ -> storefront:8080/ e.g. /sf/status -> storefront:8080/status`
`/sm/ -> stockmanager:8081/ e.g. /sm/status -> stockmanager:8081/status`
`/sfmgt/ -> storefront:9080/ e.g. /sfmgt/health -> storefront:9080/health`
`/smmgt/ -> stockmanager:9081/ e.g. /smmgt/metrics -> stockmanager:8081/metrics`
`/openapi -> storefront:8080/openapi`
Notice the different ports in use on the target are actually specified by name in the yaml file, that name comes from the name specified in the service definition, using a name means that if we do need to change the port we only need to change it in a single location.
8. We now have a working endpoint, let's try accessing it using curl (`$EXTERNAL_IP` should contain your Load balancer IP address) - expect an http error, if you get a `Host not found` or similar error then your cloud shell session has been restarted and the variable will need to be reset.
How to check if $EXTERNAL_IP is set, and re-set it if it's not
**To check if `$EXTERNAL_IP` is set**
If you want to check if the variable is still set type `echo $EXTERNAL_IP` if it returns the IP address you're ready to go, if not then you'll need to re-set it.
**To get the external IP address if you no longer have it**
In the OCI Cloud shell type
```bash
kubectl --namespace ingress-nginx get services -o wide ingress-nginx-controller
```
```
NAME TYPE CLUSTER-IP EXTERNAL-IP PORT(S) AGE SELECTOR
ingress-nginx-controller LoadBalancer 10.96.61.56 132.145.235.17 80:31387/TCP,443:32404/TCP 45s app.kubernetes.io/component=controller,app.kubernetes.io/instance=ingress-nginx,app.kubernetes.io/name=ingress-nginx
```
The External IP of the Load Balancer connected to the ingresss controller is shown in the EXTERNAL-IP column.
**To set the variable again**
```bash
export EXTERNAL_IP=[External IP]
```
---
```bash
curl -i -k -X GET https://store.$EXTERNAL_IP.nip.io/store
```
```
HTTP/2 503
server: nginx/1.17.8
date: Fri, 27 Mar 2020 09:20:42 GMT
content-type: text/html
content-length: 197
strict-transport-security: max-age=15724800; includeSubDomains
503 Service Temporarily Unavailable
503 Service Temporarily Unavailable
nginx/1.17.8
```
What's with the -k flag ?
Previously we didn't use the -k flag or https when testing in the Helidon labs. That's because in the development phase we were using a direct http connection and connecting to a service running locally, and the micro-service itself didn't use https. Now we're using the ingress controller to provide us with a secure https connection (because that's what you should do in a production environment) we need to tell curl not to generate a error because in this case we're using a self signed certificate. Of course in production you'd be using a proper certificate with a real certificate chain and wouldn't need to worry about it.
---
We got a **service unavailable** error. This is because that web page is recognised as an ingress rule, but there are no pods able to deliver the service. This isn't a surprise as we haven't started them yet!
10. If we tried to go to a URL that's not defined we will as expected get a **404 error**:
```bash
curl -i -k -X GET https://store.$EXTERNAL_IP.nip.io/unknowningress
```
```
HTTP/2 404
server: nginx/1.17.8
date: Fri, 27 Mar 2020 09:22:24 GMT
content-type: text/plain; charset=utf-8
content-length: 21
strict-transport-security: max-age=15724800; includeSubDomains
default backend - 404
```
This is being served by the default backend service that was installed at the same time as the ingress controller. It's possible to [customize the behavior of the default backend](https://kubernetes.github.io/ingress-nginx/user-guide/default-backend/), for example replacing the error page and so on.
For more information on the nginx ingress controller and the different rules types see the [nginx ingress default backend docs page.](https://github.com/kubernetes/ingress-nginx/tree/master/docs)
For see the doc more information on how the regular expressions with with see the [nginx ingress path matching page.](https://kubernetes.github.io/ingress-nginx/user-guide/ingress-path-matching/)
## Task 5: Secrets, configmaps - external configuration for your containers
Introduction to Kubernetes secrets
As when running the docker images we need to specify the external configuration for Kubernetes. This is different from when running with docker though, in docker we just reference the local file system, however in Kubernetes we don't even know what node a pod will be running on, which makes it a little difficult to provide a docker volume there, so we need something different.
Kubernetes has a concept of volumes similar to that of docker in that a volume is something outside a container that can be made visible inside the container. This might be for persistent storage (for example the tablespace files of a production database should continue existing, even after the pod holding the database has been shutdown) and Kubernetes supports many types of sources for the volumes (e.g. nfs, iSCSI and most cloud providers offer storage services particular to their cloud such as the Oracle Cloud Storage service)
There are also configmaps (we'll look at these in a bit) which are basically a JSON or YAML configuration, a map can be created like any other Kubernetes object (and it can also be dynamically modified) then made available. For a lot of configuration data held in YAML or JSON this is a very effective approach as it allows for easy modification and updates (though that can itself of course trigger change management issues)
Some data however probably should not be stored in a visible storage mechanism, or at the very least should not be easy to see (e.g. usernames / password for access controls, database login details etc.) To support this type of configuration data Kubernetes supports a special volume type called secrets. This information is never written to inside Kubernetes and is maintained on the Kubernetes management nodes as in-memory data. So if your entire management cluster fails for some reason then the secrets will have to be re-created.
A secret can be mounted into the pod like any other type of volume. They represent a file, ***or*** a directory of files. This means you could have a single secret holding configuration information (for example the configuration file we're using for testing holding the usernames, passwords and roles, or the OJDBC wallet folder which contains a number of files.
Creating a secret is pretty simple, for example (**don't type this**)
```bash
$ kubectl create secret generic sm-wallet-atp --from-file=confdir/Wallet_ATP
secret/sm-wallet-atp created
```
The stock manager and storefront both require configuration data and the stock manager also requires the database wallet directory. As the configuration data also includes the authentication data I've decided to store some of this into secrets, though in a real situation the configuration information (except for the authentication server details) would probably be stored in a config map rather than a secret. We'll look at config maps later
There are also more specific secrets used for TLS certificates and pulling docker images from private registries, these have additional arguments to the create command. For example a rocker registry secret to pull docker images from a private registry - this is a special type of secret in that it specifically has attributes for docker images
---
### Task 5a: Configuring the database connection details
If you used the scripts to create your database you don't need to do this step by hand as they will have set the database configuration up for you, but if you created the database by hand you will need to expend this section and perform the steps.
I created the database by hand, how to I configure the DB credentials ?
In The Helidon labs we provided the database details via Java system properties using the command line. We don't want to do that here as it we would have to place them in the image (making it insecure, and also hard to update) To get around that (and to show the flexibility of the Helidon framework) here we will be specifying them using environment variables, because Helidon uses a hierarchy of sources for the configuration we don't even need to change the code to do this!
We will of course be using a Kubernetes secret to hold them (they are sensitive, so placing them in a deployment yaml file which might be accessible by many folks would also be a bad idea) **You** need to update them with the setting for **your** database, these were downloaded for you by the database setup scripts.
1. Create the wallet directory and navigate to it:
```bash
mkdir -p $HOME/helidon-kubernetes/configurations/stockmanagerconf/Wallet_ATP
```
```bash
cd $HOME/helidon-kubernetes/configurations/stockmanagerconf/Wallet_ATP
```
2. Copy the wallet file to the directory
```bash
cp $HOME/Wallet.zip .
```
3. Unzip the wallet file
```bash
unzip Wallet.zip
```
4. Look at the contents of the tnsnames.ora file to get the database connection names
```bash
cat tnsnames.ora
```
```
jleoow_high = (description= (retry_count=20)(retry_delay=3)(address=(protocol=tcps)(port=1522)(host=adb.eu-frankfurt-1.oraclecloud.com))(connect_data=(service_name=cgipkrq1hwcdlkv_jleoow_high.atp.oraclecloud.com))(security=(ssl_server
_cert_dn="CN=adwc.eucom-central-1.oraclecloud.com,OU=Oracle BMCS FRANKFURT,O=Oracle Corporation,L=Redwood City,ST=California,C=US")))
jleoow_low = (description= (retry_count=20)(retry_delay=3)(address=(protocol=tcps)(port=1522)(host=adb.eu-frankfurt-1.oraclecloud.com))(connect_data=(service_name=cgipkrq1hwcdlkv_jleoow_low.atp.oraclecloud.com))(security=(ssl_server_c
ert_dn="CN=adwc.eucom-central-1.oraclecloud.com,OU=Oracle BMCS FRANKFURT,O=Oracle Corporation,L=Redwood City,ST=California,C=US")))
jleoow_medium = (description= (retry_count=20)(retry_delay=3)(address=(protocol=tcps)(port=1522)(host=adb.eu-frankfurt-1.oraclecloud.com))(connect_data=(service_name=cgipkrq1hwcdlkv_jleoow_medium.atp.oraclecloud.com))(security=(ssl_se
rver_cert_dn="CN=adwc.eucom-central-1.oraclecloud.com,OU=Oracle BMCS FRANKFURT,O=Oracle Corporation,L=Redwood City,ST=California,C=US")))
jleoow_tp = (description= (retry_count=20)(retry_delay=3)(address=(protocol=tcps)(port=1522)(host=adb.eu-frankfurt-1.oraclecloud.com))(connect_data=(service_name=cgipkrq1hwcdlkv_jleoow_tp.atp.oraclecloud.com))(security=(ssl_server_cer
t_dn="CN=adwc.eucom-central-1.oraclecloud.com,OU=Oracle BMCS FRANKFURT,O=Oracle Corporation,L=Redwood City,ST=California,C=US")))
jleoow_tpurgent = (description= (retry_count=20)(retry_delay=3)(address=(protocol=tcps)(port=1522)(host=adb.eu-frankfurt-1.oraclecloud.com))(connect_data=(service_name=cgipkrq1hwcdlkv_jleoow_tpurgent.atp.oraclecloud.com))(security=(ss
l_server_cert_dn="CN=adwc.eucom-central-1.oraclecloud.com,OU=Oracle BMCS FRANKFURT,O=Oracle Corporation,L=Redwood City,ST=California,C=US")))
```
You will see a list of the various connection types to your database.
5. Locate the "high" connection type to your database and take a note of the full name, in the example above that's `jleoow_high` **but yours will differ**
6. Switch to the config files directory
```bash
cd $HOME/helidon-kubernetes/configurations/stockmanagerconf
```
7. **Edit** the file `databaseConnectionSecret.yaml`
8. Locate the `url` (in the `stringData` section)
```yaml
url: jdbc:oracle:thin:@?TNS_ADMIN=./Wallet_ATP
```
9. Replace `` with the connection name for **your** database you got from the `tnsnames.ora` file earlier. In my case that was `jleoow_high`, **but yours will be different**
For **me** the line looked like this, **YOURS WILL BE DIFFERENT**
```yaml
url: jdbc:oracle:thin:@jleoow_high?TNS_ADMIN=./Wallet_ATP
```
If you used a different username or password then you will need to update those fields as well.
10. Save the changes to the file and exit the editor
We will create the secret that contain this information using a script later.
How do these values get into the container ?
In the deployment (we'll see more on this later) the specification defines a section telling Kubernetes what environment variables to create in the pod, and where to get the values from. So for example in this case wherwe we're specifying the JDBC URL for the connection the depoloyment has an entry of the form
```yaml
- name: javax.sql.DataSource.stockmanagerDataSource.dataSource.url
valueFrom:
secretKeyRef:
name: stockmanagerdb
key: url
```
Here we're telling Kubernetes to look in the `stockmanagerdb` secret for a data value named `url` and within the pod create an environment variable named `javax.sql.DataSource.stockmanagerDataSource.dataSource.url` with that value.
---
</details>
### Task 5b: Creating the secrets
1. Switch back to the scripts directory
```bash
cd $HOME/helidon-kubernetes/base-kubernetes
```
2. Run the following command to create the secrets:
```bash
bash create-secrets.sh
```
```
create-secrets.sh Using default context name of one
Deleting existing store front secrets
sf-conf
Deleting existing stock manager secrets
sm-conf
sm-wallet-atp
Deleted secrets
Secrets remaining in namespace are
NAME TYPE DATA AGE
default-token-7tk9z kubernetes.io/service-account-token 3 22s
Creating stock manager secrets
sm-wallet-atp
secret/sm-wallet-atp created
Createing stockmanager secrets
secret/sm-conf-secure created
Creating store front secrets
secret/sf-conf-secure created
Existing in namespace are
NAME TYPE DATA AGE
default-token-7tk9z kubernetes.io/service-account-token 3 23s
my-docker-reg kubernetes.io/dockerconfigjson 1 1s
sf-conf-secure Opaque 1 0s
sm-conf-secure Opaque 2 1s
sm-wallet-atp Opaque 7 1s
```
Feel free to look at the script, it just uses kubectl to issue commands, we just script it to reduce the amount of copy-and-paste
If you had made a mistake editing the file or get an error when executing it just re-edit the *create-secrets.sh* script and run it again, it will reset to a known state before creating the secrets again so running it multiple times is safe.
If you want to modify a secret then you simply use kubectl to edit it with the new values (or delete it, then add it's replacement). When a secret is modified (and if you've told Helidon to look for changes) then changes to the secret will be reflected as changes in the configuration. Depending on how your code accesses those, the change may be picked up by your existing code, or you may need to restart the pod(s) using the updated secrets.
3. Listing the secrets is simple:
```bash
kubectl get secrets
```
```
NAME TYPE DATA AGE
default-token-7tk9z kubernetes.io/service-account-token 3 5m31s
sf-conf-secure Opaque 1 5m8s
sm-conf-secure Opaque 2 5m9s
sm-wallet-atp Opaque 7 5m9s
```
4. To see the content of a specific secret :
```bash
kubectl get secret sm-conf-secure -o yaml
```
```
apiVersion: v1
data:
stockmanager-security.yaml: c2VjdXJpdHk6CiAgcHJvdmlkZXJzOgogICAgIyBlbmFibGUgdGhlICJBQkFDIiBzZWN1cml0eSBwcm92aWRlciAoY
...
XIiXQogICAgICAgICAgLSBsb2dpbjogImpvZSIKICAgICAgICAgICAgcGFzc3dvcmQ6ICJwYXNzd29yZCI=
kind: Secret
metadata:
creationTimestamp: "2019-12-31T20:02:38Z"
name: sm-conf-secure
namespace: tg-helidon
resourceVersion: "481765"
selfLink: /api/v1/namespaces/tg-helidon/secrets/sm-conf-secure
uid: 7ef4aaf6-2c08-11ea-bd2b-025000000001
type: Opaque
```
The contents of the secret is base64 encoded, to see the actual content we need to use a base64 decoder, in the following replace with the stockmanager-security.yaml data in result from above, (it starts c2VjdXJpdHk in this example) :
5. To get the secret in plain text
```bash
echo [your secret payload] | base64 -d -i -
```
```yaml
security:
providers:
# enable the "ABAC" security provider (also handles RBAC)
- abac:
# enabled the HTTP Basic authentication provider
- http-basic-auth:
realm: "helidon"
users:
- login: "jack"
password: "password"
roles: ["admin"]
- login: "jill"
password: "password"
roles: ["user"]
- login: "joe"
password: "password"
outbound:
- name: "propogate-to-everyone"
hosts: ["*"]
```
The dashboard is actually a lot easier in this case.
6. In the dashboard UI
7. Chose **your** namespace in the namespace selector (upper left) tg-helidon in my case, but yours may differ
8. Click on the **Secrets** choice in the **Config and Store** section of the left hand menu.
9. Select the sf-conf-secure entry to see the list of files in the secret
10. Click on the eye icon next to the storefront-security.yaml to see the contents of the secret.
For security reasons Kubernetes only stores the secrets in memory, they are not written to permenant storage.
### Task 5c: Configuration
If you used the scripts to create your environment you don't need to do this step by hand as they will have set the stockmanager configuration up for you, but if you created the instanced by hand you will need to expend this section and perform the steps.
I created the environment by hand, how to I configure the stockmanager details ?
Now all configuration information needs to be secret, we'e going to look at config maps in a moment, but first we need to add some configuration information
To allow for some lab situations where there are multiple users in the same database we separate tables by department Id, like many other parts of these labs this will be based on your name or initials.
We need to configure the stockmanager-config.yaml file. You need to do this even if you have done the Helidon labs as the set of configuration data downloaded into the OCI Cloud Shell is generic and does not include the customizations you made in the Helidon labs
1. Navigate into the folder
```bash
cd $HOME/helidon-kubernetes/configurations/stockmanagerconf/conf
```
2. Open the file **stockmanager-config.yaml**
3. In the `app:` section, add a property **department** with **your** your name, initials or something that's going to be **unique**
- `department: "your_name"`
Example (Yours will be different of course)
```yaml
app:
persistenceUnit: "stockmanagerJTA"
department: "timsDepartment"
```
4. Save the changes to the file
5. Switch back to the scripts directory
```bash
cd $HOME/helidon-kubernetes/base-kubernetes
```
### Task 5d: Config Maps
Intro to Kubernetes Config Maps
Secrets are great for holding information that you don't want written visibly in your cluster, and you need to keep secret. But the problem with them is that if all the cluster management goes down then the secrets are lost and will need to be recreated. Note that some Kubernetes implementations (the docker / Kubernetes single node cluster on my laptop for example) do actually persist the secrets somewhere.
For a lot of configuration information we want it to be persistent in the cluster configuration itself. This information would be for example values defining what our store name is, or other information that is not confidential.
There are many ways of doing this, (after all it's just a volume when presented to the pod) but one of the nicer ones is to store a config map into Kubernetes, and then make that map available as a volume into the pod.
Creating a config map can be done in many ways, you can specify a set of key / value pairs as a string via the command line, but if you already have the config info in a suitable format the easiest way is to just import the config file as a sequence of characters.
For example (**don't type this**) `$ kubectl create configmap sf-config-map --from-file=projectdir/conf` would create a secret using the specified directory as a source. A "sub" entry in the config map is created for each file
---
In the $HOME/helidon-kubernetes/base-kubernetes folder there is a script create-configmaps.sh. We have created this to help you setup the configuration maps (though you can of course do this by hand instead of creating a script). If you run this script it will delete existing config maps and create an up to date config for us :
1. Run the script to create the config maps
```bash
bash create-configmaps.sh
```
```
create-configmaps.sh Using default context name of one
Deleting existing config maps
sf-config-map
configmap "sf-config-map" deleted
sm-config-map
configmap "sm-config-map" deleted
Config Maps remaining in namespace are
No resources found in tg-helidon namespace.
Creating config maps
sf-config-map
configmap/sf-config-map created
sm-config-map
configmap/sm-config-map created
Existing in namespace are
NAME DATA AGE
sf-config-map 2 0s
sm-config-map 2 0s
```
As with the secretd we are using a script to make it easier, feel free to look at the contents of the script, you'll see it's kubectl command that select any old entries (if they exist) then creates new ones.
2. To get the list of config maps we need to ask kubectl or look at the config maps in the dashbaord:
```bash
kubectl get configmaps
```
```
NAME DATA AGE
sf-config-map 2 37s
sm-config-map 2 37s
```
3. We can get more details by getting the data in JSON or YAML, in this case I'm extracting it using YAML as that's the origional data format:
```bash
kubectl get configmap sf-config-map -o=yaml
```
```yaml
apiVersion: v1
data:
storefront-config.yaml: |-
app:
storename: "My Shop"
minimumdecrement: 3
#tracing:
# service: "storefront"
# host: "zipkin"
storefront-network.yaml: "server:\n port: 8080\n host: \"0.0.0.0\"\n sockets:\n
\ admin:\n port: 9080\n bind-address: \"0.0.0.0\"\n\nmetrics:\n routing:
\"admin\"\n\nhealth:\n routing: \"admin\"\n \n"
kind: ConfigMap
metadata:
creationTimestamp: "2019-12-31T20:09:58Z"
name: sf-config-map
namespace: tg-helidon
resourceVersion: "482505"
selfLink: /api/v1/namespaces/tg-helidon/configmaps/sf-config-map
uid: 84cdf8f5-2c09-11ea-bd2b-025000000001
```
As we'll see later we can also update the text by modifying the file and re-creating the config map, or using the dashboard to edit the YAML representing the config map.
## Task 6: Deploying the actual microservices
It's been quite a few tasks (many of which are one off and don't have to be repeated for each application we want to run in Kubernetes) but we're finally ready to create the deployments and actually run our Helidon microservices inside of Kubernetes!
About the deployment files
A deployment is the microservice itself, this is a replica set containing one or more pods. The deployment itself handles things like rolling upgrades by manipulating the replica sets. A replica set is a group of pods, it will ensure that if a pod fails (the program stops working) that another will be started. It's possible to add and remove replicas form a pod, but the key thing to note is that all pods within a replica set are the same. Finally we have the pods. In most cases a pod will contain a single user container (based on the image you supply) and if the container exits then a new one will be started. Pods may also contain Kubernetes internal containers (for example to handle network redirections) and also pods can contain more than one user container, for example in the case of a web app a pod may have one container to operate the web app and another for a web server delivering the static content.
Pods are monitored by services so that a service will direct traffic to pod(s_ that have labels (names / values) which match those specified in the services selector. If there are multiple pods matching then the Kubernetes netowrking layer switched between them, usually with a round robin approach (at least until we look at health and readiness!)
The stockmanager-deployment.yaml, storefront-deployment.yaml and zipkin-deployment.yaml files contain the deployments. These files are in the helidon-kubernetes folder (***not*** the base-kubernetes folder) The following is the core contents of storefront-deployment.yaml file (actually the file has substantial amounts of additional content that is commented out, but we'll get to that when we look at other parts of the lab later on, If you do look at the file itself for now ignore everything that's commented out with #)
```yaml
apiVersion: apps/v1
kind: Deployment
metadata:
name: storefront
```
As with most kubenetes config files there is a first section that defines what we are creating (in this case a deployment names storefront) The deployment actually contains elements defining the replica sets the deployment contains, and what the pods will look like. These can all be defined in separate config files if desired, but as they are very closely bound together it's easiest to define them all in a single file.
```yaml
spec:
replicas: 1
selector:
matchLabels:
app: storefront
```
The `spec:` section defines what we want created. Replicas means how many pods we want creating in the replica set, in this case 1 (we will look at scaling later) the selector match labels specifies that and pods with label app:storefront will be part of the deployment.
```yaml
template:
metadata:
labels:
app: storefront
```
The template section defines what the pods will look like, it starts by specifying that they will all have `app:storefront` as a label
```yaml
spec:
containers:
- name: storefront
image: fra.ocir.io/oractdemeabdmnative/h-k8s_repo/storefront:0.0.1
imagePullPolicy: IfNotPresent
ports:
- name: service-port
containerPort: 8080
- name: health-port
containerPort: 9080
```
The spec section in the template is the specification of the pods, it starts out by specifying the details of the pods and the details of the containers that comprise them, in this case the pod names, the location of the image and how to retrieve it. It also defines the ports that will be used giving them names (naming is not required, but it helps to make it clear what's what).
These service deployment description `image` entry refers to the location in the docker repo that is used for the pre-build shared images. If you using a different docker repo because you have decided to use the images you created in the Helidon and Docker labs you'll need to edit the deployment files to reflect this diffrent image location! More details on this later.
If you were looking at the stockmanager deployment you'd see entries like the below that tell Kubernetes to create environment variables **inside** the pods container, in this case it says the value of the variable comes from a secret names stockmanagerdb and named `dataSourceClassName` (there are actually multiple entries in the stockmanager deployment, but we're only showing one here so you can get the idea.
```yaml
env:
- name: javax.sql.DataSource.stockmanagerDataSource.dataSourceClassName
valueFrom:
secretKeyRef:
name: stockmanagerdb
key: dataSourceClassName
```
Next is the resources section.
```yaml
resources:
limits:
# Set this to me a quarter CPU for now
cpu: "250m"
```
The resources provides a limit for how much CPU each instance of a pod can utilize, in this case 250 mili CPU's or 1/4 whole CPU (the exact definition of what comprises a CPU will vary between Kubernetes deployments and by provider).
```yaml
volumeMounts:
- name: sf-conf-secure-vol
mountPath: /app/confsecure
readOnly: true
- name: sf-config-map-vol
mountPath: /app/conf
readOnly: true
```
We now specify what volumes will be imported into the pods. Note that this defines what volume is connected the pod, the volume definitions themselves are later, in this case the contents of the sf-config-map-vol volume will be mounded on `/app/conf` and sf-config-secure-vol on `/app/confsecure` The code looks for config files relative to it's working directory and jib (the tool that's used to build the containers) configures things to run in `/app` so we need to have the configuration as subdirectories of that.
Both are mounted read only as there's no need for the programs to modify them, so it's good practice to make sure that can't happen accidensally (or deliberately if someone hacks into your application and tries to use that as a way to change the config).
```yaml
volumes:
- name: sf-conf-secure-vol
secret:
secretName: sf-conf-secure
- name: sf-config-map-vol
configMap:
name: sf-config-map
```
We define what each volume is based on, in this case we're saying that the volume sf-config-secure-vol (referenced earlier as being mounted on to /confsecure) has a source based on the secret called sf-conf-secure. the volume sf-config-map-vol (which is mounted onto /conf) will containe the contents of the config map sf-config-map There are many other different types of volume sources, including NFS, iSCSI, local storage to the Kubernetes provider etc.
To deploy the config file we would just use kubectl to apply it with a command that looks like `$ kubectl apply -f mydeployment.yaml` ' (**example, don't type it**)
---
The script deploy.sh will apply all three deployment configuration files (storefront, stockmanager, zipkin) for us.
The docker images refered to in the deployment yaml files are the pre-defined images we provided.
If you did the Helidon and Docker labs and want to use your own images you create there you will have to expand this **Using your own images** and follow the tasks it details.
You want to use your images from the Helidon lab ?
**IMPORTANT**
The config files of the storefront and stockmanager refer to the location in the docker repo and any security keys that you used when setting up the labs. So you'll need to edit the deployment files to reflect the location of **your** images.
- Make sure you are in the folder **helidon-kubernetes**
- Open the file **stockmanager-deployment.yaml**
- Edit the line specifying the image to reflect your docker image location for the stockmanager. The example below shows the config if you chose `tg_repo` as the name, but of course you will have chosen something different!
```yaml
spec:
containers:
- name: stockmanager
image: fra.ocir.io/oractdemeabdmnative/tg_repo/stockmanager:0.0.1
```
- Repeat this operation for the file **storefront-deployment.yaml**
- Edit the line specifying the image to reflect your docker image location for the storefront. Make sure to use the `storefront` image of course!
We need to tell Kubernetes what secret to use when retrieving the docker images from the repository, the imagePullSecrets key allows us to pass this information on.
Find the commented section for the image pull secret and uncomment it so it looks like this
```yaml
imagePullSecrets:
- name: my-docker-reg
```
**Configuring the docker image pull secret**
To get the docker images you created into Kubernetes we need to pull them from the registry. As we did not place the images in a public repo we need to tell Kubernetes the secrets used to do this.
The Oracle Cloud Image Registry (OCIR) that we used to hold the images uses tokens rather than a password. You will have got this token and other related settings for accessing the registry when you gathered the information to push your images to the registry in the docker lab.
To help you setup the image pull secrets and the others used as configuration volumes we have created a script called create-secrets.sh This script deletes any existing secrets and sets up the secrets (in your chosen namespace). This is just a convenience script, you could of course create them by hand, but for a reproducible setup it's best to have these documented in a easily reusable form, and not have to rely on a human remembering to type them!
**You** need to edit the script to provide the details of the OCIR you used and your identity information
If you no longer have this information you can follow these instructions to retrieve them
### Getting the docker login details
The following instructions cover how to prepare to interact with the Oracle Cloud Infrastructure **Docker Registry**. They tell you how to get the following bits of information
- Oracle Cloud Infrastructure Registry region code
- Tenancy Object Storage Namespace
- Full Username
- Authentication Token
Once you have got this information please save it in a notepad or something as you will need it later.
#### Determining the Oracle Cloud Infrastructure Registry region code
The OCIR region code is based on the IATA code for the city hosting the region, for example Frankfurt has an IATA core of `fra` and Amsterdam is `ams`. Unfortunately some cities (e.g. London) have multiple airports, in others the IATA airport code refers to an old name for the city, or the airport itself is not directly named after the city it serves, so we need to look the right code up based on our region.
- To determine your region look at the top of your OCI Console UI in the web browser and you'll see your current region.

- If you click on the name you'll get a list of regions enabled for your tenancy and your home region
You can see here in this example we're using the Frankfurt region, which is also our home region.
Now go to the [OCIR Availability By Region list.](https://docs.cloud.oracle.com/en-us/iaas/Content/Registry/Concepts/registryprerequisites.htm#Availab)
- Locate your region on the list and then to the right identify the region code, for example we can see below in the case of Frankfurt the OCIR region code to use is `fra` for Sydney it's `syd`
#### Determining your tenancy Object Storage Namespace
- Navigate to the **Tenancy Information** screen
- Click the "Hamburger" menu
- In the menu, scroll down to **Administration**,
- Click **Administration** then **Tenancy Details**
- Note down the **Object Storage Namespace** of your tenancy, in the example above this is `frjqogy3byob` **but yours will be different** (this is what we mean when we say mytenancystoragenamespace in these labs)
#### Getting your Authentication Token
If you do not have the authentication token you will need to create a new one.
OCIR uses an authentication token rather than a password. To set an authentication token you need to take the following steps.
- Click on the "Shadow" on the upper right of the console, then on the resulting menu your name, for example
This will open up your user details.
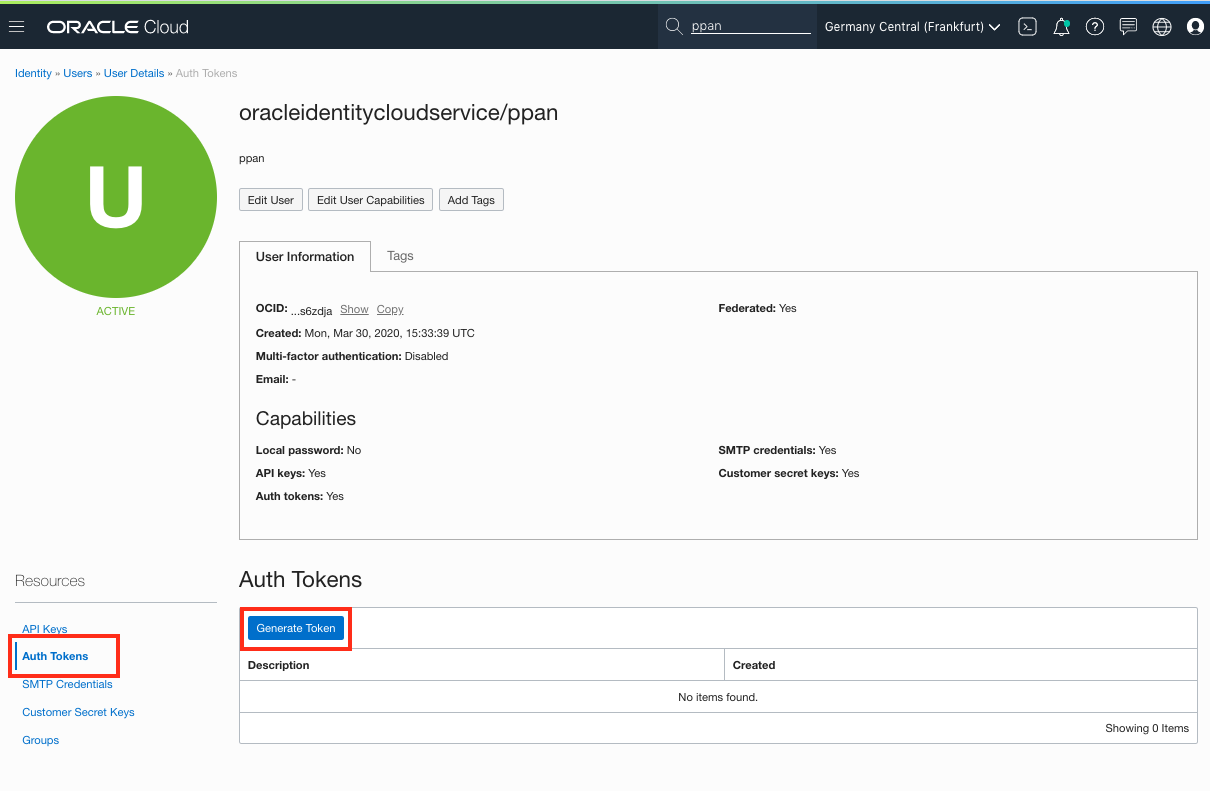
- Select **Token** in the right-hand menu, then click the button **Create Token**.
- Enter a name for the token
- Use the **Copy** button to copy the token in your buffer, and **immediately paste it** in a notebook of your choice, you will need this later.
#### The repo name
You now need the name for your repository, this is a combination of the OCIR registry and tenancy you determined above and a repo name you chose.
An OCIR repo name looks like `.ocir.io/