Part 7 Provision OKE-Day2 Components
This part will enhance your visibility and observability, with some special add set of tools that will help you to manage your Kubernetes.
Add oke-day2 repository as a git source
- Run the following command from CloudShell:
./flux create source git oke-day2 \
--url=https://github.com/oqva-io/oke-day2 \
--branch=master \
--interval=30s
output:
✚ generating GitRepository source
► applying GitRepository source
✔ GitRepository source created
◎ waiting for GitRepository source reconciliation
✔ GitRepository source reconciliation completed
✔ fetched revision: master/c0e55858f151e4dbee64e88c70cdcd40a54f18c2
- Now you can provision the oke-day2 components on your Kubernetes cluster, by running the following command:
./flux create kustomization flux-system \
--source=oke-day2 \
--path="./clusters/default/flux-system" \
--prune=true \
--interval=30s
output:
✚ generating Kustomization
► applying Kustomization
✔ Kustomization created
◎ waiting for Kustomization reconciliation
✔ Kustomization flux-system is ready
✔ applied revision master/c0e55858f151e4dbee64e88c70cdcd40a54f18c2
- Let’s verify that all the pods are in Running state:
watch kubectl get pod -A
- Let’s observe oke-day2 Helm charts are synced
kubectl get helmcharts.source.toolkit.fluxcd.io -A
output:
NAMESPACE     NAME                               CHART                        VERSION   SOURCE KIND      SOURCE NAME              READY   STATUS                                 AGE
flux-system   flux-system-grafana                grafana                      6.1.10    HelmRepository   grafana                  True    Fetched revision: 6.1.10               2m39s
flux-system   flux-system-hello-kubernetes       ./charts/hello-kubernetes    *         GitRepository    oracle-gitops-workshop   True    Fetched and packaged revision: 0.1.2   24h
flux-system   flux-system-kubernetes-dashboard   kubernetes-dashboard         *         HelmRepository   kubernetes-dashboard     True    Fetched revision: 4.0.0                2m39s
flux-system   flux-system-metrics-server         metrics-server               5.0.2     HelmRepository   bitnami                  True    Fetched revision: 5.0.2                2m39s
flux-system   flux-system-observability          ./charts/k8s-observability   *         GitRepository    oke-day2                 True    Fetched and packaged revision: 0.1.0   2m39s
flux-system   flux-system-prometheus             prometheus                   12.0.1    HelmRepository   prometheus               True    Fetched revision: 12.0.1               2m39s
flux-system   flux-system-sealed-secrets         sealed-secrets               1.10.x    HelmRepository   stable                   True    Fetched revision: 1.10.3               2m39s
- Next let’s observe helm charts are installed:
kubectl get helmreleases.helm.toolkit.fluxcd.io -A
output:
NAMESPACE     NAME                   READY   STATUS                             AGE
flux-system   grafana                True    Release reconciliation succeeded   4m5s
flux-system   hello-kubernetes       True    Release reconciliation succeeded   24h
flux-system   kubernetes-dashboard   True    Release reconciliation succeeded   4m4s
flux-system   metrics-server         True    Release reconciliation succeeded   4m4s
flux-system   observability          True    Release reconciliation succeeded   4m4s
flux-system   prometheus             True    Release reconciliation succeeded   4m4s
flux-system   sealed-secrets         True    Release reconciliation succeeded   4m4s
Now that the tools are installed let’s review them (Don’t close the tabs you will need them for the next section):
-
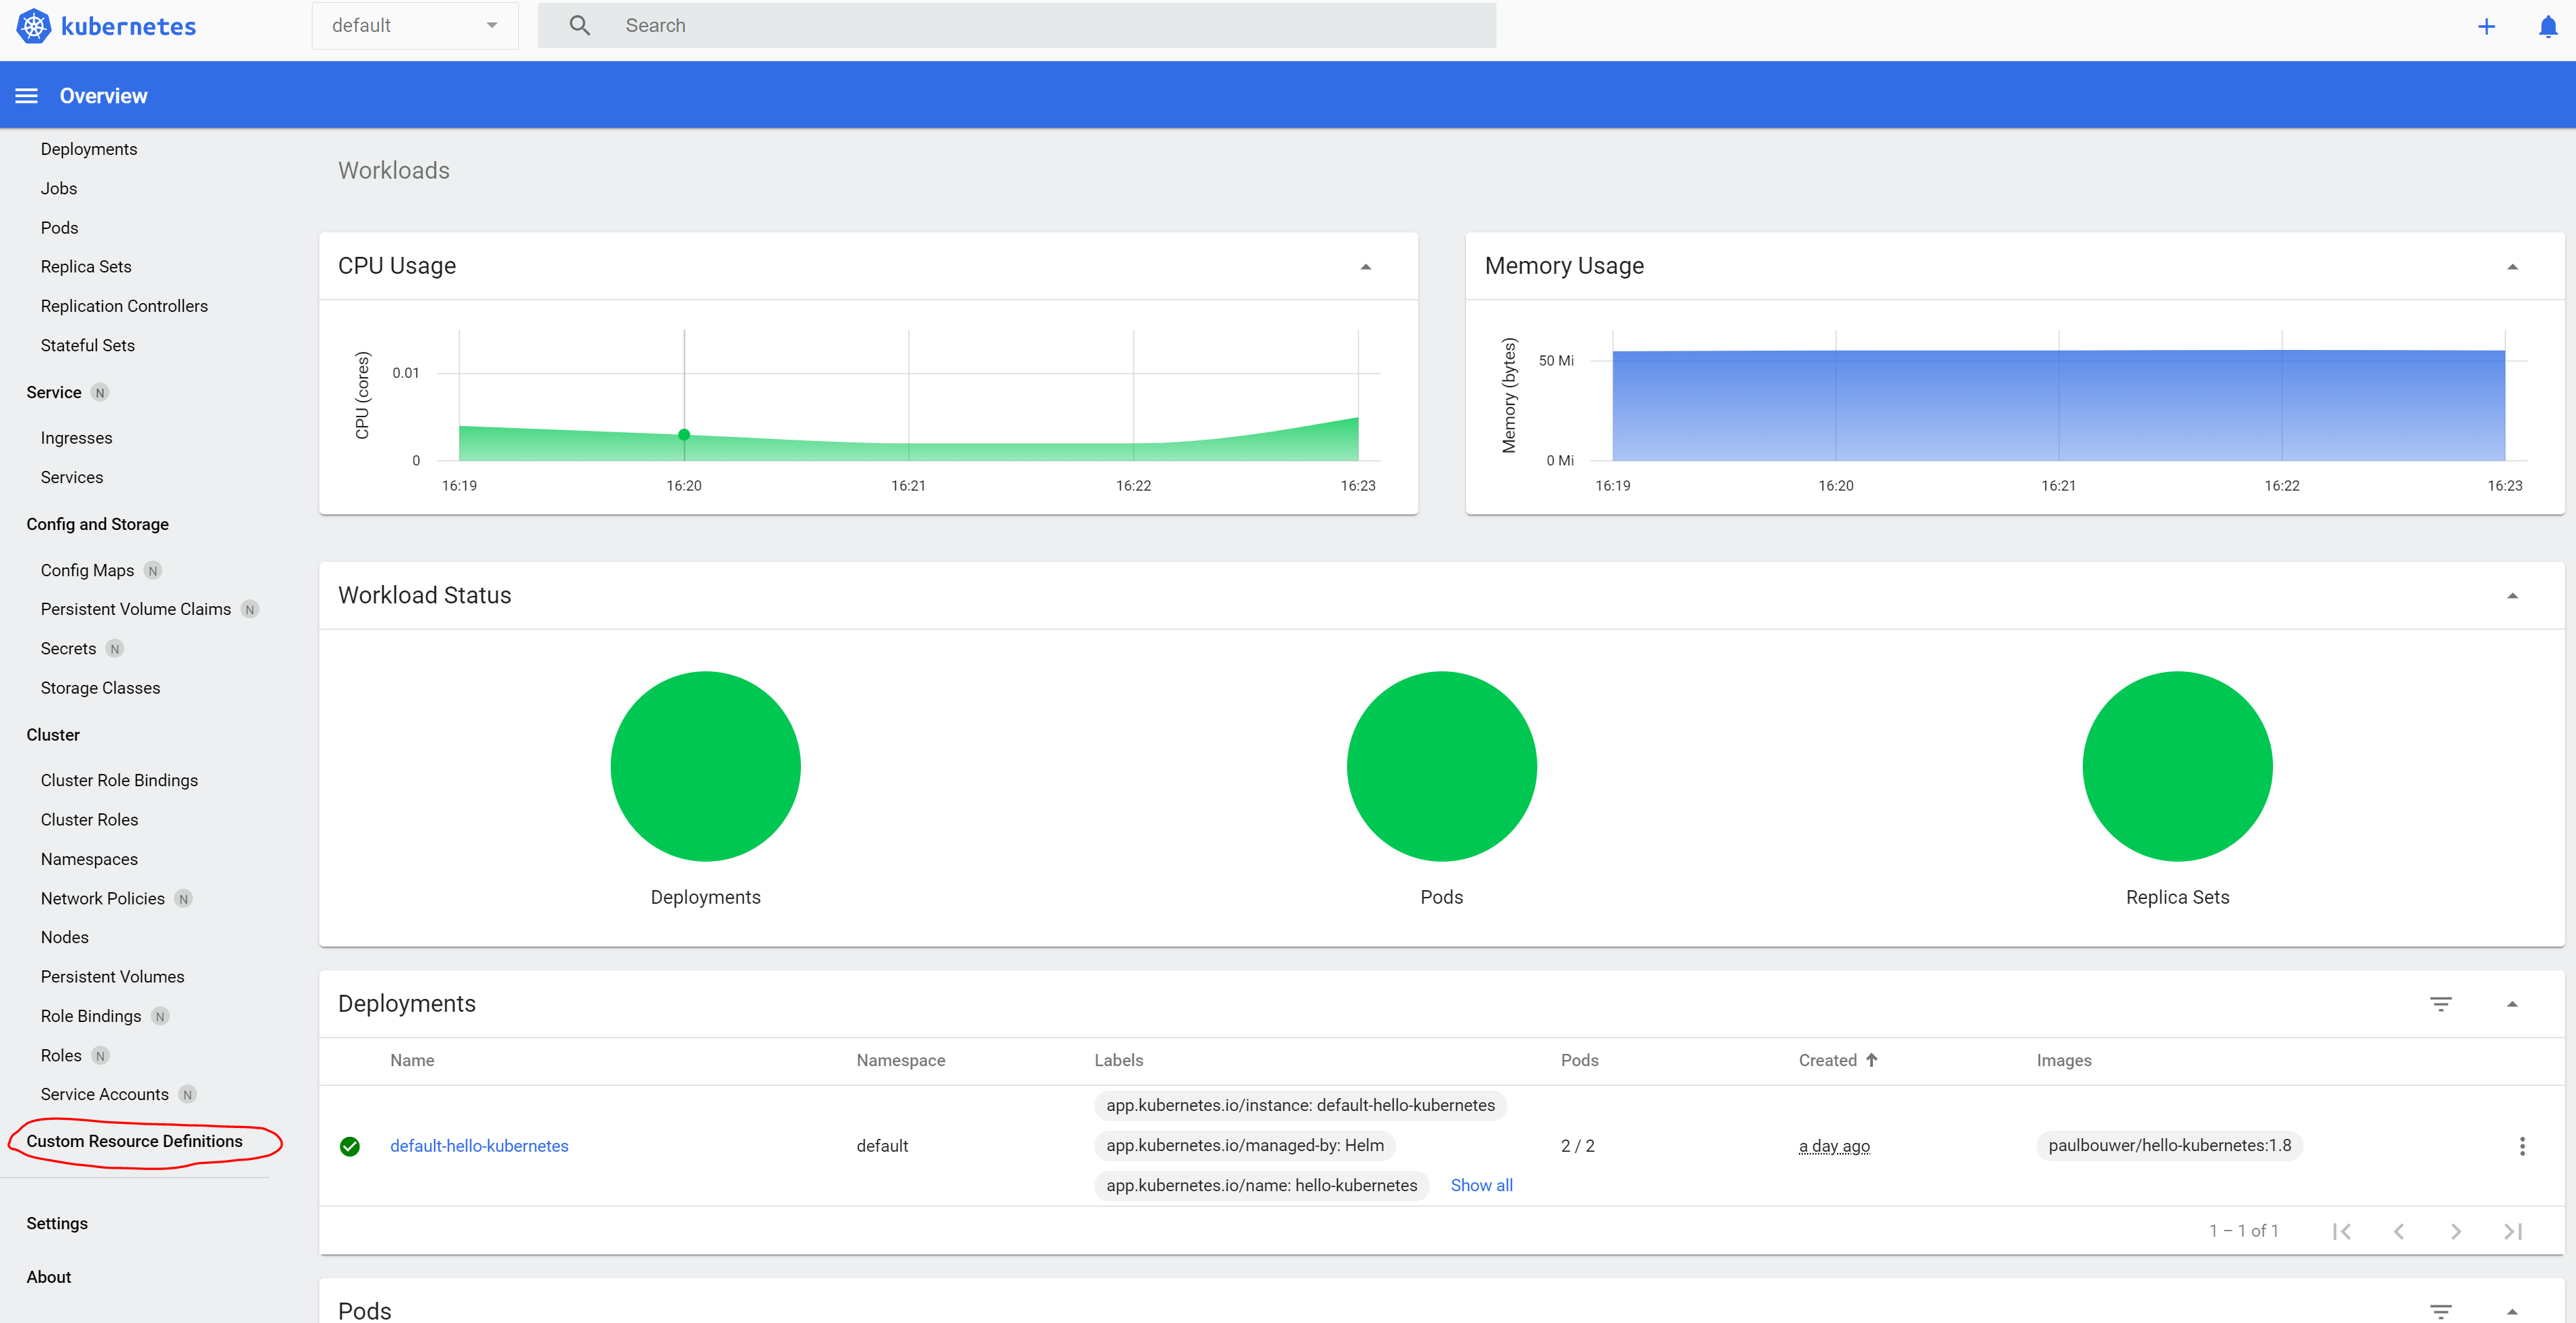
Open a browser window and enter to the installed Kubernetes Dashboard Enter the following URL http://workerIp:30000
-
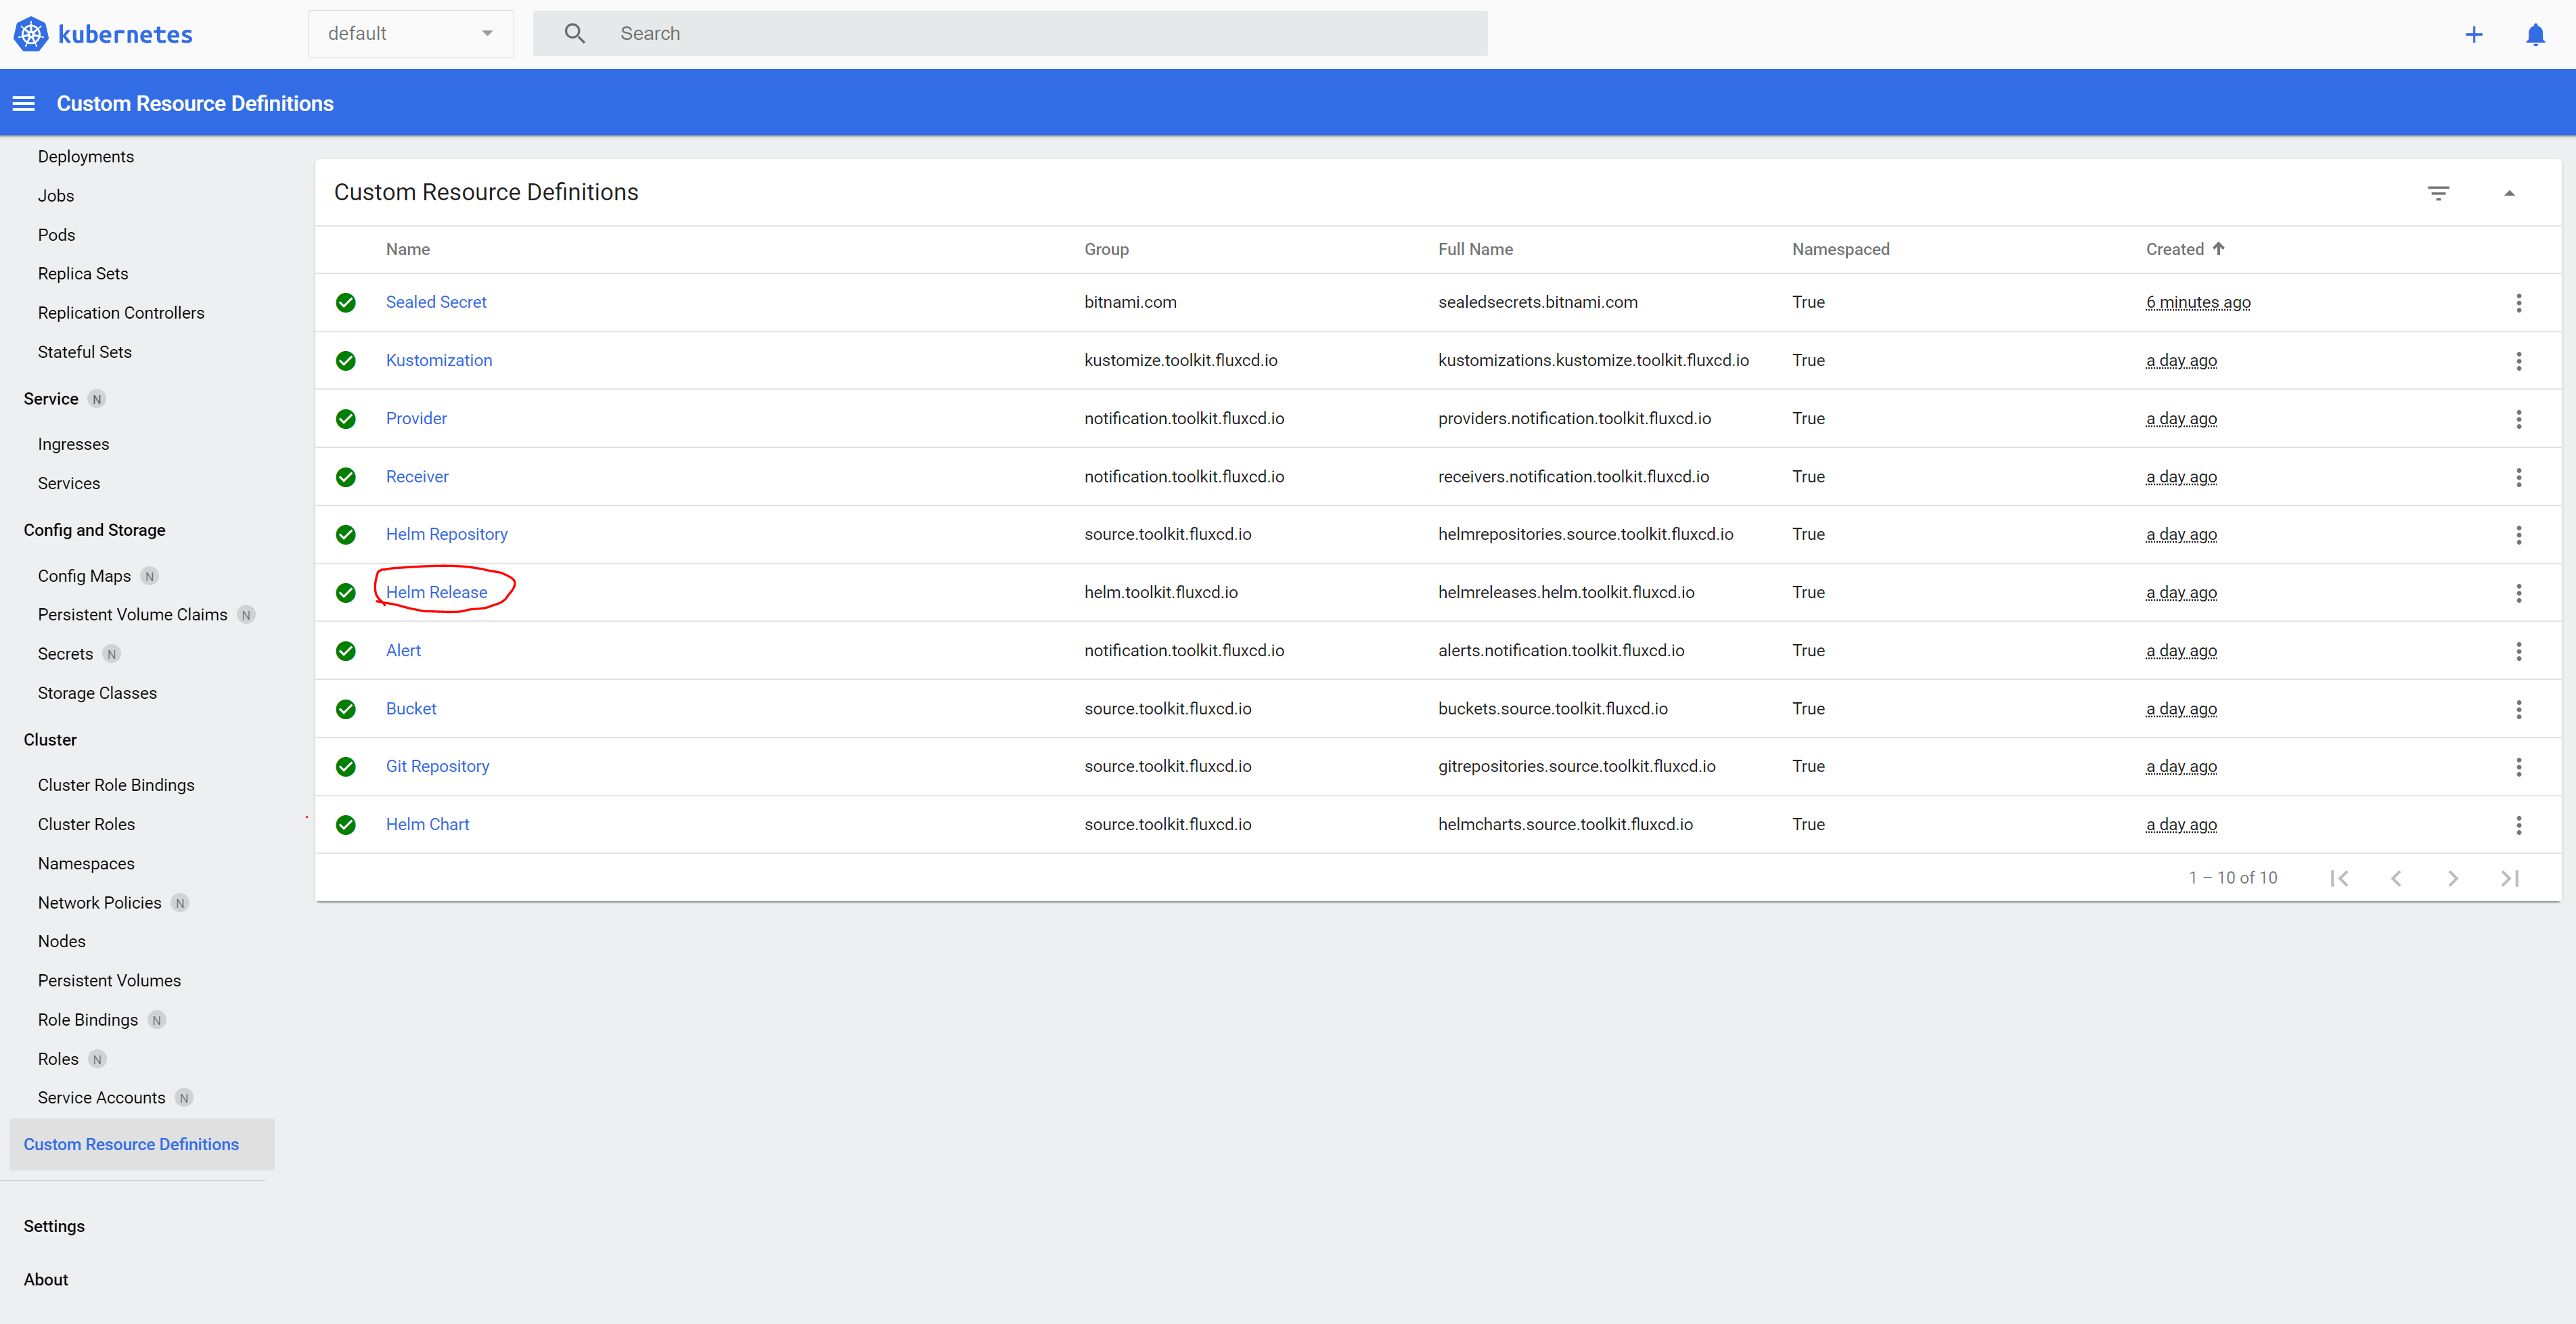
Click on Custom Resource Definitions
- Click on Helm Release
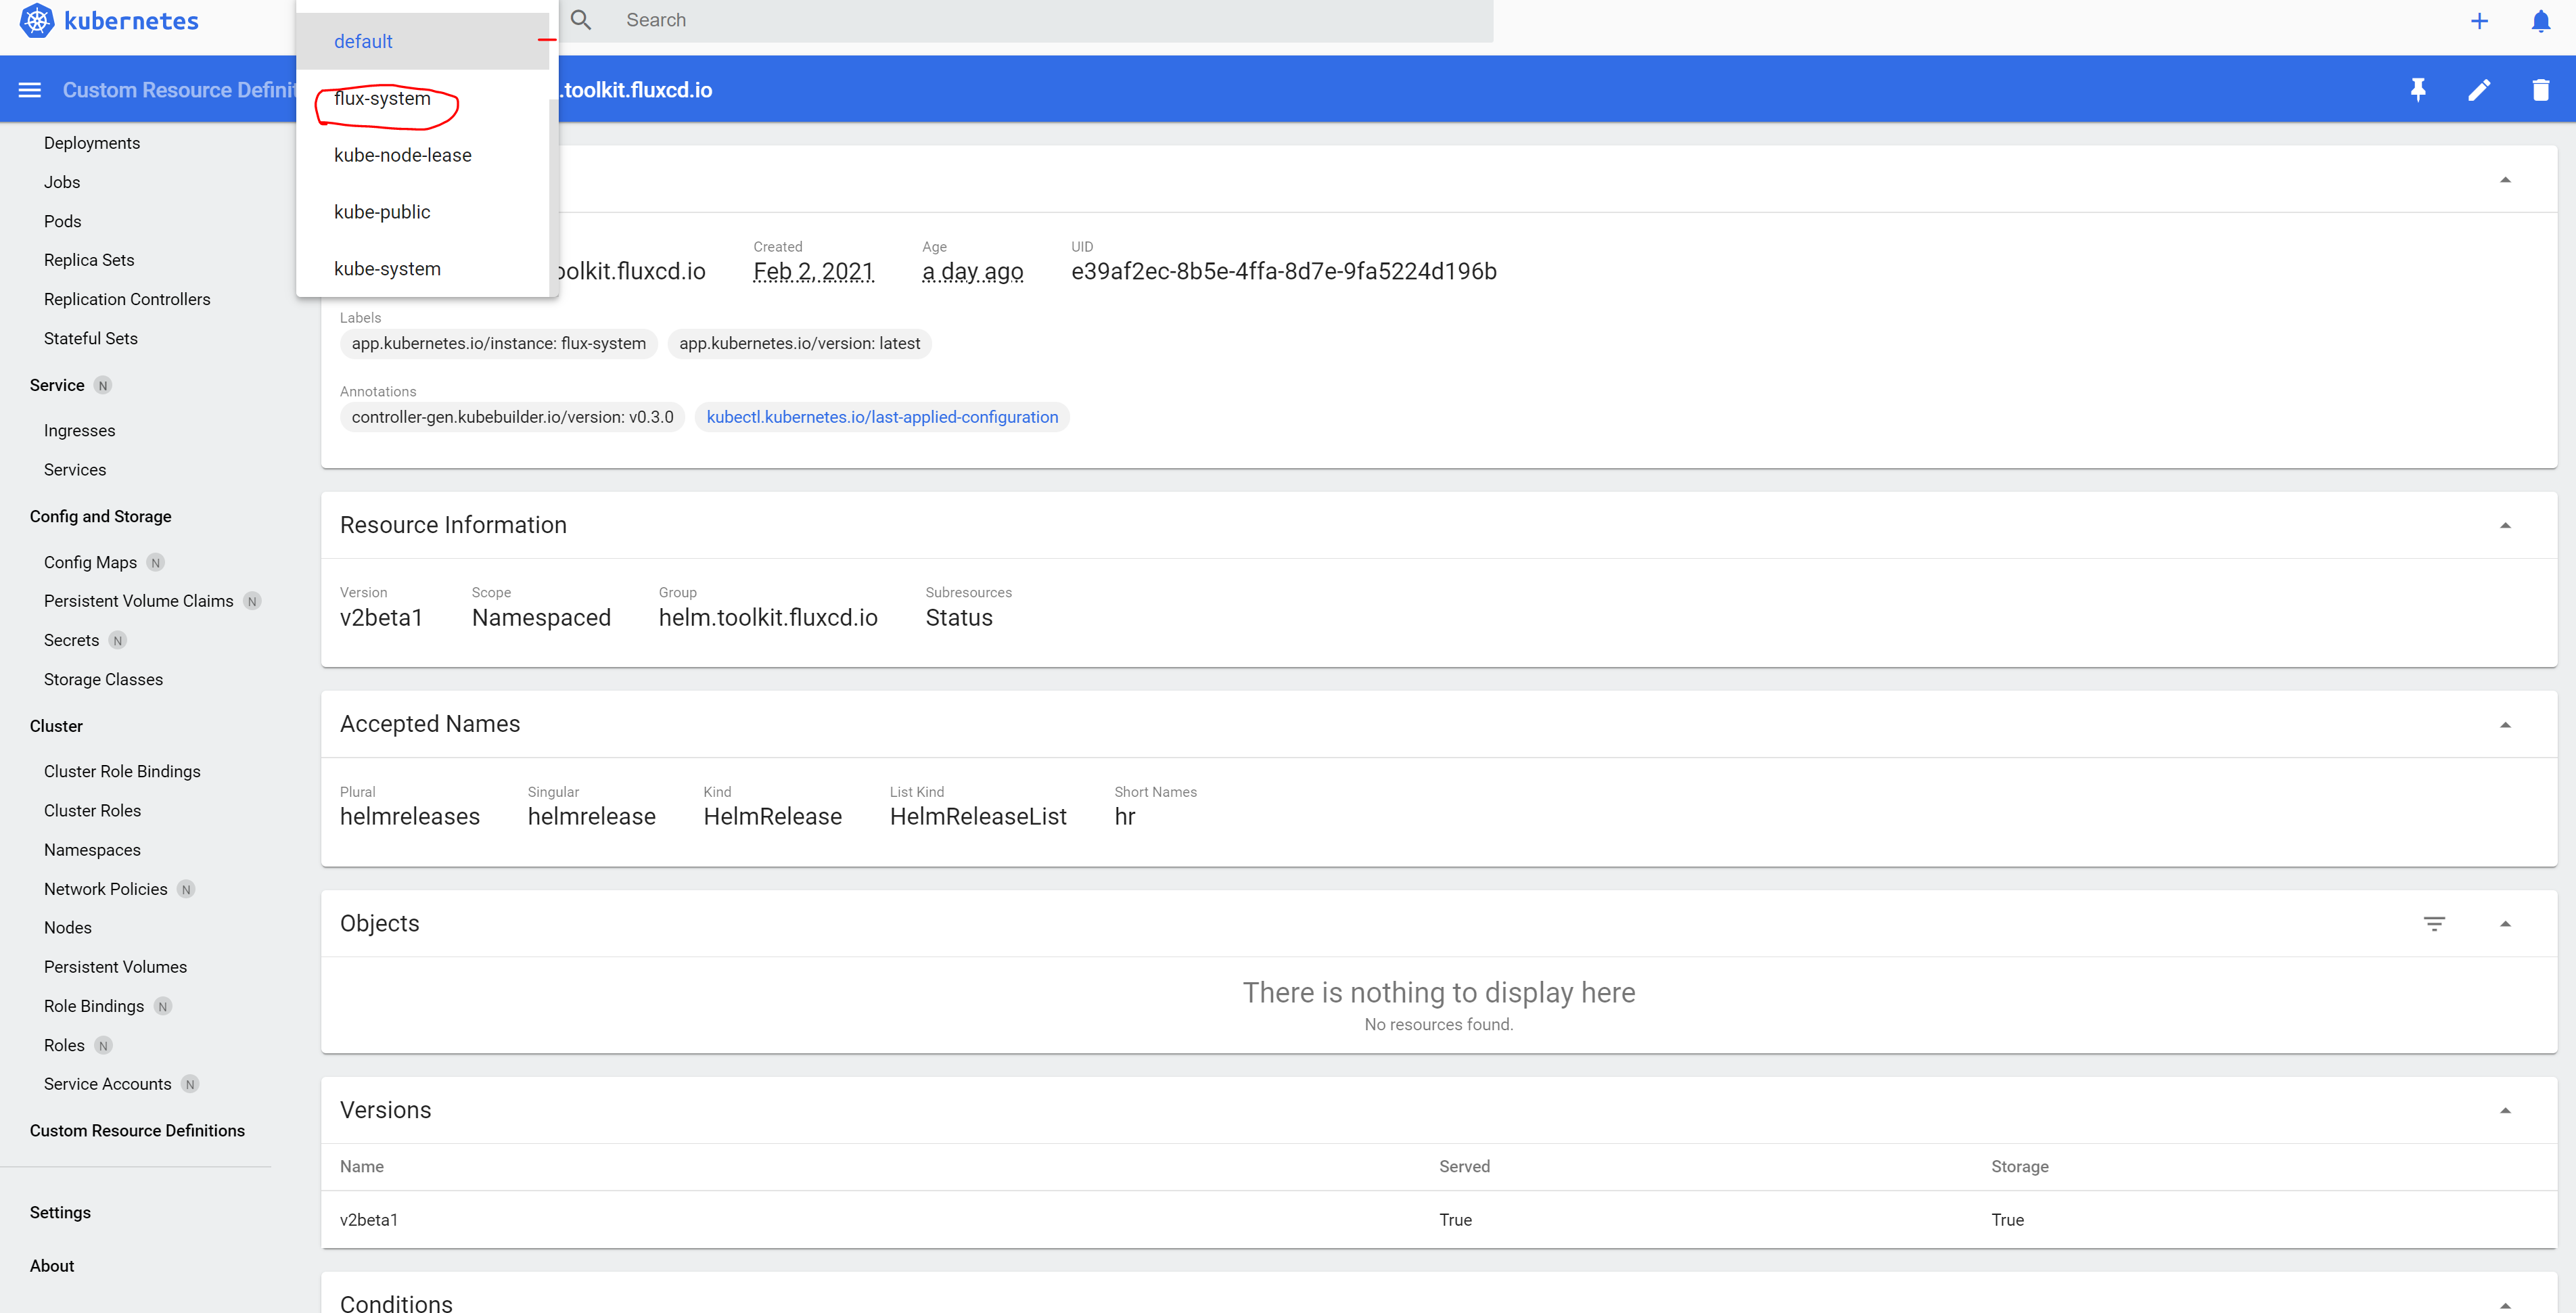
- Choose the flux-system namespace from the top menu
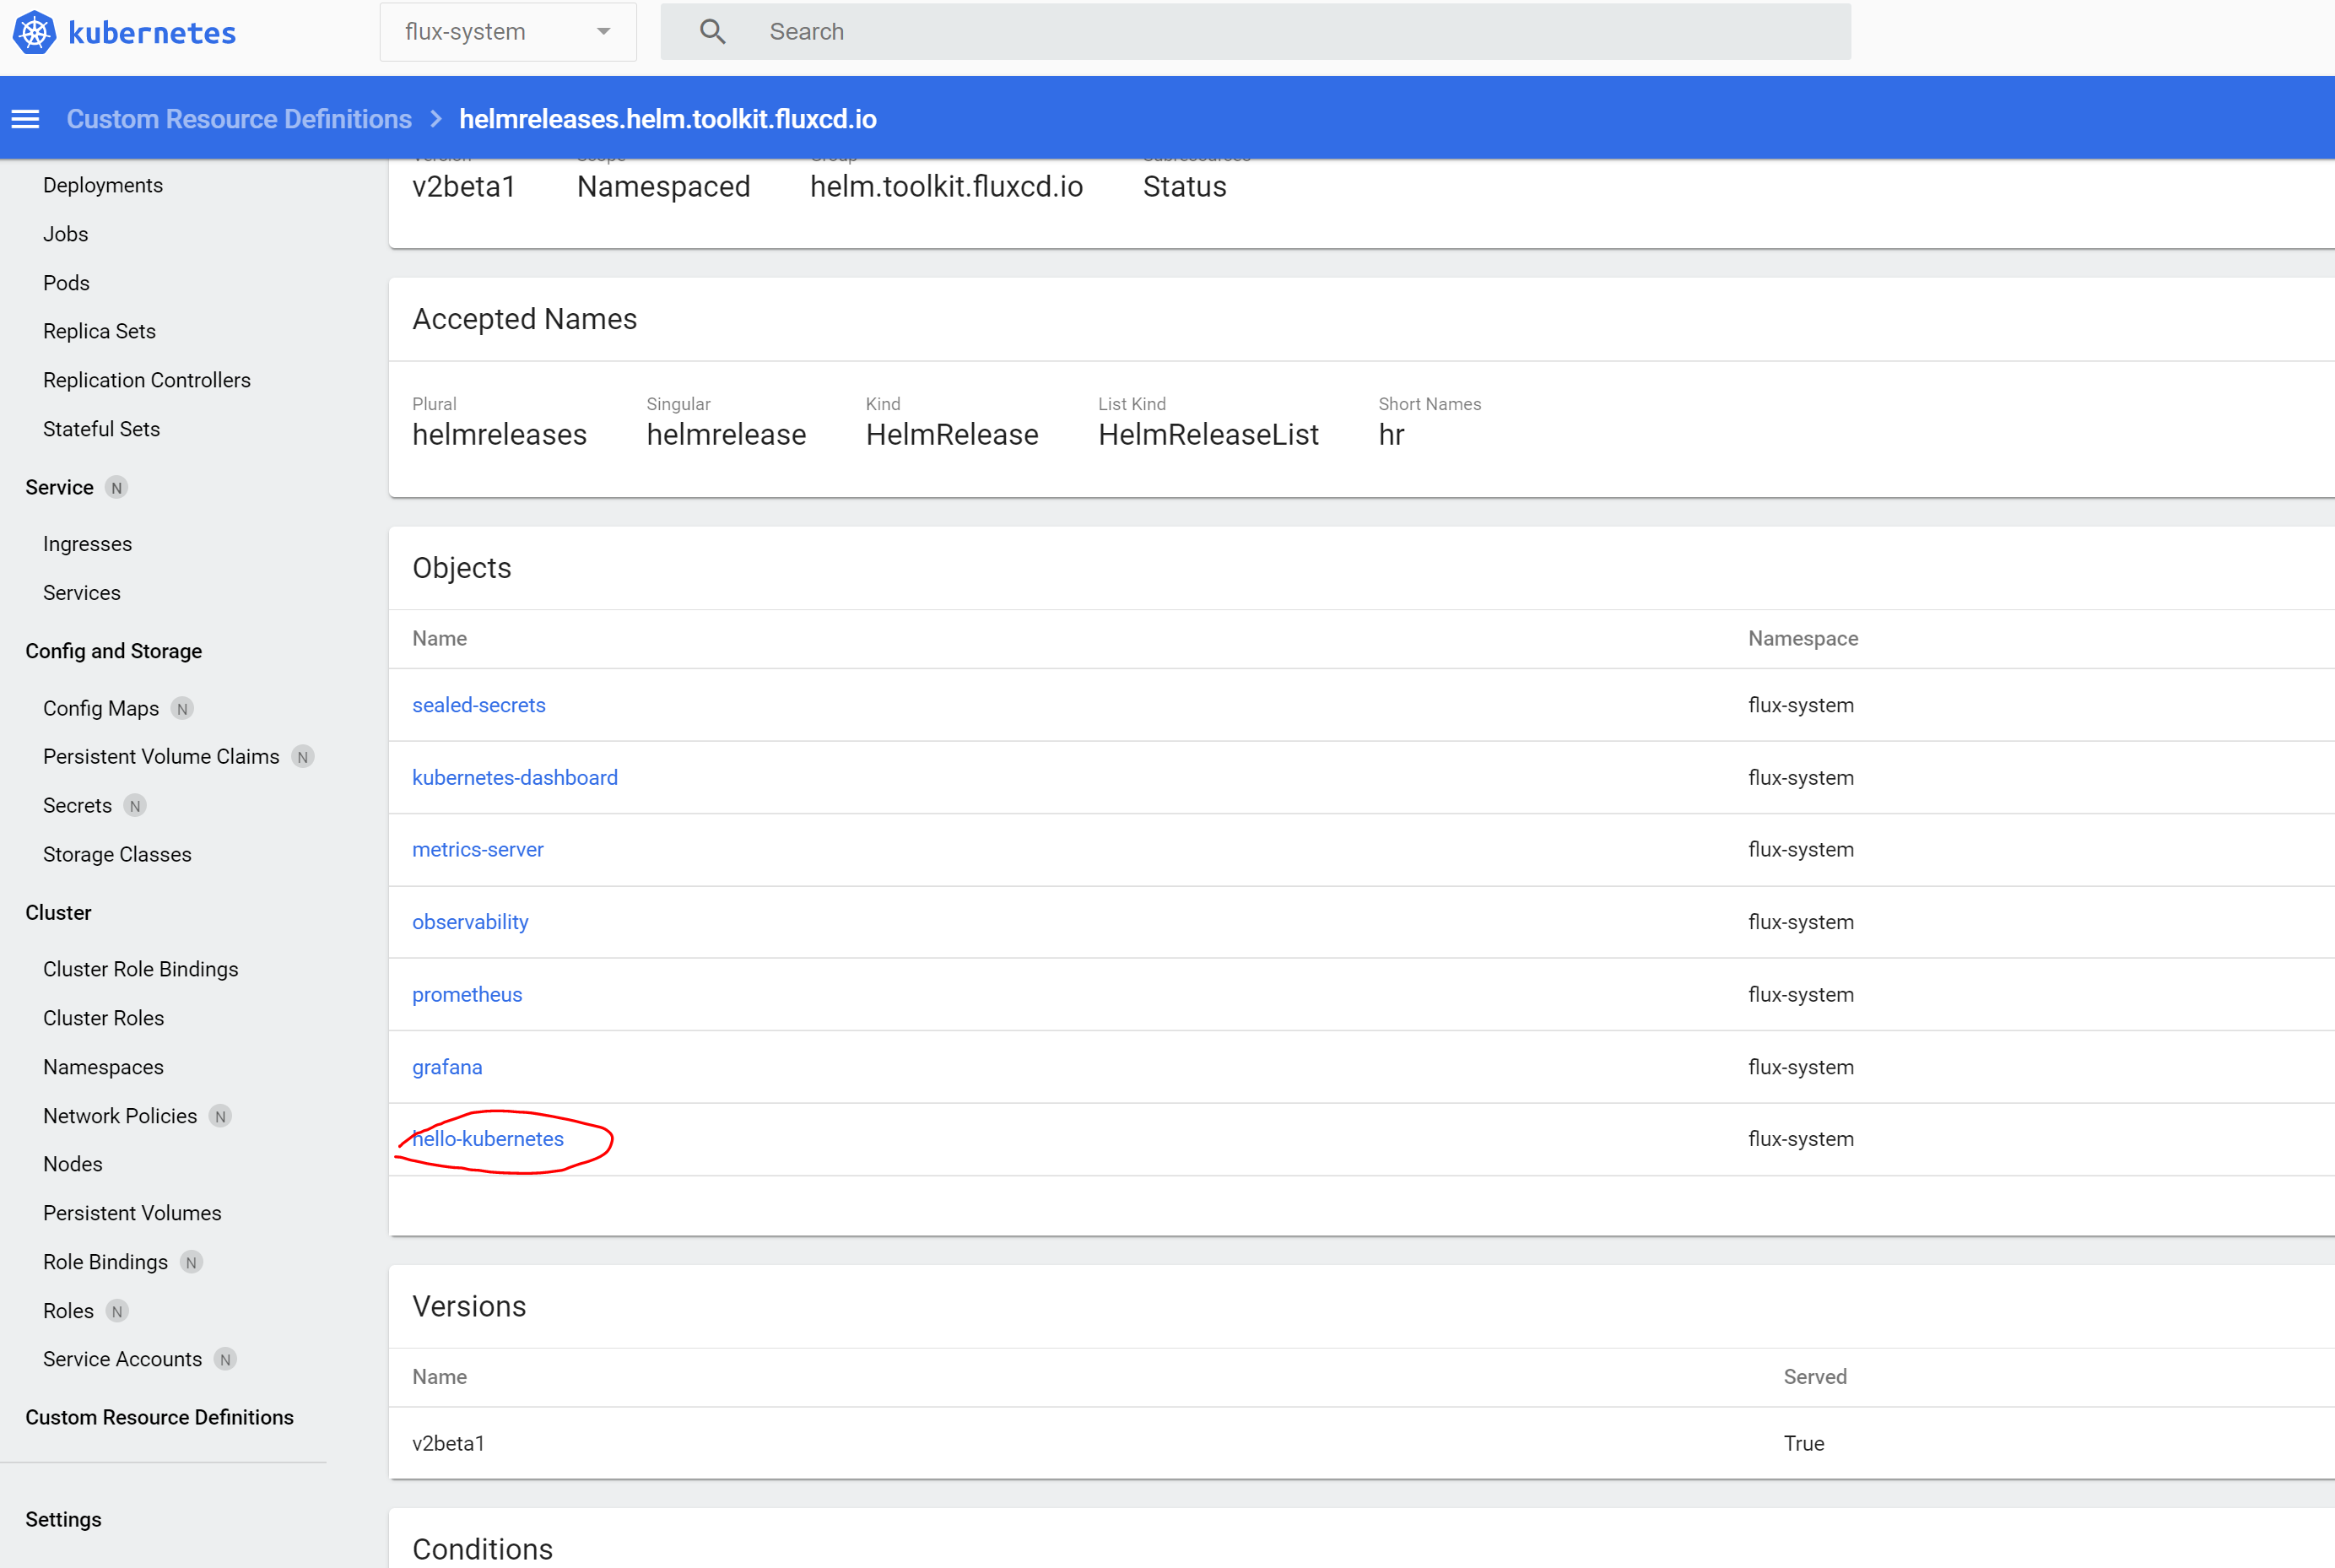
- Click on the hello-kubernetes object
We need these tools for the next step, because in this step we are going to capture different events.
-
Let’s open flux dashboard in Grafana
-
Open another browser window Enter the following URL http://workerIp:30001
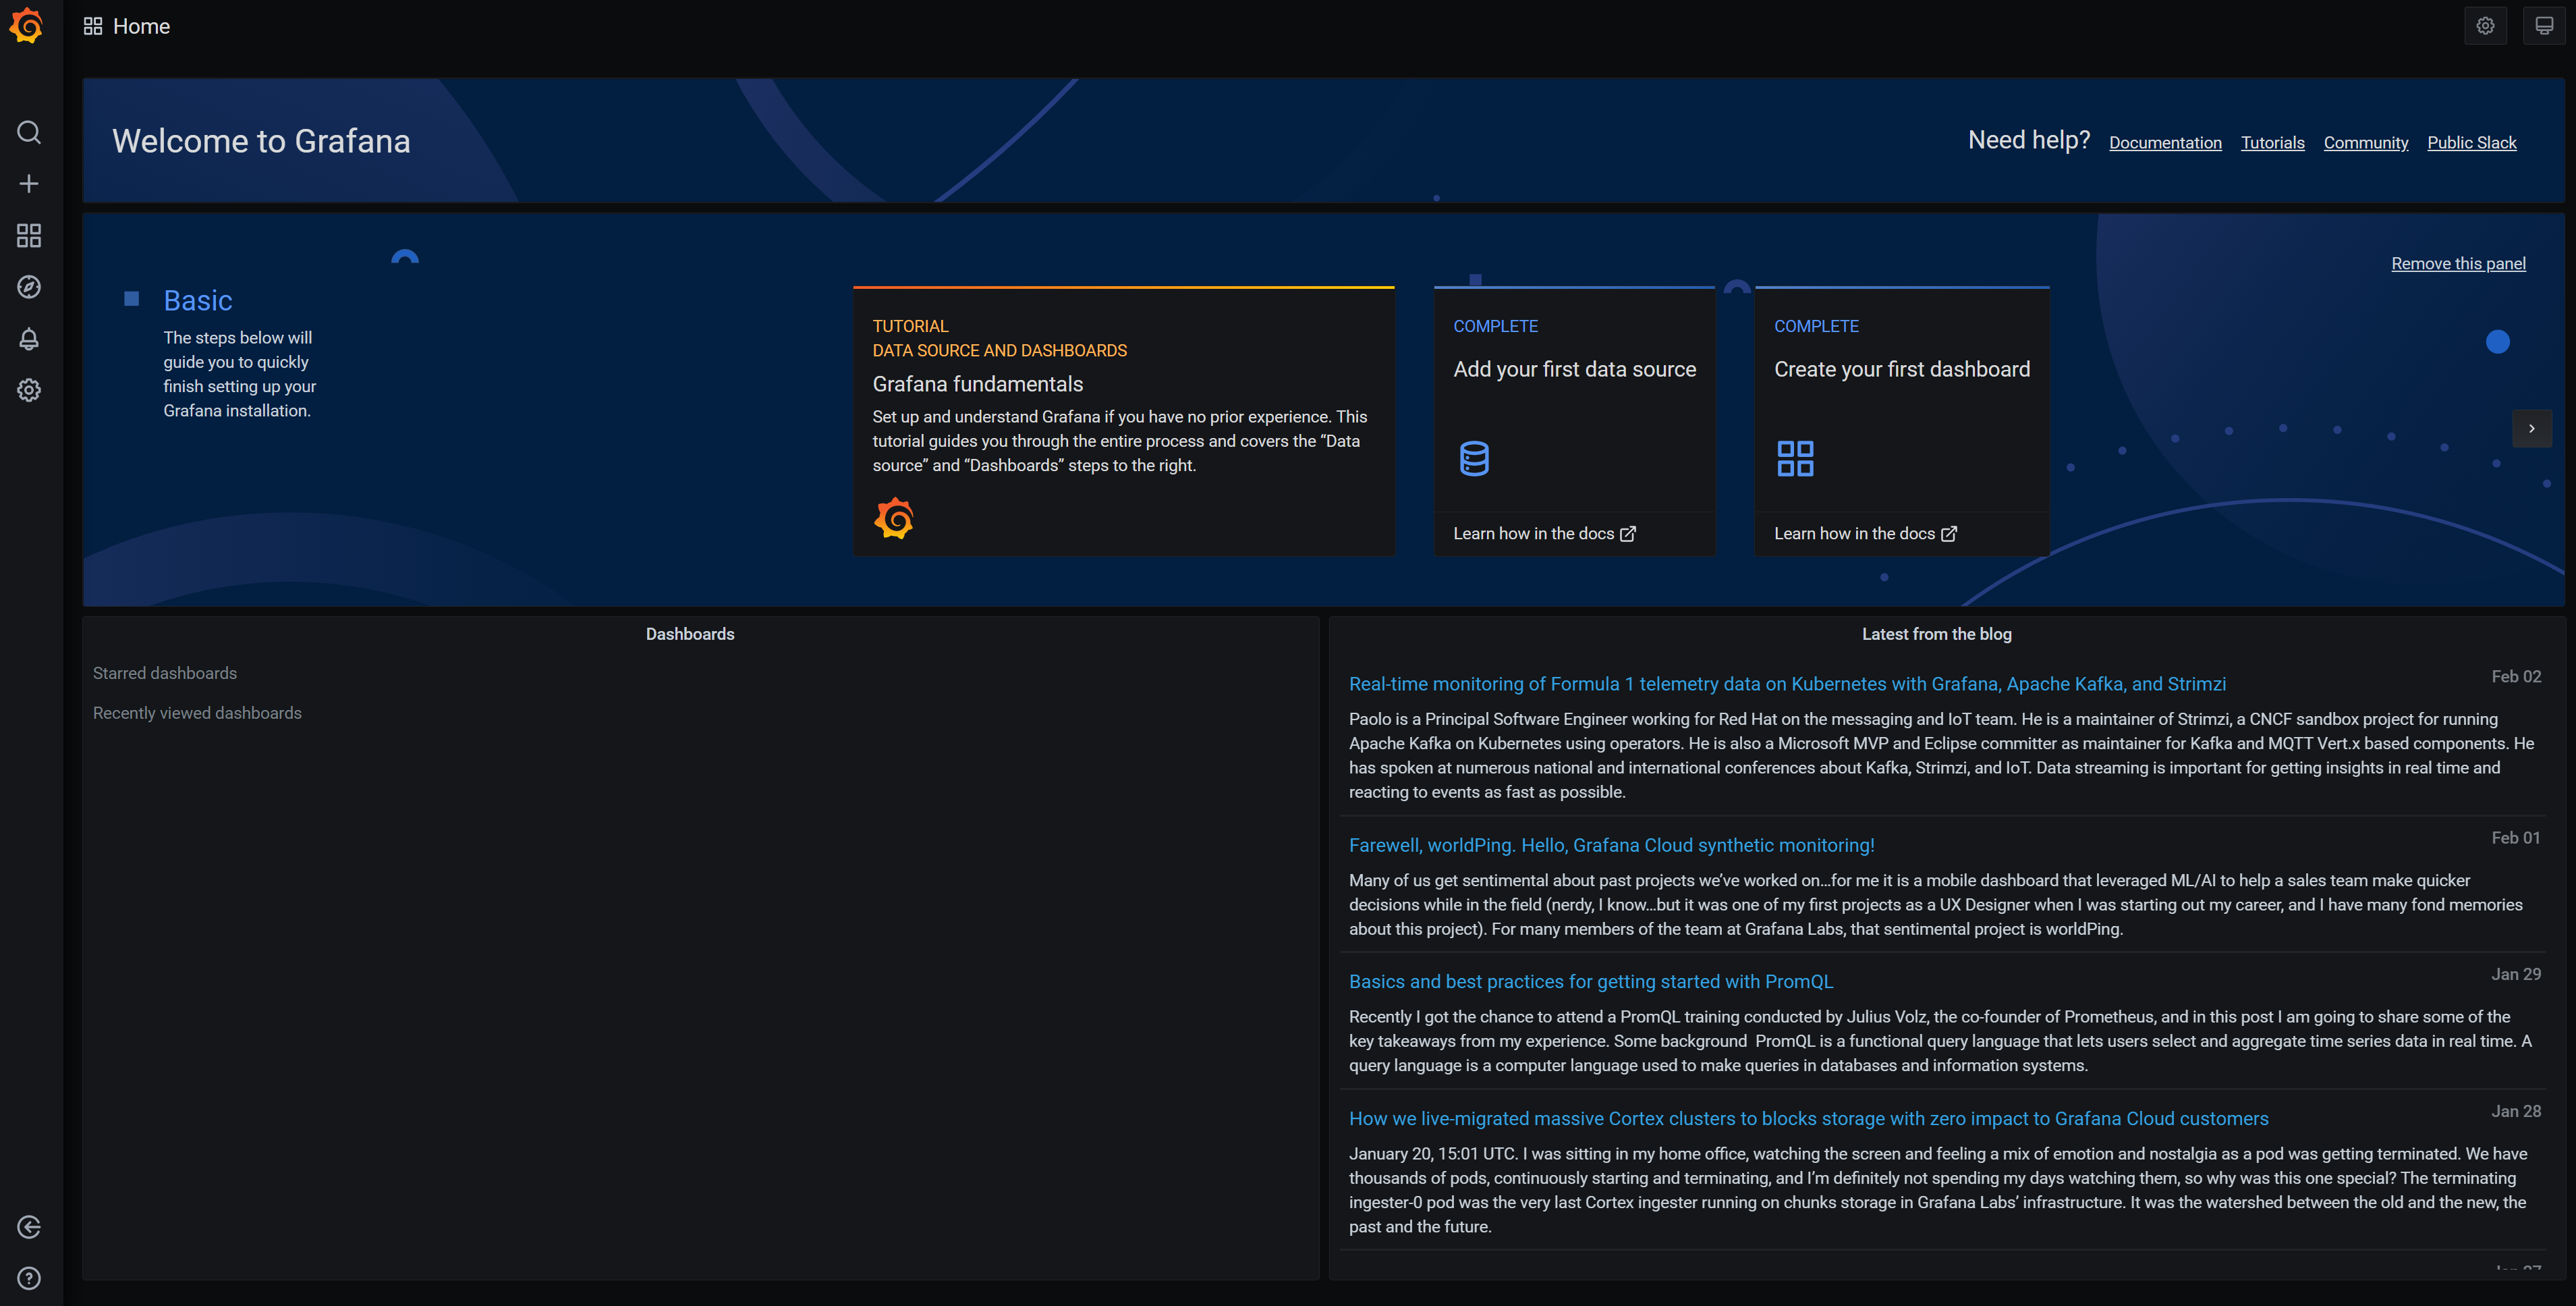
- Click on the Home from the top menu
- Choose Flux Cluster Stats – from the dashboards
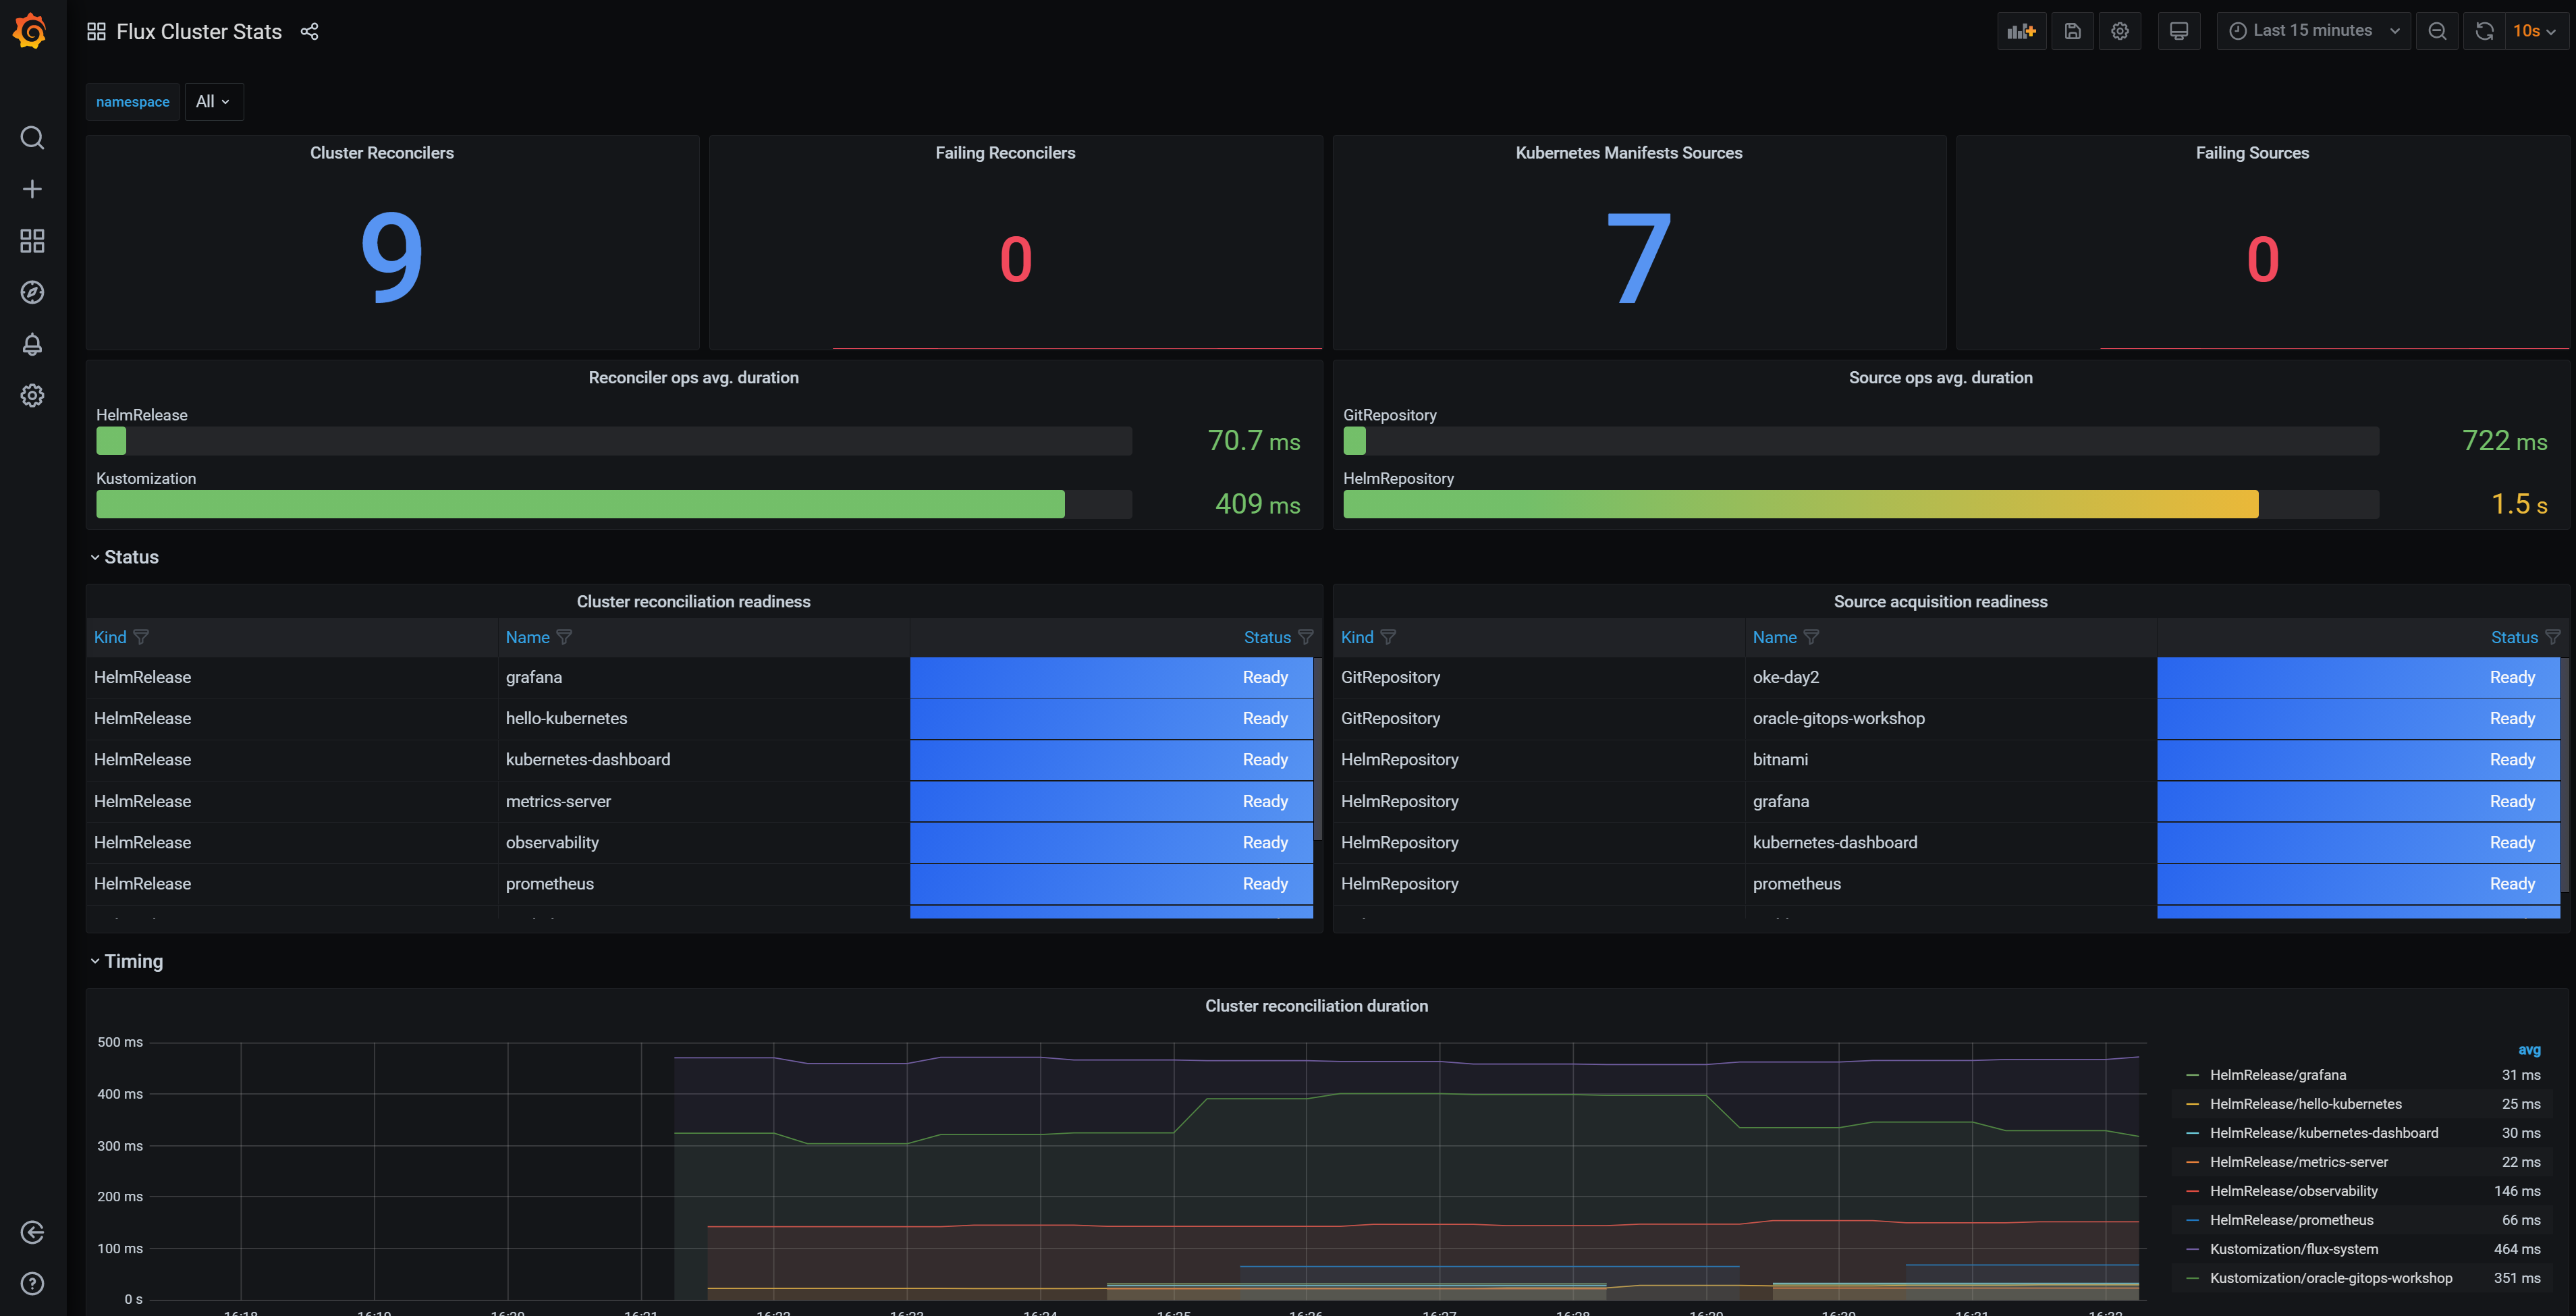
Here you will see the Flux dashboard with all the operations we are going to perform on the application.
Excellent, now you have provisioned oke-day2 tools, and you have more eyes on your system.
Continue to Part 8 Breaking the Helm Release
If you want to return to the workshop homepage: